
Chapter 7. Resource contention
This chapter covers
- Contention for worker processes in a Storm cluster
- Memory contention within a worker process (JVM)
- Memory contention on a worker node
- Worker node CPU contention
- Worker node network/socket input/output (I/O) contention
- Worker node disk I/O contention
In chapter 6, we discussed tuning at the individual topology level. Tuning is an important skill to master and will serve you well when you’re deploying topologies to production. But it’s only a small part of a bigger picture. Your topology is going to have to coexist on a Storm cluster with a variety of other topologies. Some of those topologies will burn CPU doing heavy mathematical calculations, some will consume large amounts of network bandwidth, and so on and so forth with a variety of resources.
In this chapter, we’ll present the various types of resources that can come under contention in a Storm cluster and explain how to address each of them. We hope that no single Storm cluster would have so many contention issues, so we’ve eschewed our usual case study format for a more appropriate cookbook approach. Take a quick skim through this chapter to gain a general understanding of the types of contention and then refer back to whatever section is relevant to you when you start encountering problems.
The first three recipes in this chapter focus on common solutions for addressing several types of contention presented later. We recommend reading through these three recipes first because they will give you a better understanding of what we’re talking about when we discuss a solution to a particular type of contention.
Throughout the chapter we use certain terminology when addressing the resources that can come under contention. It’s important to understand what part of a Storm deployment we’re referencing when you see certain terms. Figure 7.1 highlights these resources, with the key terms in bold. Most of this should already be familiar to you, but if not, make sure you take the time to study the terms and relationships between the various components before moving forward.
Figure 7.1. The various types of nodes in a Storm cluster and worker nodes broken down as worker processes and their parts

With the terminology defined, let’s get started with the first of our “common solution” recipes in our cookbook approach, changing the number of worker processes (JVMs) running on a worker node. Addressing these “common solution” recipes now will provide a nice reference for later and allow us to focus on why each is a good solution for a particular scenario.
Everyone’s experience administering, maintaining, and diagnosing issues in a Storm cluster will vary. We’ve tried to cover the major issues and some of the tools you’ll need. But your situation may vary from any we’ve encountered. The configuration of your cluster may vary in the number of machines, number of JVMs per machine, and so forth. No one can give you the answers for how to set up your cluster. The best we can do is present you with guidelines for adjusting to problems that arise. Because we’re addressing so many issues that exist at the operating system level and because there are so many operating systems that you could be running Storm on, we’ve decided to focus on one specific family of operating systems: Linux-based.
The OS-level tools discussed in this chapter should be available in every variation of Linux. Further, these tools should either exist or have an equivalent in any Unix-type OS such as Solaris or FreeBSD. For those of you considering using Windows, you’re going to have to do more work to translate the ideas over to your OS, but the general principles apply. It’s important to note that our discussion of tool usage is far from exhaustive—it’s intended to provide a basis for you to build on. To administer and diagnose problems in a production cluster, you’ll be required to learn more about the tools and the OS you’re running on. Man pages, search engines, the Storm mailing list, IRC channels, and your friendly neighborhood operations person are all excellent resources that you should lean on to learn more.
7.1. Changing the number of worker processes running on a worker node
In several of the recipes throughout this chapter, one of the solutions for addressing the contention in question is changing the number of worker processes running on a worker node (figure 7.2).
Figure 7.2. Many worker processes running on a worker node

In some cases, this means increasing worker processes and in others it means decreasing worker processes. It’s such a common solution that we’ve decided to break it into its own recipe so you can refer back to this section whenever we come across it as a solution.
7.1.1. Problem
You’re experiencing a contention where you need to either increase or decrease the number of worker processes running on a worker node.
7.1.2. Solution
The number of worker processes running on a worker node is defined by the supervisor.slots.ports property in each worker node’s storm.yaml configuration file. This property defines the ports that each worker process will use to listen for messages. The next listing shows the default settings for this property.
Listing 7.1. Default settings for supervisor.slots.ports
supervisor.slots.ports
 - 6701
 - 6702
 - 6703
 - 6704
To increase the number of worker processes that can be run on a worker node, add a port to this list for each worker process to be added. The opposite holds true for decreasing the number of worker processes: remove a port for each worker process to be removed.
After updating this property, you’ll need to restart the Supervisor process on the worker node to effect the change. If you installed Storm to /opt/storm, as we did in our installation run-through in chapter 5, this would require killing the Supervisor process and starting again with the following command:
/opt/storm/bin storm supervisor
Upon restarting, Nimbus will be aware of the updated configuration and send messages to only the ports defined in this list.
7.1.3. Discussion
Storm defaults to four worker processes per worker node, with each worker process listening on ports 6701, 6702, 6703, and 6704, respectively. This is usually good enough when you’re first starting to build a cluster, so don’t worry about trying to figure out the best configuration right away. But if you do need to add ports, be sure to check whether the ports you want to add are already in use by using a tool such as netstat on Linux.
Another thing to consider is the number of worker nodes you have in your cluster. If widespread changes are needed, updating the configuration and restarting the Supervisor process across hundreds or even tens of nodes is a tedious and time-consuming task. So we recommend a tool such as Puppet (http://puppetlabs.com) for automating the deployment and configuration of each node.
7.2. Changing the amount of memory allocated to worker processes (JVMs)
In a few of the recipes throughout this chapter, one of the solutions for addressing the contention in question is changing the amount of memory allocated to worker processes (JVMs) on a worker node.
In some cases this means increasing the amount of memory allocated and in others it means decreasing memory. Whatever the reason for the solution, the steps for changing this setting are the same, which is why we’ve dedicated a separate recipe to it.
7.2.1. Problem
You’re experiencing a contention where you need to either increase or decrease the amount of memory being used by the worker processes on a worker node.
7.2.2. Solution
The amount of memory allocated to all worker processes (JVMs) on a worker node can be changed in the worker.childopts property in each worker node’s storm.yaml configuration file. This property accepts any valid JVM startup option, providing the ability to set the startup options for the initial memory allocation pool (-Xms) and maximum memory allocation pool (-Xmx) for the JVMs on the worker node. The following listing shows what this would look like, focusing only on the memory-related arguments.
Listing 7.2. Setting worker.childopts in storm.yaml
worker.childopts: "...
-Xms512m
-Xmx1024m
..."
It’s important to be aware that changing this property will update all the worker processes on a particular worker node. After updating this property, you’ll need to restart the Supervisor process on the worker node to effect the change. If you installed Storm to /opt/storm, as we did in our installation run-through in chapter 5, this would require killing the Supervisor process and starting again with the following command:
/opt/storm/bin storm supervisor
Upon restarting, all of the worker processes (JVMs) on the worker node should be running with the updated memory settings.
7.2.3. Discussion
One thing to keep in mind when increasing JVM sizes is to make sure the worker node (machine/VM) itself has the resources for such size increases. If the worker node doesn’t have enough memory to support whatever you set the –Xmx value to, you’ll need to change the sizing of the actual machines/VMs before changing the amount of memory allocated to the JVM.
Another tip we highly recommend following is setting –Xms and –Xmx to the same value. If these values are different, the JVM will manage the heap, sometimes increasing and sometimes decreasing the heap size, depending on heap usage. We find the overhead of this heap management to be unnecessary and therefore recommend setting both to the same value to eliminate any heap management overhead. Along with being more efficient, this strategy has the added benefit of making it easier to reason about JVM memory usage, because the heap size is a fixed constant for the life of the JVM.
7.3. Figuring out which worker nodes/processes a topology is executing on
Many of the recipes in this chapter involve contentions at both the worker node and worker process level. Often these contentions will manifest themselves in the form of a topology throwing errors in the Storm UI, experiencing reduced throughput, or having no throughput at all. In all these scenarios, you’ll most likely need to identify which worker nodes and worker processes that particular topology is executing on.
7.3.1. Problem
You have a problematic topology and need to identify the worker nodes and worker processes that topology is executing on.
7.3.2. Solution
The way to do this is by looking at the Storm UI. You want to start out by looking at the UI for the specific topology in question. We suggest checking out the Bolts section to see if anything looks amiss. As figure 7.3 shows, one of the bolts is having issues.
Figure 7.3. Diagnosing issues for a particular topology in the Storm UI

Having identified the problematic bolt, you now want to see more details about what’s happening with that bolt. To do so, click on that bolt’s name in the UI to get a more detailed view for that bolt. From here, turn your attention to the Executors and Errors section for the individual bolt (figure 7.4).
Figure 7.4. Looking at the Executors and Errors portion of the Storm UI for a particular bolt to determine the type of issue the bolt is having while also determining the worker nodes and worker processes that bolt is executing on

The Executors section for an individual bolt is of particular interest; this tells you which worker nodes and worker processes the bolt is executing on. From here, given the type of contention being experienced, you can take the necessary steps to identify and solve the problem at hand.
7.3.3. Discussion
The Storm UI is your friend. Become familiar with its various screens. It’s normally the first place we look when diagnosing any type of contention. Being able to quickly identify a problematic topology, bolt, worker node, and worker process has been extremely valuable in our experience.
Though a great tool, the Storm UI may not always show you what you need. This is where additional monitoring can help. This can come in the form of monitoring the health of individual worker nodes or custom metrics in your bolt’s code to give you a deeper insight into how well the bolt is performing. The bottom line here is you shouldn’t rely solely on the Storm UI. Put other measures in place to make sure you have coverage everywhere. After all, it’s not a matter of if something will break; it’s a matter of when.
7.4. Contention for worker processes in a Storm cluster
When you install a Storm cluster, you install it with a fixed number of available worker processes across all your worker nodes. Each time you deploy a new topology to the cluster, you specify how many worker processes that topology should consume. It’s easy to get yourself into a situation where you deploy a topology that requires a certain number of worker processes but you can’t obtain those worker processes because they’ve all been assigned to existing topologies. This renders the topology in question useless, because it can’t process data without worker processes. Figure 7.5 illustrates this point.
Figure 7.5. Example Storm cluster where all of the worker processes have been assigned to topologies.

Figure 7.5 illustrates a problem we’ve experienced firsthand several times. Fortunately, this problem is easy to detect; it can be found by looking at the cluster summary page of the Storm UI (figure 7.6).
Figure 7.6. Storm UI: Zero free slots could mean your topologies are suffering from slot contention.

7.4.1. Problem
You notice a topology isn’t processing any data or has a sudden drop in throughput and zero free slots are available, according to the Storm UI.
7.4.2. Solution
The bottom line is you have a fixed number of worker processes that can be allocated to the topologies requesting them. You can address this problem with these strategies:
- Decreasing the number of worker processes in use by existing topologies
- Increasing the total number of worker processes in the cluster
Decreasing the number of worker processes in use by existing topologies
This is the quickest and easiest way to free up slots for other topologies in your cluster. But this may or may not be possible depending on the SLAs for your existing topologies. If you can reduce the number of worker processes being used by a topology without violating the SLA, we recommend this approach.
The number of worker processes a topology requests is specified in the code for building and submitting your topology to the Storm cluster. The next listing shows this code.
Listing 7.3. Configuring the number of worker processes for a topology

If your SLAs don’t allow you to reduce the number of slots being used by any of the topologies in your cluster, you’ll have to add new worker processes to the cluster.
Increasing the total number of worker processes in the cluster
There are two ways to increase the total number of worker processes in the cluster. One is by adding more worker processes to your worker nodes via the steps listed in section 7.1. But this won’t work if your worker nodes don’t have the resources to support additional JVMs. If this is the case, you’ll need to add more worker nodes to your cluster, thus adding to the pool of worker processes.
We recommend adding new worker nodes if you can. This approach has the least impact on existing topologies, because adding worker processes to existing nodes has the potential to cause other types of contention that must then be addressed.
7.4.3. Discussion
Worker process contention can have a variety of causes, some of which are self-inflicted and some of which aren’t. Scenarios include the following:
- You deploy a topology that’s configured to consume more worker processes than there are slots available in the cluster.
- You deploy a topology to your cluster that has no available slots.
- A worker node goes down, thus decreasing the number of available slots, possibly causing contention among existing topologies.
It’s important to always be aware of the resources available in your cluster when deploying new topologies. If you ignore what’s available within your cluster, you can easily affect every topology in your cluster by deploying something that consumes too many resources.
7.5. Memory contention within a worker process (JVM)
Just as you install a Storm cluster with a fixed number of worker processes, you also set up each worker process (JVM) with a fixed amount of memory it can grow to use. The amount of memory limits the number of threads (executors) that can be launched on that JVM—each thread takes a certain amount of memory (the default is 1 MB on a 64-bit Linux JVM).
JVM contention can be a problem on a per-topology basis. The combination of memory used by your bolts, spouts, threads, and so forth might exceed that allocated to the JVMs they’re running on (figure 7.7).
Figure 7.7. Worker processes, executors and tasks mapping to the JVM, threads and instances of spouts/bolts, and the threads/instances contending for memory in the same JVM

JVM contention usually manifests itself as out-of-memory (OOM) errors and/or excessively long garbage collection (GC) pauses. OOM errors will appear in the Storm logs and Storm UI, usually as a stack trace starting with java.lang.OutOfMemory-Error: Java heap space.
Gaining visibility into GC issues requires a little more setup, but it’s something that’s easily supported by both the JVM and Storm configuration. The JVM offers startup options for tracking and logging GC usage, and Storm provides a way to specify JVM startup options for your worker processes. The worker.childopts property in storm.yaml is where you’d specify these JVM options. The following listing shows a sample storm.yaml configuration in a worker node.
Listing 7.4. Setting up GC logging for worker processes
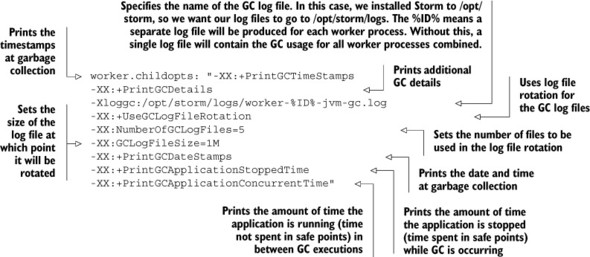
One interesting item to note is the value for the –Xloggc setting. Remember you can have multiple worker processes per worker node. The worker.childopts property applies to all worker processes on a node, so specifying a regular log filename would produce one log file for all the worker processes combined. A separate log file per worker process would make tracking GC usage per JVM easier. Storm provides a mechanism for logging a specific worker process; the ID variable is unique for each worker process on a worker node. Therefore, you can add a "%ID%" string to the GC log filename and you’ll get a separate GC log file for each worker process.
Reading GC logs can be a little daunting at first, so we’re going to run through a quick tutorial outlining what the options in listing 7.4 will produce in the associated logs. This listing shows example output for a GC cycle that included both a minor (young generation) and major collection (tenured generation). It’s entirely possible that not every single GC log statement will include major collection statistics, because major collections don’t occur during every GC cycle. But for the sake of completeness, we wanted to include both.
Java uses what’s called generational garbage collection. This means memory is divided into different “generations,” and as objects survive enough GC events, they get promoted to older generations. Objects will start out in what’s called the young generation and eventually get promoted to the tenured generation if they survive enough GC events while in young generation. A collection of young generation object references is called a minor collection; a collection of tenured generation objects is called a major collection.
Listing 7.5. Sample GC log output
2014-07-27T16:29:29.027+0500: 1.342: Application time: 0.6247300 seconds

2014-07-27T16:29:29.027+0500: 1.342: [GC 1.342: [DefNew: 8128K->8128K(8128K),
     0.0000505 secs] 1.342: [Tenured: 18154K->2311K(24576K), 0.1290354 secs]
     26282K->2311K(32704K), 0.1293306 secs]

2014-07-27T16:29:29.037+0500: 1.353: Total time for which application threads
     were stopped: 0.0107480 seconds
Let’s break down each of the parts in this output. Figure 7.8 shows the first line, containing the length of time the application has been running since the last GC.
Figure 7.8. GC log output showing the output for –XX:+PrintGCDateStamps, –XX:+PrintGCTimeStamps, and –XX:+PrintGCApplicationConcurrentTime

The next line is the result of the –XX:+PrintGCDetails option and is broken down into several figures in order to better explain what’s being represented. We’ve excluded the date/timestamps for the sake of keeping the figures simpler. Figure 7.9 shows the GC details for the minor collection of the young generation.
Figure 7.9. GC log output showing details of a minor garbage collection of young generation memory

The GC details for the major collection of the tenured generation are shown in Figure 7.10. Figure 7.11 shows the final part of the –XX:+PrintGCDetails output, which shows the overall heap values along with how long the entire GC cycle took.
Figure 7.10. GC log output showing details of a major garbage collection of tenured generation memory

Figure 7.11. GC log output showing entire heap values and complete GC time

With the first and second lines of the GC output covered, the last line of the output is simple; the –XX:+PrintGCApplicationStoppedTime option results in a line like the following: 2014-07-27T16:29:29.037+0500: 1.353: Total time for which application threads were stopped: 0.0107480 seconds. This provides a more summary-level description of how long the application was paused due to GC.
And that’s it. What looks daunting at first is easily explained when you break it down into smaller pieces. Being able to read these logs will help you tremendously when debugging JVM contention issues not only in Storm, but in any application running on a JVM. With an understanding of how to set up and read GC logs along with knowing how to find OOM errors, you’ll be able to identify whether your topologies are experiencing JVM contention.
7.5.1. Problem
Your spouts and/or bolts are attempting to consume more memory than what has been allocated to the JVM, resulting in OOM errors and/or long GC pauses.
7.5.2. Solution
You can address the problem in a couple of ways:
- By increasing the number of worker processes being used by the topology in question
- By increasing the size of your JVMs
Increasing the number of worker processes being used by the topology in question
See section 7.1 for steps on doing this. By adding a worker process to a topology, you’ll decrease the average load across all worker processes for that topology. This should result in a smaller memory footprint for each worker process (JVM), hopefully eliminating the JVM memory contention.
Increasing JVM (worker process) size
See section 7.2 for steps on how to do this. Because increasing the size of your JVMs could require you to change the size of the machines/VMs they’re running on, we recommend the “increase worker processes” solution if you can.
7.5.3. Discussion
Swapping and balancing memory across JVMs has been one of our biggest challenges with Storm. Different topologies will have different memory usage patterns. Over time, we’ve gone from having four worker processes per worker node, each using 500 MB of memory, to two worker processes per worker node, each using 1 GB of memory.
Our topologies had high enough parallelism that the cost of memory per thread was making tuning at 500 MB problematic. At 1 GB per worker process, we have plenty of headroom for most topologies. Some get close to that limit, so we start spreading out the load more across multiple worker nodes.
Don’t worry if you don’t get it right initially. We’ve been running Storm in production for a couple of years now and are still tweaking the amount of memory per worker process and worker processes per machine as our topologies change, grow, and expand. Just remember, this is a never-ending process as the shape of your cluster and topologies changes.
Beware when increasing the memory allocated to a JVM; as a rule of thumb, when you cross certain key points you’ll notice a change in how long garbage collection takes—500 MB, 1 GB, 2 GB, and 4 GB are all around the points when our GC time has taken a jump. It’s more art than science, so bring your patience with you. There’s nothing more frustrating than addressing OOM issues by increasing JVM memory size only to have it noticeably impact GC times.
7.6. Memory contention on a worker node
Much like how an individual JVM has a limited amount of available memory, so does a worker node as a whole. In addition to the memory needed to run your Storm worker processes (JVMs), you need memory to run the Supervisor process and any other processes on your worker node without swapping (figure 7.12).
Figure 7.12. A worker node has a fixed amount of memory that’s being used by its worker processes along with any other processes running on that worker node.

If a worker node is experiencing memory contention, that worker node will be swapping. Swapping is the little death and needs to be avoided if you care about latency and throughput. This is a problem when using Storm; each worker node needs to have enough memory so that the worker processes and OS don’t swap. If you want to maintain consistent performance, you must avoid swapping with Storm’s JVMs.
One way to keep an eye on this in Linux is with the sar (System Activity Reporter) command. This is a Linux-based system statistics command that collects and displays all system activities and statistics. We run this command in the format of sar [option] [interval [count]] (figure 7.13).
Figure 7.13. sar command breakdown

Various options can be passed in to display specific types of statistics. For diagnosing worker node memory contention, we use the –S option for reporting swap space utilization statistics. Figure 7.14 illustrates the output for swap space utilization.
Figure 7.14. Output of sar –S 1 3 for reporting swap space utilization

The only way to avoid contention at the OS level is to sidestep it entirely! What do we mean by that? Well, let’s explain.
If you run a single worker process per worker node, it’s impossible to run into contention between workers on that node. This can make maintaining consistent performance within a cluster much easier. We know of more than one development team that has opted for this approach. If possible, we advise you to seriously consider going this route.
This is a nonstarter if you aren’t running in a virtualized environment. The cost is simply too high to do this if you’re running on “bare metal” with a single OS instance per physical machine. Within a virtualized environment, you’ll use more resources by doing this. Assume for a moment that your OS install requires n GB of disk space and uses 2 GB of memory to run effectively. If you have eight workers running on your cluster and you assign four workers per node, you’d use n * 2 GB of disk and 4 GB of memory to run the OS on your cluster nodes. If you were to run a single worker per node, that would skyrocket to n * 8 GB of disk and 16 GB of memory. That’s a fourfold increase in a rather small cluster. Imagine the additional usage that would result if you had a cluster that was 16, 32, 128, or more nodes in size. If you’re running in an environment such as Amazon Web Services (AWS) where you pay per node, the costs can add up quickly. Therefore, we suggest this approach only if you’re running in a private virtualized environment where the cost of hardware is relatively fixed and you have disk and memory resources to spare.
If that limited scenario doesn’t describe you, don’t worry; we have plenty of tips in the following pages to help you out as well. And even if it does describe you, you’re going to want to familiarize yourself with the following material anyway because a single topology can still run up against these problems.
7.6.1. Problem
Your worker node is swapping due to contention for that node’s memory.
7.6.2. Solution
Here’s how you can address this problem:
- Increase the memory available to each worker node. This would mean giving more memory to the physical machine or VM, depending on how you configured your cluster.
- Lower the collective memory used by worker processes.
Lowering the collective memory used by worker processes
Lowering the collective memory used by worker processes can be done in one of two ways. The first is by reducing the number of worker processes per worker node. See section 7.1 for the appropriate steps. Reducing the total number of worker processes will lower the overall memory footprint of the combined remaining processes.
The second way is by reducing the size of your JVMs. See section 7.2 for those steps. Be careful when lowering memory allocated to existing JVMs, though, to avoid introducing memory contention within the JVM.
7.6.3. Discussion
Our solution is to always go the route of increasing the memory available to each machine. It’s the simplest solution and its resulting ramifications are the easiest to understand. If you are tight on memory, lowering memory usage can work, but you open yourself up to all the problems we discussed concerning GC and OOM on a per-JVM basis. Long story short, if you have the memory to spare, go with increasing memory on each machine.
7.7. Worker node CPU contention
Worker node CPU contention occurs when the demand for CPU cycles outstrips the amount available. This is a problem when using Storm and is one of the primary sources of contention in a Storm cluster. If your Storm topology’s throughput is lower than what you expect it to be, you may want to check the worker node(s) running your topology to see if CPU contention exists.
One way to keep an eye on this in Linux is with the sar command, passing in the option –u for displaying real-time CPU usage of all CPUs. Figure 7.15 illustrates the output for CPU usage along with the columns you’ll want to keep an eye on.
Figure 7.15. Output of sar –u 1 3 for reporting CPU utilization

7.7.1. Problem
The throughput of your topologies is low, and based on running the sar command, you see that CPU contention exists.
7.7.2. Solution
To address the problem, you have the following options:
- Increasing the number of CPUs available to the machine. This is only possible in a virtualized environment.
- Upgrading to a more powerful CPU (Amazon Web Services (AWS) type of environment).
- Spreading the JVM load across more worker nodes by lowering the number of worker processes per worker node.
Spreading JVM load across more worker nodes
To spread worker process (JVM) load across more worker nodes, you need to reduce the number of worker processes running on each worker node (see section 7.1 for those steps). Reducing the number of worker processes per worker node results in less processing (CPU requests) being done on each worker node. There are two scenarios you may find yourself in when attempting this solution. The first is you have unused worker processes in your cluster and can therefore reduce the number of worker processes on your existing nodes, thus spreading the load (figure 7.16).
Figure 7.16. Reducing the number of worker processes per worker node in a cluster where there are unused worker processes

The second scenario is where you don’t have any unused worker processes and therefore need to add worker nodes in order to reduce the number of worker processes per worker node (figure 7.17).
Figure 7.17. Reducing the number of worker processes per worker node in a cluster where there are no unused worker processes, resulting in more worker nodes being added

Reducing the number of worker processes per worker node is a good way to reduce the number of CPU cycles being requested on each node. You just need to be aware of what resources are available and in use and act appropriately in your given scenario.
7.7.3. Discussion
If you’re like us and run your own private cloud, the first option is a great one. Your Storm nodes are running across different host machines with x number of CPUs available (in our case, 16). When we first started using Storm, our computational needs were much lower, and we assigned a max of two cores to each node. Eventually that became problematic and we moved to four and then eight. Most of the time, each node isn’t using all the CPU, but it’s there when needed.
You can follow the same pattern in AWS and other hosted solutions by upgrading to a more powerful CPU and/or number of available cores. But you’re going to hit a limit. There’s only so much CPU time to go around among all those guest machines running on a single physical box. If you hit that point or can’t scale up CPUs, distributing the load across more machines is your only option.
So far, we’ve never had to solve CPU usage issues in this way (but we’ve solved others’ issues in such a fashion). And sometimes, we’ve solved the problem entirely differently. It turned out that one time our issue was a bug that caused a topology to burn CPU needlessly over and over in a tight loop. That’s always what you should check for first, but leading with “Are you sure you didn’t mess up?” seemed like a less than friendly way to start the discussion.
7.8. Worker node I/O contention
I/O contention on a worker node can fall under one of two categories:
- Disk I/O contention, reading from and writing to the file system
- Network/socket I/O contention, reading from and writing to a network via a socket
Both types of contention are regularly an issue for certain classes of Storm topologies. The first step in determining if you’re experiencing either of these contentions is to establish whether a worker node is experiencing I/O contention in general. Once you do, you can dive down into the exact type of I/O contention your worker node is suffering from.
One way to determine if a worker node in your cluster is experiencing I/O contention is by running the sar command with the –u option for displaying real-time CPU usage. This is the same command we ran for CPU contention in section 7.7, but this time we’ll focus on a different column in the output (figure 7.18).
Figure 7.18. Output of sar –u 1 3 for reporting CPU utilization and, in particular, I/O wait times

A healthy topology that uses a lot of I/O shouldn’t spend a lot of time waiting for the resources to become available. That’s why we use 10.00% as the threshold at which you start experiencing performance degradation.
You might think distinguishing between socket/network and disk I/O contention is a difficult task, but you’d be surprised at how often your own intuition will lead you to the correct choice. Let’s explain.
If you know what topologies are running on a given worker node (section 7.3 discusses determining this), you know that they use a lot of network resources or disk I/O, and you see iowait problems, you can probably safely assume which of the two is your issue. Here’s a simple test to help you with that: if you’re seeing troubling I/O contention signs, first attempt to determine if you’re suffering from socket/network I/O contention. If you aren’t, assume that you’re suffering from disk I/O contention. Although this might not always be the case, it can take you a long way as you learn the tools of the trade.
Let’s dive a little deeper into each of the I/O contentions to give you a fuller understanding of what we’re talking about.
7.8.1. Network/socket I/O contention
If your topologies interact over a network with external services, network/socket I/O contention is bound to be a problem for your cluster. In our experience, the main cause for this type of contention is that all of the ports allocated for opening sockets are being used.
Most Linux installs will default to 1024 maximum open files/sockets per process. In an I/O-intensive topology, it’s easy to hit that limit quickly. We’ve written topologies that open several thousand sockets per worker node. To determine the limits of your OS, you can examine the /proc filesystem to check your processes limits. In order to do this, you’ll first need to know your process ID. Once you do that, you can get a listing of all limits for that process. The following listing shows you how to use the ps and grep commands to find your process ID (aka PID) and then how to get your process limits from the /proc filesystem.
Listing 7.6. Determining your resource limits

If you’re hitting this limit, the Storm UI for your topology should display an exception in the “Last Error” column that the max open files limit has been reached. This will most likely be a stack trace starting with java.net.SocketException: Too many open files.
We’ve never seen a saturated network link, but we know it’s theoretically possible, so we mention it here instead of devoting an entire recipe to it. Depending on your operating system, you can use various tools to determine whether your network link is saturated. For Linux, we recommend iftop.
There are two things you can do for a saturated network link: 1) get a faster network or 2) lower the number of worker processes per worker node in order to spread the load across more machines; this will work as long as you’re overloading your local network and not the entire network in general.
Problem
Your topology is experiencing reduced throughput or no throughput at all, and you’re seeing errors for hitting the limit of open sockets.
Solution
A couple of ways to address this problem are as follows:
- Increasing the number of available ports on the worker node
- Adding more worker nodes to the cluster
For increasing the number of available ports, you’ll need to edit the /etc/security/limits.conf file on most Linux distributions. You can add lines such as the following:
* soft nofile 128000
* hard nofile 25600
These settings will set the hard and soft limit on open files per user. The value we’re concerned with as a Storm user is the soft limit. We don’t advise going higher than 128k. If you do, then as a rule of thumb (until you learn more about soft/hard limits for number of files open on Linux), we suggest setting the hard limit to two times the value of the soft limit. Note that you need super-user access to change limits.conf and you’re going to need to reboot the system to make sure they take effect.
Increasing the number of worker nodes in the cluster will give you access to more ports. If you don’t have the resources to add more physical machines or VMs, you’ll have to try the first solution.
Discussion
The first real contention issue we hit was the number of sockets available per machine. We use a lot of them because a number of our topologies make lots of calls to external services to look up additional information that isn’t available from our initial incoming data. Having a high number of sockets available is a must. Don’t add more workers on other machines until you’ve increased available sockets on each node as much as you can. Once you’ve done that, you should also look at your code.
Are you opening and closing sockets all the time? If you can keep connections open, do that. There’s this wonderful thing called TCP_WAIT. It’s where a TCP connection will stay open after you close it waiting for any stray data. If you’re on a slow network link (like many were when TCP was first designed), this is a wonderful idea that helps prevent data corruption. If you’re on a fast modern LAN, it’ll drive you insane. You can tune your TCP stack via various OS-specific means to lower how long you linger in TCP_WAIT, but when you’re making tons of network calls, even that won’t be enough. Be smart: open and close connections as little as possible.
7.8.2. Disk I/O contention
Disk I/O contention affects how quickly you can write to disk. This could be a problem with Storm but should be exceedingly rare. If you’re writing large volumes of data to your logs or storing the output of calculations to files on the local filesystem, it might be an issue, but that should be unlikely.
If you have a topology that’s writing data to disk and notice its throughput is lower than what you’re expecting, you should check to see if the worker nodes it’s running on are experiencing disk I/O contention. For Linux installations, you can run a command called iotop to get a view of the disk I/O usage for the worker nodes in question. This command displays a table of current I/O usage by processes/threads in the system, with the most I/O-intensive processes/threads listed first. Figure 7.19 shows the command and its associated output, along with the parts of the output we’re interested in.
Figure 7.19. The output for the iotop command and what to look for when determining if a worker node is experiencing disk I/O contention

Problem
You have a topology that reads/writes to/from disk, and it looks like the worker nodes it’s running on are experiencing disk I/O contention.
Solution
To address this problem
- Write less data to disk. This can mean cutting back within your topology. It can also mean putting fewer worker processes on each worker node if multiple worker processes are demanding disk on the same worker node.
- Get faster disks. This could include using a RAM disk.
- If you’re writing to NFS or some other network filesystem, stop immediately. Writing to NFS is slow and you’re setting yourself up for disk I/O contention if you do.
Discussion
Slow disk I/O sucks. It drives us insane. The worst part is fast disks aren’t cheap. The disks that we run our Storm workers on are fairly slow. We save our fast disks for stuff where we really need speed: Elasticsearch, Solr, Riak, RabbitMQ, and similar write-heavy parts of our infrastructure. If you’re writing large amounts of data to disk and you don’t have fast disks, you’re going to have to accept it as a bottleneck. There’s not much you can do without throwing money at the problem.
7.9. Summary
In this chapter, you learned the following:
- Several types of contention exist above the topology level, so it’s helpful to be able to monitor things like CPU, I/O, and memory usage for the operating system your worker nodes are running on.
- It is important to have some level of familiarity with monitoring tools for the operating system of the machines/VMs in your cluster. In Linux, these include sar, netstat, and iotop.
- There’s value in knowing common JVM startup options, such as –Xms, -Xmx, and those related to GC logging.
- Although the Storm UI is a great tool for the initial diagnosis of many types of contention, it’s smart to have other types of monitoring at the machine/VM level to let you know if something is awry.
- Including custom metrics/monitoring in your individual topologies will give you valuable insights that the Storm UI may not be able to.
- Be careful when increasing the number of worker processes running on a worker node because you can introduce memory and/or CPU contention at the worker node level.
- Be careful when decreasing the number of worker processes running on a worker node because you can affect your topologies’ throughput while also introducing contention for worker processes across your cluster.