
Chapter 6. Tuning in Storm
This chapter covers
- Tuning a Storm topology
- Handling latency in a Storm topology
- Using Storm’s built-in metrics-collecting API
So far, we’ve given you as gentle an introduction to Storm concepts as we can. It’s time to kick things up a notch. In this chapter, we’ll discuss life as a developer after you’ve deployed your topology to a Storm cluster. You thought your job was over once the topology was deployed, didn’t you? Think again! Once you deploy your topology, you need to make sure it’s running as efficiently as possible. That’s why we’ve devoted two chapters to tuning and troubleshooting.
We’ll briefly revisit the Storm UI, because this will be the most important tool you’ll use to determine whether your topology is running efficiently. Then we’ll outline a repeatable process you can use in order to identify bottlenecks and resolve those bottlenecks. Our lesson on tuning doesn’t end there—we still need to discuss one of the greatest enemies of fast code: latency. We’ll conclude by covering Storm’s metrics-collecting API as well as introduce a few custom metrics of our own. After all, knowing exactly what your topology is doing is an important part of understanding how to make it faster.
Note
In this chapter, we have you check out source code from GitHub when running through the tuning examples. To check out this code, run the following command: git checkout [tag], replacing [tag] with a version of the code we specify. The GitHub repository is located at https://github.com/Storm-Applied/C6-Flash-sale-recommender.
Before we get into each of these topics, let’s set the stage with a use case that will serve as our example throughout the chapter: Daily Deals! reborn.
6.1. Problem definition: Daily Deals! reborn
Here’s the story. We work for an up-and-coming flash sale site. Every day, we put a number of items on sale for a short period of time and watch the traffic roll in. Over time, the number of sales per day has been growing and it’s become difficult for customers to find sales they’re interested in. Another team at our company has built an online “Find My Sale!” recommendation system. Find My Sale! narrows down the number of products customers might be interested in. It starts with some basic information the customer has given but also incorporates purchase history, browsing history, and so forth to try to get sales in which customers will most likely be interested in front of them. Our website interacts with this system via an HTTP API where we pass a customer identifier and get back a list of recommendation identifiers. We can then turn around and look up the details of those sales and display them to the customer on site.
It has been a great boon to the company and has helped fuel excellent growth. At the same time, we have an aging "Daily Deals!" email that has survived from the early days of the company about upcoming sales. In the beginning, its one sale per email was quite effective. Eventually it was changed to use a basic heuristic of getting a decent upcoming sale in our customers’ inboxes every day. Over time, the effectiveness of the email has declined. Early testing indicates that the problem is that the contents of the email simply aren’t relevant anymore. With many sales every day, the simple heuristic isn’t picking highly relevant sales to send; it picks only moderately relevant ones.
We’ve been tasked with a new initiative: crafting an email to replace Daily Deals! that will be sent to customers once a day with any sales coming the next day that Find My Sales! targets as being of interest to the customer. We want to use the Find My Sale! system to improve relevancy and hopefully the click-through rate and eventual sales on site. There’s a caveat or two, though. Find My Sale! is purely an online system where currently the recommending of sales is somewhat tangled up with its external HTTP interface. Before we consider rewriting it, we want to validate our idea that more relevant Daily Deals! emails are going to have a significant impact on business (some members of the team think the current emails are good enough and increased relevancy isn’t going to result in more than a small uptick in traffic).
6.1.1. Formation of a conceptual solution
We set about designing a solution that will handle the email creation. It consumes an incoming stream of customer information and makes a real-time call to Find My Sale! to find any upcoming flash sales that would be of interest. (We’ve had to modify Find My Sale! slightly—normally it only considers active sales, but we’ve changed it to take a date range of active times to consider.) We then look up information about those sales and finally store it for another process that performs the email sending. Figure 6.1 gives a general overview of this design.
Figure 6.1. The Find My Sale! topology: its components and data points

The design is fairly straightforward; it has four components that talk to two external services and one database. With this design in hand, let’s turn our focus to how it maps to Storm concepts.
6.1.2. Mapping the solution to Storm concepts
This design maps in Storm terms to a fairly simple topology to start. We have a spout that emits customer information, which in turn hands it off to the Find My Sale bolt, which interacts with the external service. Any found sales are emitted along with the customer information to a bolt that looks up information about the sale, which emits that information with the customer information to a persistence bolt that stores the information so another process can pick it up later for sending the email. Figure 6.2 illustrates the design mapped to these Storm concepts.
Figure 6.2. The Find My Sale! design mapped to Storm concepts

The mapping of our design to Storm concepts follows a pattern similar to the one found in chapters 2–4. We have a spout acting as the source of tuples, with three bolts performing transformations on these tuples. We’ll now show you a first-pass implementation of this design in code.
6.2. Initial implementation
Before we get into the implementation of the design, it’s important to keep in mind a couple of interfaces that will be referenced frequently in the following code:
- TopologyBuilder— Exposes the API for specifying a topology for Storm to execute
- OutputCollector— The core API for emitting and failing tuples
We’ll start with FlashSaleTopologyBuilder, which is responsible for connecting our spout and bolts (see the following listing). All work for building the topology is handled in this class, regardless of how we are going to run it: in local mode or deploying to a remote cluster.
Listing 6.1. FlashSaleTopologyBuilder.java
public class FlashSaleTopologyBuilder {
  public static final String CUSTOMER_RETRIEVAL_SPOUT = "customer-retrieval";
  public static final String FIND_RECOMMENDED_SALES = "find-recommended-sales";
  public static final String LOOKUP_SALES_DETAILS = "lookup-sales-details";
  public static final String SAVE_RECOMMENDED_SALES = "save-recommended-sales";

  public static StormTopology build() {
    TopologyBuilder builder = new TopologyBuilder();

    builder.setSpout(CUSTOMER_RETRIEVAL_SPOUT, new CustomerRetrievalSpout())
           .setMaxSpoutPending(250);

    builder.setBolt(FIND_RECOMMENDED_SALES, new FindRecommendedSales(), 1)
           .setNumTasks(1)
           .shuffleGrouping(CUSTOMER_RETRIEVAL_SPOUT);

    builder.setBolt(LOOKUP_SALES_DETAILS, new LookupSalesDetails(), 1)
           .setNumTasks(1)
           .shuffleGrouping(FIND_RECOMMENDED_SALES);

    builder.setBolt(SAVE_RECOMMENDED_SALES, new SaveRecommendedSales(), 1)
           .setNumTasks(1)
           .shuffleGrouping(LOOKUP_SALES_DETAILS);

    return builder.createTopology();
  }
}
Now that we’ve seen how to put all the components in our topology together via the FlashSaleTopologyBuilder, we’ll go into more detail for each individual component, starting with the spout.
6.2.1. Spout: read from a data source
Data will flow into our topology through the spout. This data comes in the form of a single customer ID, as shown in figure 6.3.
Figure 6.3. The spout emits a tuple for each customer ID that it receives.

But as in other topologies, we’re going to cheat in order to get up and running quickly. For now, we’ll have the spout generate data whenever its nextTuple() method is called rather than being hooked up to a real message queue, as shown in the following listing.
Listing 6.2. CustomerRetrievalSpout.nextTuple generating customer IDs
...

@Override
public void nextTuple() {
  new LatencySimulator(1, 25, 10, 40, 5).simulate(1000);

  int numberPart = idGenerator.nextInt(9999999) + 1;
  String customerId = "customer-" + Integer.toString(numberPart);

  outputCollector.emit(new Values(customerId));
}
...
If we released our topology into a real production environment, the customer retrieval spout would be hooked up to a messaging bus like Kafka or RabbitMQ. We’d keep the list of customers we needed to process on a queue, and should our topology completely crash or otherwise come to a halt, we could restart and continue on from where we left off. Our stream of data has a durable home that’s separate from the system that’ll process it.
In addition, if we decided we didn’t want to do this in a batch fashion, we’d have to convert it to a real-time system. With Storm and our design, we’re processing our data as a stream but kicking off the run as a batch. We’ve separated the “how” of stream processing as a stream from the “when” of our batch orientation. Any time we want to, we could take this system from its current form as a batch system to a real-time system without changing anything about our topology.
Before we get to the meat of this chapter, let’s step through each of our bolts and identify the important bits of logic.
6.2.2. Bolt: find recommended sales
The bolt that finds recommended sales accepts a customer ID in its input tuple and emits a tuple containing two values: the customer ID and a list of sales IDs. To retrieve the sales IDs, it makes a call to an external service. Figure 6.4 illustrates where we are in the topology.
Figure 6.4. The FindRecommendedSales bolt accepts a customer ID in its input tuple and emits a tuple containing a customer ID and a list of sales IDs.
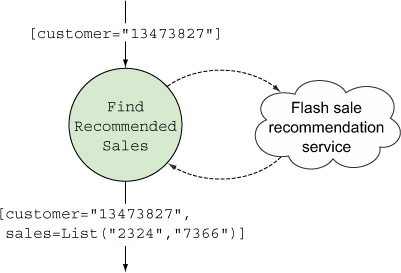
The implementation of this bolt is seen in the next listing.
Listing 6.3. FindRecommendedSales.java

All we’re getting back from our client.findSalesFor call is a list of sales identifiers. To send our email, we’ll need some additional information about the product and sale. This is where our next bolt comes into play.
6.2.3. Bolt: look up details for each sale
To send a meaningful email with details about each sale, we need to look up the details for each of the recommended sales. The bolt that does this accepts a tuple containing the customer ID and list of sales IDs, looks up the details for each sale by making a call to an external service, and emits a tuple containing the customer ID and a list of Sale objects containing the details for each sale (see figure 6.5).
Figure 6.5. The bolt for looking up sales details accepts a customer ID and list of sales IDs in its input tuple and emits a tuple containing a customer ID and list of Sale objects containing the details of each sale.

The following listing shows the implementation for the LookupSalesDetails bolt.
Listing 6.4. LookupSalesDetails.java


The one big difference between this bolt and the previous one is that this one can both succeed and fail at the same time. We could attempt to look up ten sales, get nine, and not get one. To handle this more complicated definition of success, we extend BaseRichBolt and manually ack tuples ourselves. As long as we can look up at least one of the sales from the sale IDs obtained from our input tuple, we’ll call it a success and move on. Our main priority is to get as many emails out on time as possible.
This leads us to our last bolt, where we’ll save the results to a database for sending via another process.
6.2.4. Bolt: save recommended sales
The bolt that saves the recommended sales accepts an input tuple containing a customer ID and a list of Sale objects with the details for each sale. It then persists that data to a database for later processing, emitting no tuples because this is the last bolt in our topology (see figure 6.6).
Figure 6.6. The save recommended sales bolt accepts an input tuple containing the customer ID and a list of Sale objects and persists that information to a database.
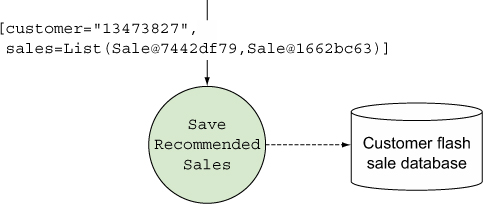
The next listing shows the implementation for SaveRecommendedSales.
Listing 6.5. SaveRecommendedSales.java

The same patterns we used in the previous two bolts are used here as well. There’s our logic. It all looks sound. Imagine we’ve done some testing of our topology and its working but it’s far from ready to be released into production. Is it going to be fast enough? It’s hard to tell. Let’s see how we would go about finding out.
6.3. Tuning: I wanna go fast
How does one go about tuning their topologies? It may seem like a daunting task at first, but Storm provides us with tools that can be used to quickly identify bottlenecks, allowing us to take steps to alleviate those bottlenecks. Using the Storm UI and metrics-collecting API, you have tools at your disposal to establish a repeatable process you can use for tuning your topologies.
6.3.1. The Storm UI: your go-to tool for tuning
An understanding of the Storm UI is essential because it’s the primary tool that will give us feedback on whether your tuning efforts are having any effect. Figure 6.7 gives a quick refresher on the Topology summary screen of the Storm UI.
Figure 6.7. Topology summary screen of the Storm UI

As you’ll recall, there are seven sections in the UI for a single topology:
- Topology summary— Shows the status, uptime, and the number of workers, executors and tasks assigned to the entire topology.
- Topology actions— Allows you to deactivate, rebalance, or kill your topology straight from the UI.
- Topology stats— Shows high-level statistics for the entire topology across four time windows; one of those windows is All Time.
- Spouts (All time)— Shows the statistics for your spout(s) across all time. This includes the number of executors and tasks; the number of tuples that have been emitted, acked, and failed by the spout(s); and the last error (if there has been one) associated with the spout(s).
- Bolts (All time)— Shows your statistics for your bolt(s) across all time. This includes the number of executors and tasks; the number of tuples that have been emitted, acked, and failed by the bolt(s); some metrics related to latency and how busy the bolt(s) are; and the last error (if there has been one) associated with the bolt(s).
- Visualization— Shows a visualization of the spouts, bolts, how they are connected, and the flow of tuples between all of the streams.
- Topology Configuration— Shows all the configuration options that have been set for your topology.
We’ll focus on the Bolts section of the UI for our tuning lesson. Before we get into figuring out what needs to be tuned and how, we need to define a set of baseline numbers for our topology.
Before you start analyzing whether your topology is a finely tuned machine, ask yourself what fast enough means to you. What velocity do you need to hit? Think of Twitter’s trending topics for a moment. If it took eight hours to process every tweet, those topics wouldn’t be anywhere near as trending as they are on the site. A SLA could be fairly flexible in regard to time “within an hour” but rigid according to data flow. Events can’t back up beyond a certain point; there’s a queue out there somewhere, holding onto all the data that’s going to be processed. After a certain high watermark is set, we need to be consuming data as fast as it’s going on, lest we hit a queue limit or, worse, cause an out-of-memory error.
For our use case, where we’re processing a stream in a batch-like fashion, our SLA is different. We need to have fully processed all our data in time for our email to go out. Fast enough has a couple of simple metrics: 1) Did it finish on time? 2) As we process more data each day, will it continue to finish on time?
Let’s make our SLA a little more real. It takes a while to process all these emails (say 60 minutes) before sending. And we want to start sending at 8 a.m. every morning. Deals for the coming day can be entered until 11 p.m. and we can’t start processing until after that. This gives us eight hours from the time we start to when we have to finish. Currently we have 20 million customers—which means that to barely hit our mark we need to process some 695 customers per second. That’s cutting it pretty close; we decide for our first pass we need to feel confident in finishing in seven hours. That’s 794 customers a second, and, given our growth, we want to rapidly ramp up to being done within three hours so we don’t have to worry about tuning for a while. To do that, we need to process 1,852 customers a second.
6.3.2. Establishing a baseline set of performance numbers
Time to dive into developing basic Storm tuning skills that can be used to take a topology and make it progressively faster. In our source code, you’ll find version 0.0.1 of the Find My Sale! topology. To check out that specific version, use this command:
git checkout 0.0.1
While we’re tuning, we need to pay attention to one primary class: FlashSaleTopology-Builder. This is where we build our topology and set the parallelism of each component. Let’s take a look at its build method again to refresh your memory:
public static StormTopology build() {
  TopologyBuilder builder = new TopologyBuilder();

  builder.setSpout(CUSTOMER_RETRIEVAL_SPOUT, new CustomerRetrievalSpout())
         .setMaxSpoutPending(250);

  builder.setBolt(FIND_RECOMMENDED_SALES, new FindRecommendedSales(), 1)
         .setNumTasks(1)
         .shuffleGrouping(CUSTOMER_RETRIEVAL_SPOUT);

  builder.setBolt(LOOKUP_SALES_DETAILS, new LookupSalesDetails(), 1)
         .setNumTasks(1)
         .shuffleGrouping(FIND_RECOMMENDED_SALES);

  builder.setBolt(SAVE_RECOMMENDED_SALES, new SaveRecommendedSales(), 1)
         .setNumTasks(1)
         .shuffleGrouping(LOOKUP_SALES_DETAILS);

  return builder.createTopology();
}
Note that we’re creating one executor (in the call to setBolt) and one task for each bolt (in setNumTasks). This will give us a basic baseline of how our topology is performing. Next we’ll take it, deploy it to a remote cluster, and then run it with some customer data for 10–15 minutes, collecting basic data from the Storm UI. Figure 6.8 shows what we have at this point, with the important parts highlighted and annotated.
Figure 6.8. Identifying the important parts of the Storm UI for our tuning lesson
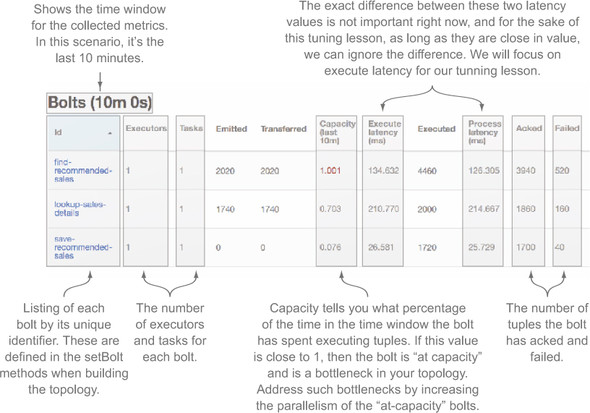
We now have a useful interface for displaying the metrics related to our topology along with a baseline set of performance numbers. The next step in the tuning process is to identify the bottlenecks in our topology and do something about them.
6.3.3. Identifying bottlenecks
What can we see from these metrics after our first run? Let’s zero in on capacity. For two of our bolts, it’s fairly high. The find-recommended-sales bolt is at 1.001 and the lookup-sales-details bolt is hovering around .7. The value of 1.001 indicates a bottleneck for find-recommended-sales. We’re going to need to increase its parallelism. Given that lookup-sales-details is at .7, it’s highly likely that opening up find-recommended-sales without also opening up lookup-sales-details will just turn it into a new bottleneck. Our intuition says they should be tuned in tandem. save-recommended-sales, on the other hand, is really low at 0.07 and probably won’t be a bottleneck for quite some time.
Next, we’ll guess how high we might want to take our parallelism, set our number of tasks to that, and release again. We’ll show you the stats from that run as well so you can see that changing the number of tasks without changing the number of executors makes no difference.
You can check out version 0.0.2 of the code by executing this command:
git checkout 0.0.2
The only important change is in FlashSaleTopologyBuilder:
public static StormTopology build() {
  TopologyBuilder builder = new TopologyBuilder();

  builder.setSpout(CUSTOMER_RETRIEVAL_SPOUT, new CustomerRetrievalSpout())
         .setMaxSpoutPending(250);

  builder.setBolt(FIND_RECOMMENDED_SALES, new FindRecommendedSales(), 1)
         .setNumTasks(32)
         .shuffleGrouping(CUSTOMER_RETRIEVAL_SPOUT);

  builder.setBolt(LOOKUP_SALES_DETAILS, new LookupSalesDetails(), 1)
         .setNumTasks(32)
         .shuffleGrouping(FIND_RECOMMENDED_SALES);

  builder.setBolt(SAVE_RECOMMENDED_SALES, new SaveRecommendedSales(), 1)
         .setNumTasks(8)
         .shuffleGrouping(LOOKUP_SALES_DETAILS);

  return builder.createTopology();
}
Why 32, 32, and 8 for bolt tasks? We probably won’t need more than 16, 16, and 4 when we’re done, but it’s smart to go with double that as a first pass. With this change in place, we don’t need to release the topology multiple times. We can release just version 0.0.2 and use the rebalance command on our Nimbus node to adjust the parallelism of our running topology.
After release, we let it run for about 10–15 minutes. As you can see, the only meaningful change in the UI is the number of tasks per bolt.
What do we do next? Let’s start by quadrupling the parallelism for both the find-recommended-sales and lookup-sales-details bolts by running the rebalance command.
Note
The rebalance command used throughout this chapter takes the form storm rebalance topology-name –e [bolt-name]=[number-of-executors]. This command will redistribute executors for the given bolt, allowing us to increase the parallelism for the given bolt on the fly. All rebalance commands assume we’re running on our Nimbus node and that we have the Storm command in our PATH.
We’ll run one rebalance, wait for the change to appear in the UI, and then run the second rebalance command:
storm rebalance flash-sale -e find-recommended-sales=4
storm rebalance flash-sale -e lookup-sales-details=4
Okay, our rebalance is done. It’s 10 minutes later—let’s see what we got (figure 6.9).
Figure 6.9. Storm UI shows a minimal change in capacity after a first attempt at increasing parallelism for our first two bolts.
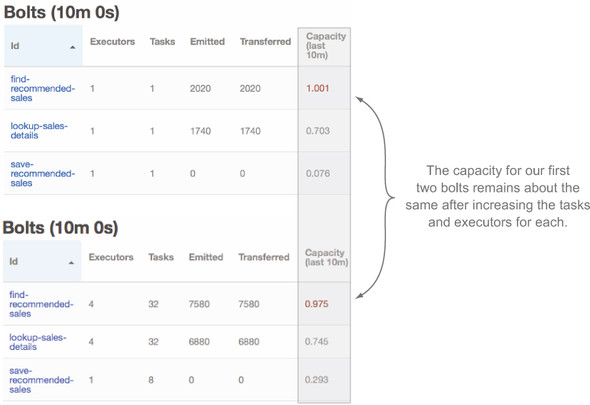
Here’s something that might surprise you. We increased the parallelism of our find-recommended-sales bolt but there’s no change in capacity. It’s just as busy as it was before. How can that be possible? The flow of tuples coming in from the spout was unaffected; our bolt was/is a bottleneck. If we were using a real queue, messages would’ve backed up on that queue as a result. Note the capacity metrics of the save-recommended-sales bolt has gone up to about 0.3 as well. That’s still fairly low, so we don’t have to worry about that becoming a bottleneck yet.
Let’s try that again, this time doubling the parallelism of both bolts. That has to make a dent in that queue:
storm rebalance flash-sale -e find-recommended-sales=8
storm rebalance flash-sale -e lookup-sales-details=8
Let’s pretend the rebalances are done and we’ve waited 10 minutes (figure 6.10).
Figure 6.10. Storm UI showing minimal change in capacity after doubling the number of executors for our first two bolts

The capacity is unchanged for both find-recommended-sales and lookup-sales-details. That queue behind our spout must be really backed up. save-recommended-sales capacity has just about doubled, though. If we ratchet up the parallelism on our first two bolts, that might become a bottleneck for us, so let’s bring it up some as well. Again, double the parallelism for our first two bolts and then quadruple the parallelism used for the save-recommended-sales bolt:
storm rebalance flash-sale -e find-recommended-sales=16
storm rebalance flash-sale -e lookup-sales-details=16
storm rebalance flash-sale -e save-recommended-sales=4
Three rebalancing commands and 10 minutes later we have figure 6.11.
Figure 6.11. Storm UI showing improved capacity for all three bolts in our topology

Excellent! We’ve finally made a dent, and a decent one in terms of capacity. The number of spouts (one) might now be our limiting factor. In a topology where we’re hooked up to a real message queue, we’d check to make sure the flow of messages met whatever our SLA was. In our use case, we don’t care about messages backing up but we’re concerned with time to get through all messages. If our job from start to finish would take too long, we could increase the parallelism of our spout and go through the tuning steps we just showed you. Faking out spout parallelism is beyond the realm of our little test topology, but feel free to go about trying to emulate it. It might be a rewarding exercise.
So far, we haven’t touched the parallelism of workers at all. Everything is running on a single worker and with a single spout, and we don’t need more than one worker. Our advice is to scale on a single worker with executors until you find increasing executors doesn’t work anymore. The basic principle we just used for scaling our bolts can be applied to spouts and workers.
6.3.4. Spouts: controlling the rate data flows into a topology
If we still aren’t meeting our SLAs at this point in tuning, it’s time to start looking at how we can control the rate that data flows into our topology: controls on spout parallelism. Two factors come into play:
- The number of spouts
- The maximum number of tuples each spout will allow to be live in our topology
Note
Before we get started, remember in chapter 4 when we discussed guaranteed message processing and how Storm uses tuple trees for tracking whether or not a tuple emitted from a spout is fully processed? Here when we mention a tuple being unacked/live, we’re referring to a tuple tree that hasn’t been marked as fully processed.
These two factors, the number of spouts and maximum number of live tuples, are intertwined. We’ll start with the discussion of the second point because it’s more nuanced. Storm spouts have a concept called max spout pending. Max spout pending allows you to set a maximum number of tuples that can be unacked at any given time. In the FlashSaleTopologyBuilder code, we’re setting a max spout pending value of 250:
builder
  .setSpout(CUSTOMER_RETRIEVAL_SPOUT, new CustomerRetrievalSpout())
  .setMaxSpoutPending(250);
By setting that value to 250, we ensure that, per spout task, 250 tuples can be unacked at a given time. If we had two instances of the spout, each with two tasks, that would be:
2 spouts x 2 tasks x 250 max spout pending = 1000 unacked tuples possible
When setting parallelism in your topology, it’s important to make sure that max spout pending isn’t a bottleneck. If the number of possible unacked tuples is lower than the total parallelism you’ve set for your topology, then it could be a bottleneck. In this case, we have the following
- 16 find-recommended-sales bolts
- 16 lookup-sales-details bolts
- 4 saved-recommended-sales bolts
which yields 36 tuples at a time we can process.
In this example, with a single spout, our maximum possible unacked tuples, 250, is greater than the maximum number of tuples we can process based on our parallelization, 36, so we can feel safe saying that max spout pending isn’t causing a bottleneck (figure 6.12).
Figure 6.12. Because max spout pending is greater than the total number of tuples we can process at one time, it’s not a bottleneck.
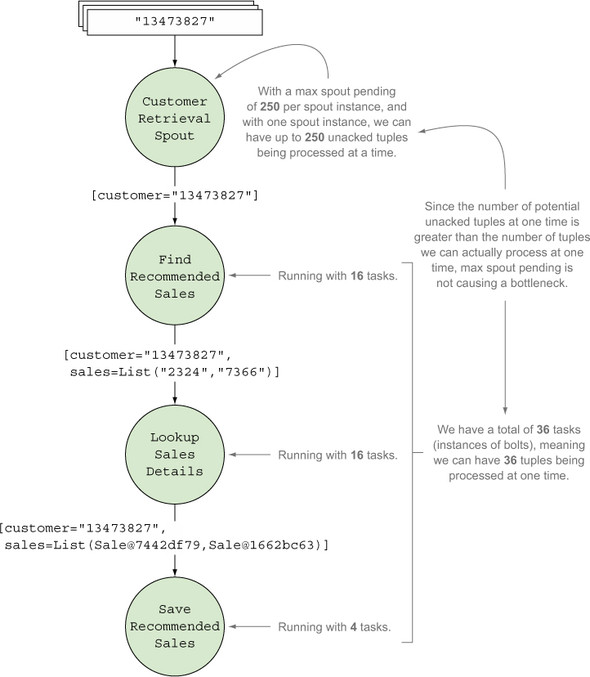
If max spout pending can cause bottlenecks, why would you set it at all? Without it, tuples will continue to flow into your topology whether or not you can keep up with processing them. Max spout pending allows us to control our ingest rate. Without controlling our ingest rate, it’s possible to swamp our topology so that it collapses under the weight of incoming data. Max spout pending lets us erect a dam in front of our topology, apply back pressure, and avoid being overwhelmed. We recommend that, despite the optional nature of max spout pending, you always set it.
When attempting to increase performance to meet an SLA, we’d increase the rate of data ingest by either increasing spout parallelism or increasing the max spout pending. If we made a fourfold increase in the maximum number of active tuples allowed, we’d expect to see the speed of messages leaving our queue increase (maybe not by a factor of four, but it’d certainly increase). If that caused the capacity metric for any of our bolts to return to one or near it, we’d tune the bolts again and repeat with the spout and bolt until we hit our SLA. If adjusting spout and bolt parallelism failed to provide additional benefits, we’d play with the number of workers to see if we were now bound by the JVM we were running on and needed to parallelize across JVMs. This basic method can be applied over and over, and in many cases, we can meet our SLAs based on this.
Keep the following points in mind if you’re working with external services from a topology you’re tuning:
- It’s easy when interacting with external services (such as a SOA service, database, or filesystem) to ratchet up the parallelism to a high enough level in a topology that limits in that external service keep your capacity from going higher. Before you start tuning parallelism in a topology that interacts with the outside world, be positive you have good metrics on that service. We could keep turning up the parallelism on our find-recommended-sales bolt to the point that it brings the Find My Sales! service to its knees, crippling it under a mass of traffic that it’s not designed to handle.
- The second point is about latency. This is a bit more nuanced and requires a longer explanation and some background information, so before we get to that, let’s take our parallelism changes and check them in.
You can check out the version of the code we have at this point in our tuning example by executing this command:
git checkout 0.0.3
6.4. Latency: when external systems take their time
Let’s talk about one of the greatest enemies of fast code: latency. Latency is generally defined as the period of time one part of your system spends waiting on a response from another part of your system. There’s latency accessing memory on your computer, accessing the hard drive, and accessing another system over the network. Different interactions have different levels of latency, and understanding the latency in your system is one of the keys to tuning your topology.
6.4.1. Simulating latency in your topology
If you look at the code for this topology, you’ll find something that looks like this inside code from Database.java:
private final LatencySimulator latency = new LatencySimulator(
  20, 10, 30, 1500, 1);

public void save(String customerId, List<Sale> sale, int timeoutInMillis) {
  latency.simulate(timeoutInMillis);
}
Don’t worry if you haven’t gone through the code. We’ll cover all the important parts here. The LatencySimulator is our way of making this topology behave something like a real one would when interacting with external services. Anything you interact with exhibits latency, from main memory on your computer to that networked filesystem you have to read from. Different systems will display different latency characteristics that our LatencySimulator attempts to emulate in a simple fashion.
Let’s break down its five constructor arguments (see figure 6.13).
Figure 6.13. LatencySimulator constructor arguments explained
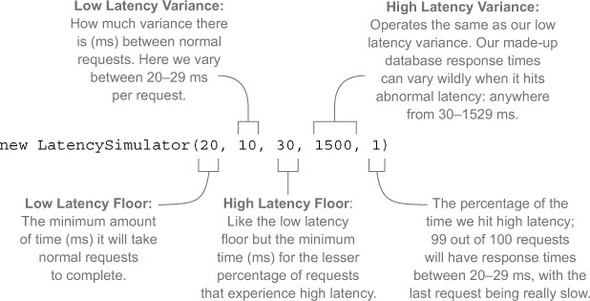
Note that we’re not expressing latency in terms of a basic average that we vary from. That’s rarely how latency works. You’ll usually get fairly consistent response times and all of the sudden those response times will vary wildly because of any number of factors:
- The external service is having a garbage collection event.
- A network switch somewhere is momentarily overloaded.
- Your coworker wrote a runaway query that’s currently hogging most of the database’s CPU.
Note
At our day job, almost all our systems run on the JVM and we use Coda Hale’s excellent Metrics library[1] as well as Netflix’s great Hystrix library[2] to measure the latency of our systems and adjust accordingly.
Table 6.1 shows the latency of the various systems our topology is interacting with. Looking at the table, we can see there’s a lot of variance from the best request to the worst in each of these services. But what really stands out is how often we get hit by latency. On occasion, the database takes longer than any other service, but it rarely happens when compared to the FlashSaleRecommendationService, which hits a high latency period an order of magnitude more. Perhaps there’s something we can address there.
Table 6.1. Latency of external services
|
System |
Low floor |
Low variance |
High floor |
High variance |
High % |
|---|---|---|---|---|---|
| FlashSaleRecommendationService | 100 | 50 | 150 | 1000 | 10 |
| FlashSaleService | 50 | 50 | 100 | 200 | 5 |
| Database | 20 | 10 | 30 | 1500 | 1 |
When you look in the FindRecommendedSales bolt, you’ll see this:
private final static int TIMEOUT = 200;

...

@Override
public void prepare(Map config, TopologyContext context) {
  client = new FlashSaleRecommendationClient(TIMEOUT);
}
We’ve set a timeout of 200 ms for looking up recommendations per client. It’s a nice number, 200, but how did we settle on that? It probably seemed right when we were trying to get the topology working. In figure 6.14, look at the Last Error column. You’ll see that all our bolts are experiencing timeouts. That makes sense. We wait only 200 ms to get recommendations, yet according to table 6.1, one out of ten requests hits a higher-than-normal latency that could take anywhere from 150 to 1049 ms to return a result and nine out of ten requests will return less than 150 ms. There are two primary types of reasons this could happen: extrinsic and intrinsic.
Figure 6.14. Storm UI showing the last error for each of our bolts

6.4.2. Extrinsic and intrinsic reasons for latency
An extrinsic reason is one that has little to nothing to do with the data. We hit high latency because of network issues or a garbage collection event or something that should pass with time. The next time we retry that request, our situation might be different.
An intrinsic reason is related to something about the data that’s likely to cause the delay. In our example, it may take longer to come up with recommended sales for certain customers. No matter how many times we fail the tuple in this bolt and try again, we won’t get recommended sales for those customers. It’s just going to take too long. Intrinsic reasons can combine with extrinsic ones; they aren’t mutually exclusive.
That’s all well and good, but what does it have to do with our topology? Well, as we are interacting with external services, we can account for latency and attempt to increase our throughput without increasing our parallelism. Let’s be smarter about our latency.
All right, we’re making recommendations here, so we’re declaring that after investigation, we’ve discovered that our variance with the FlashSaleRecommendationService is based on the customer. Certain customers are going to be slower to look up:
- We can generate recommendations for 75% of them in less than 125 ms.
- For another 15%, it takes about 125–150 ms.
- The last 10% usually take at least 200 ms, sometimes as long as 1500 ms.
Those are intrinsic variances in latency. Sometimes one of those “fast” lookups might end up taking longer due to an extrinsic event. One strategy that has worked well for us with services that exhibit this problem is to perform initial lookup attempts with a hard ceiling on timeouts. In this example, we could use 150 ms, and, if that fails, send it to a less parallelized instance of the same bolt that will take longer with its timeout. The end result is that our time to process a large number of messages goes down—we’re effectively declaring war on extrinsic latency. If 90% of requests take longer than 150 ms, it’s probably either because
- It’s a customer with intrinsic issues.
- Extrinsic issues such as stop-the-world garbage collection are having an effect.
Your mileage will vary with this strategy, so test before you use it. Caveats aside, let’s look at one way you can pull this off. Check out version 0.0.4 of our code
git checkout 0.0.4
and see the following listing for the changes in FindRecommendedSales and FlashSaleTopologyBuilder.
Listing 6.6. FindRecommendedSales.java with retry logic

Check out what’s going on in FlashSaleTopologyBuilder:
builder
  .setSpout(CUSTOMER_RETRIEVAL_SPOUT, new CustomerRetrievalSpout())
  .setMaxSpoutPending(250);

builder
  .setBolt(FIND_RECOMMENDED_SALES_FAST, new FindRecommendedSales(), 16)
  .addConfiguration("timeout", 150)
  .setNumTasks(16)
  .shuffleGrouping(CUSTOMER_RETRIEVAL_SPOUT);

builder
  .setBolt(FIND_RECOMMENDED_SALES_SLOW, new FindRecommendedSales(), 16)
  .addConfiguration("timeout", 1500)
  .setNumTasks(16)
  .shuffleGrouping(FIND_RECOMMENDED_SALES_FAST,
                   FindRecommendedSales.RETRY_STREAM)
  .shuffleGrouping(FIND_RECOMMENDED_SALES_SLOW,
                   FindRecommendedSales.RETRY_STREAM);

builder
  .setBolt(LOOKUP_SALES_DETAILS, new LookupSalesDetails(), 16)
  .setNumTasks(16)
  .shuffleGrouping(FIND_RECOMMENDED_SALES_FAST,
                   FindRecommendedSales.SUCCESS_STREAM)
  .shuffleGrouping(FIND_RECOMMENDED_SALES_SLOW,
                   FindRecommendedSales.SUCCESS_STREAM);

builder
  .setBolt(SAVE_RECOMMENDED_SALES, new SaveRecommendedSales(), 4)
  .setNumTasks(4)
  .shuffleGrouping(LOOKUP_SALES_DETAILS);
Where we previously had a single FindRecommendedSales bolt, we now have two: one for “fast” lookups and the other for “slow.” Let’s take a closer look at the fast one:
builder
  .setBolt(FIND_RECOMMENDED_SALES_FAST, new FindRecommendedSales(), 16)
  .addConfiguration("timeout", 150)
  .setNumTasks(16)
  .shuffleGrouping(CUSTOMER_RETRIEVAL_SPOUT);
It’s identical to our previous FindRecommendedSales bolt except that it has one addition:
.addConfiguration("timeout", 150)
This is the timeout value (in ms) that we’re using in the bolt’s prepare() method to initialize the FindRecommendationSalesClient’s timeout value. Every tuple through the fast bolt will time out after 150 ms and be emitted on the retry stream. Here’s the “slow” version of the FindRecommendedSales bolt:
builder
  .setBolt(FIND_RECOMMENDED_SALES_SLOW, new FindRecommendedSales(), 16)
      .addConfiguration("timeout", 1500)
      .setNumTasks(16)
      .shuffleGrouping(FIND_RECOMMENDED_SALES_FAST,
                       FindRecommendedSales.RETRY_STREAM)
      .shuffleGrouping(FIND_RECOMMENDED_SALES_SLOW,
                       FindRecommendedSales.RETRY_STREAM);
Note that it has a timeout of 1500 ms:
.addConfiguration("timeout", 1500)
That’s the maximum we decided we should ever need to wait based on reasons that are intrinsic to that customer.
What’s going on with those two shuffle groupings?
.shuffleGrouping(FIND_RECOMMENDED_SALES_FAST,
                 FindRecommendedSales.RETRY_STREAM)
.shuffleGrouping(FIND_RECOMMENDED_SALES_SLOW,
                 FindRecommendedSales.RETRY_STREAM);
We’ve hooked up the slow FindRecommendedSales bolt to two different streams: the retry streams from both the fast and slow versions of the FindRecommendedSales bolts. Whenever a timeout occurs in any version of the bolt, it’ll be emitted on the retry stream and retried at a slower speed.
We have to make one more big change to our topology to incorporate this. Our next bolt, the LookupSalesDetails, has to get tuples from the success stream of both FindRecommendedSales bolts, slow and fast:
builder.setBolt(LOOKUP_SALES_DETAILS, new LookupSalesDetails(), 16)
       .setNumTasks(16)
       .shuffleGrouping(FIND_RECOMMENDED_SALES_FAST,
                        FindRecommendedSales.SUCCESS_STREAM)
       .shuffleGrouping(FIND_RECOMMENDED_SALES_SLOW,
                        FindRecommendedSales.SUCCESS_STREAM);
We could also consider applying this pattern to other bolts further downstream. It’s important to weigh the additional complexity this creates against possible performance increases. As always, it’s all about trade-offs.
Let’s go back to a previous decision. Remember the code in LookupSalesDetails that can result in some sales details not being looked up?
@Override
public void execute(Tuple tuple) {
  String customerId = tuple.getStringByField("customer");
  List<String> saleIds = (List<String>) tuple.getValueByField("sales");
  List<Sale> sales = new ArrayList<Sale>();
  for (String saleId: saleIds) {
    try {
      Sale sale = client.lookupSale(saleId);
      sales.add(sale);
    } catch (Timeout e) {
      outputCollector.reportError(e);
    }
  }

  if (sales.isEmpty()) {
    outputCollector.fail(tuple);
  } else {
    outputCollector.emit(new Values(customerId, sales));
    outputCollector.ack(tuple);
  }
}
We made a trade-off to get speed. We’re willing to accept the occasional loss of fidelity in the number of recommended sales to each customer versus emailing them to make sure we hit our SLA. But what kind of impact is this decision having? How many sales aren’t being sent to customers? Currently, we have no insight. Thankfully, Storm ships with some built-in metrics capabilities we can leverage.
6.5. Storm’s metrics-collecting API
Prior to the Storm 0.9.x series of releases, metrics were the Wild West. You had topology-level metrics available in the UI, but if you wanted business-level or JVM-level metrics, you needed to roll your own. The Metrics API that now ships with Storm is an excellent way to get access to metrics that can be used to solve our current quandary: understanding how much fidelity we’re losing in our LookupSalesDetails bolt.
6.5.1. Using Storm’s built-in CountMetric
To follow along in the source code, run the following command:
git checkout 0.0.5
The next listing shows the changes we’ve made to our LookupSalesDetail bolt.
Listing 6.7. LookupSalesDetails.java with metrics


We’ve created and registered two CountMetric instances in our prepare() method: one to keep a running count of the number of sales for which we’ve successfully looked up details and the other for tracking the number of failures.
6.5.2. Setting up a metrics consumer
Now we have some basic raw data that we’re going to record, but to get at it, we must set up a consumer. A metrics consumer implements the interface IMetricsConsumer, which acts as a bridge between Storm and an external system such as Statsd or Riemann. In this example, we’ll use the provided LoggingMetricsConsumer. When a topology is run in local mode, LoggingMetricsConsumer ends up being directed to standard output (stdout) along with other log output. We can set this up by adding the following to our LocalTopologyRunner:
Config config = new Config();
config.setDebug(true);
config.registerMetricsConsumer(LoggingMetricsConsumer.class, 1);
Let’s say we succeeded in looking up 350 sales over the time window:
244565 [Thread-16-__metricsbacktype.storm.metric.LoggingMetricsConsumer]
INFO  backtype.storm.metric.LoggingMetricsConsumer - 1393581398
localhost:1     22:lookup-sales-details     sales-looked-up     350
On a remote cluster, the LoggingMetricsConsumer writes info-level messages to a file called metrics.log in the Storm logs directory. We’ve also enabled metrics logging for when we deploy to a cluster with the following addition:
public class RemoteTopologyRunner {
  ...
  private static Config createConfig(Boolean debug) {
    ...

    Config config = new Config();
    ...
    config.registerMetricsConsumer(LoggingMetricsConsumer.class, 1);
    ...
  }
}
Storm’s built-in metrics are useful. But what if you need more than what’s built-in? Fortunately, Storm provides the ability to implement custom metrics so you can create metrics tailored to a specific need.
6.5.3. Creating a custom SuccessRateMetric
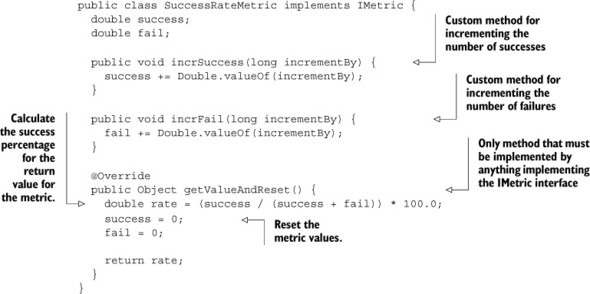
We have the raw metrics, but we want to aggregate them and then do the math ourselves to determine the success rate. We care less about the raw successes and failures and more about just the success rate. Storm has no built-in metric that we can use to get that, but it’s easy to create a class that will record that for us. The following listing introduces the SuccessRateMetric.
Listing 6.8. SuccessRateMetric.java
Changing the code to use this new custom metric is simple (see the next listing).
Listing 6.9. LookupSalesDetails.java using our new custom metric


Everything is pretty much as it was. We register a metric (just of a different type) and report our successes and failures to it. The logged output is much closer to what we want to know:
124117 [Thread-16-__metricsbacktype.storm.metric.LoggingMetricsConsumer]
INFO  backtype.storm.metric.LoggingMetricsConsumer - 1393581964
localhost:1     32:lookup-sales-details     sales-lookup-success-rate
98.13084112149532
You can try it out yourself:
git checkout 0.0.5
mvn clean verify -P local-cluster
Beware! It’s a lot of output.
6.5.4. Creating a custom MultiSuccessRateMetric
At this point, we’ve moved to production and the business folks are happy for a couple days—until they want to know the distribution of fidelity across customers. In other words, we need to record success and failure on a per-customer basis.
Luckily, there’s a Storm metric called MultiCountMetric that does exactly that—except it uses CountMetrics, not SuccessRateMetrics. But that’s easy enough to deal with—we’ll just create a new metric of our own from it:
git checkout 0.0.6
The following listing shows the new metric: MultiSuccessRateMetric.
Listing 6.10. MultiSuccessRateMetric.java

The class is straightforward; we store individual SuccessRateMetrics in a hash. We’ll use customer IDs as a key and be able to keep track of successes and failures per customer. As you can see in the next listing, the changes we need to do this are minor.
Listing 6.11. LookupSalesDetails.java with the new MultiSuccessRateMetric


Now we’re recording metrics in a fashion useful to the business folks:
79482 [Thread-16-__metricsbacktype.storm.metric.LoggingMetricsConsumer]
INFO  backtype.storm.metric.LoggingMetricsConsumer - 1393582952
localhost:4     24:lookup-sales-details     sales-lookup-success-rate
{customer-7083607=100.0, customer-7461335=80.0, customer-2744429=100.0,
customer-3681336=66.66666666666666, customer-8012734=100.0,
customer-7060775=100.0, customer-2247874=100.0, customer-3659041=100.0,
customer-1092131=100.0, customer-6121500=100.0, customer-1886068=100.0,
customer-3629821=100.0, customer-8620951=100.0, customer-8381332=100.0,
customer-8189083=80.0, customer-3720160=100.0, customer-845974=100.0,
customer-4922670=100.0, customer-8395305=100.0,
customer-2611914=66.66666666666666, customer-7983628=100.0,
customer-2312606=100.0, customer-8967727=100.0,
customer-552426=100.0, customer-9784547=100.0, customer-2002923=100.0,
customer-6724584=100.0, customer-7444284=80.0, customer-5385092=100.0,
customer-1654684=100.0, customer-5855112=50.0, customer-1299479=100.0}
The log message provides a sample of what we may see with the new metric: a list of customer IDs, each with an associated success rate. Here’s a lucky customer in that list with a 100% success rate:
customer-2247874=100.0
With this data, we have a much deeper insight into how many customers are receiving their full set of potential flash sales.
6.6. Summary
In this chapter, you learned that
- All basic timing information for a topology can be found in the Storm UI.
- Establishing a baseline set of performance numbers for your topology is the essential first step in the tuning process.
- Bottlenecks are indicated by a high capacity for a spout/bolt and can be addressed by increasing parallelism.
- Increasing parallelism is best done in small increments so that you can gain a better understanding of the effects of each increase.
- Latency that is both related to the data (intrinsic) and not related to the data (extrinsic) can reduce your topology’s throughput and may need to be addressed.
- Metrics (both built-in and custom) are essential if you want to have a true understanding of how your topology is operating.