
Research tools for understanding sports consumers
After completing this chapter, you should be able to:
• Discuss the importance of marketing research to sports marketers.
• Explain the fundamental process for conducting sports marketing research.
• Identify the various research design types.
• Describe the process for questionnaire development.
• Understand how to prepare an effective research report.
As the following RailCats, Scarborough Sports Marketing, Sponsorship Research and Strategy (SRS), IEG, Taylor (NASCAR), ESPN, and sponsorship ROI studies illustrate, marketing research is a fundamental tool for understanding and ultimately satisfying customers’ needs. As described in Chapter 1, one way of demonstrating a marketing orientation is to gather information used for decision making. Another way of establishing a marketing orientation is to disseminate information and share the marketing information with those responsible for making decisions. Marketing research is viewed as an essential element in marketing-oriented organizations.
The information gathered through marketing research can be as basic as where consumers live, how much money they make, and how old they are. Research also provides information for decision makers in identifying marketing opportunities and threats, segmenting markets, choosing and understanding the characteristics of target markets, evaluating the current market positioning, and making marketing mix decisions.
More specifically, marketing research may provide answers to questions such as the following:
![]() What new products or services would be of interest to consumers of sport?
What new products or services would be of interest to consumers of sport?
![]() What do present and potential consumers think about our new ad campaign?
What do present and potential consumers think about our new ad campaign?
![]() How does the advertising and promotion mix affect purchase decisions?
How does the advertising and promotion mix affect purchase decisions?
![]() What are the latest changes or trends in the sport marketplace?
What are the latest changes or trends in the sport marketplace?
![]() How are consumers receiving sports information and programming?
How are consumers receiving sports information and programming?
![]() What are sports fans spending, and what are they buying?
What are sports fans spending, and what are they buying?
![]() Who are the biggest sponsors of professional sports leagues or college sports?
Who are the biggest sponsors of professional sports leagues or college sports?
![]() How interested are fans in my team, my players, and in the sport itself?
How interested are fans in my team, my players, and in the sport itself?
![]() How do consumers perceive my team, league, or event relative to competitors?
How do consumers perceive my team, league, or event relative to competitors?
![]() What is the best way to promote my sports product or service?
What is the best way to promote my sports product or service?
![]() Who participates in sports, and in what sports are they participating? Also, where are they participating, and how often?
Who participates in sports, and in what sports are they participating? Also, where are they participating, and how often?
![]() Are current consumers satisfied with my sports products and services? What are the major determinants of customer satisfaction?
Are current consumers satisfied with my sports products and services? What are the major determinants of customer satisfaction?
![]() What price are consumers willing to pay for my sports product or service?
What price are consumers willing to pay for my sports product or service?
![]() What image does the team, player, or event hold with current consumers and potential consumers?
What image does the team, player, or event hold with current consumers and potential consumers?
MARKETING RESEARCH IN ACTION: THE GARY SOUTHSHORE RAILCATS
Since their inception the Gary Southshore RailCats have utilized market research to enhance the strategic planning and business success of the organization. The Southshore RailCats, currently a member of the modern American Association of Independent Professional Baseball, conducted a detailed study prior to their first official game to gather information that would guide the planning phase of their strategic marketing process. At the time, under the ownership of Victory Sports Group LLC., CEO Mike Tatoian and with the assistance of former General Manager Roger Wexelberg, the Southshore RailCats were able to successfully combine the power of sports and grass roots marketing to provide an exciting and memorable experience while adding to the quality of life in Northwest Indiana. The RailCats’ mission is to provide Northwest Indiana with an exceptional level of fun, affordable family entertainment in a safe and enjoyable atmosphere. To ensure that fans received this opportunity the organization sought to identify and determine if marketing services and investment opportunities were of an investment scale to which a capable private operator under a contractual agreement set-forth can achieve economic success. The goal of the RailCats organization was to offer marketing/sponsorship of such services and facilities at a reasonable cost to the consumer public, therefore validating rights fee expenditures. A self-administered survey of area consumers (N=1034) served as the primary data collection instrument to examine the identified research objectives. The survey was segmented into seven categories: interest levels, awareness, attendance/purchase characteristics, media/entertainment choices, level of importance, fan characteristics, and demographics. The intention of the research was to assist the Southshore RailCats to make informed decisions consistent with common organizational goals. In addition, the study was designed to look at how survey responses differed according to fan demographics. For instance, are males more likely than females to attend a RailCats game in the future?
Some of the contents of the survey included information specific to:
![]() I am planning to attend a RailCats game this coming season.
I am planning to attend a RailCats game this coming season.
![]() I am more likely to a attend a game on a weekend than weekday
I am more likely to a attend a game on a weekend than weekday
![]() I prefer to attend games that have promotional give-aways
I prefer to attend games that have promotional give-aways
![]() The quality of play will influence my attendance to a RailCats game
The quality of play will influence my attendance to a RailCats game
![]() The RailCats organization is actively involved in the community
The RailCats organization is actively involved in the community
![]() Which of the following best describes with whom you may attend a RailCats game?
Which of the following best describes with whom you may attend a RailCats game?
![]() If available, would you purchase a mini season ticket plan for the upcoming XXXX season?
If available, would you purchase a mini season ticket plan for the upcoming XXXX season?
![]() Please identify the number of games you would prefer to purchase.
Please identify the number of games you would prefer to purchase.
![]() Please rank from most likely to least likely the following items that may influence your attendance to a RailCats game (day of game, fireworks, opponent, premium giveaways, theme nights)
Please rank from most likely to least likely the following items that may influence your attendance to a RailCats game (day of game, fireworks, opponent, premium giveaways, theme nights)
![]() Please rank preference of media sources for information of local sports teams
Please rank preference of media sources for information of local sports teams
![]() What is your zip code?
What is your zip code?
![]() What is your gender?
What is your gender?
![]() What year were you born?
What year were you born?
Source: Center for Sport Recreation and Tourism Development, KSU / Gary Southshore RailCats Feasibility Study.
These are just a few of the questions that may be addressed through marketing research. As the following press release highlighting research conducted by Scarborough Sports Marketing (2012) illustrates, sport and entertainment organizations utilize a variety of research techniques to assess consumer behaviors. The following narrative of market research conducted by Scarborough Research illustrates the varying demographics of Major League Baseball.
HITTING A HOME RUN WITH THE DIGITAL GENERATION
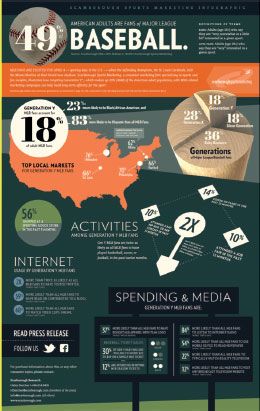
NEW YORK (April 3, 2012) – The Major League Baseball (MLB) season has already opened in Japan with Seattle and Oakland, and fans (view infographic) are excited for MLB opening day here in the States on April 4, when the defending champions, the St. Louis Cardinals, visit the Miami Marlins at their brand new stadium. Scarborough Sports Marketing, a consumer marketing firm specializing in sports and fan insights, defines “Fans” as American adults who say they are “very, somewhat or a little bit” interested in a given sport. “Avid Fans” are American adults who say they are “very” interested in a given sport.
According to the new Scarborough Sports Marketing study, nearly half (49%, 115M) of all American adults are MLB Fans and 15% (36M) are Avid Fans. The study also reveals that there is ample opportunity to turn young fans into lifelong MLB enthusiasts as 44% of Generation Y* is MLB Fans and 13% is Avid Fans.
“Generation Y makes up 20% of the American adult population – that’s 46 million people,” says Bill Nielsen, Vice President of Sales for Scarborough Sports Marketing. “Major League Baseball, MLB teams and advertisers understand how critical it is to continue to reach out to this younger demographic in an effective and efficient way, to build long-term affinity for the sport.”
Almost a third (30 percent) of Gen Y MLB Fans are willing to spend $25–49 on a single game MLB ticket and 12% are interested in purchasing season tickets. Gen Y MLB Fans are also 37% more likely than all MLB Fans to have bought MLB apparel with a team logo in the past 12 months. Retail spaces also offer an opportunity for fan outreach as more than half (56%) of Gen Y MLB Fans shopped at a sporting goods store in the past three months.
Where can Gen Y MLB Fans be reached? They are 54% more likely than all MLB Fans to have used a mobile device to read a newspaper in the past 30 days, 84% more likely to have listened to internet radio in the past 30 days and 22% more likely than all MLB Fans to typically watch reality TV. Gen Y MLB Fans are more than twice as likely as all MLB Fans to have visited Twitter in the past 30 days, 59% more likely to have read or contributed to a blog in the past 30 days and 68% more likely to watch video clips online in the same time period. Gen Y MLB Fans are 131% more likely than all MLB Fans to have visited Hulu.com in the past 30 days and 65% more likely to have visited YouTube.com in the same time frame.
“Generation Y is so active on Twitter and Facebook that any modern marketing campaign is incomplete without a social component,” continues Nielsen. “With youthful initiatives like the MLB Fan Cave in New York City and increased social media efforts, the league, teams and advertisers can reach younger audiences in the spaces where they are most engaged.”
Gen Y MLB Fans can also be found participating in a variety of different athletic and entertainment activities. Gen Y MLB Fans are twice as likely as all MLB Fans to have played soccer, football or basketball in the past 12 months and 66% more likely to have played softball or baseball in the same time frame. They are also twice as likely to have attended an R&B/Rap/Hip-Hop concert and 49% more likely to have visited a comedy club in the past year.
Gen Y MLB Fans are 23% more likely than all MLB Fans to be Black/African American and 83% more likely to be Hispanic. The top local markets for Gen Y MLB Fans are Milwaukee (76% of Gen Y are MLB fans); Philadelphia (70%); Hartford, C.T. (66%); St. Louis (66%) and Albany, N.Y. (62%).
DMA |
% of Gen Y MLB Fans |
Milwaukee |
76 |
Philadelphia |
70 |
Hartford, C.T. |
66 |
St. Louis |
66 |
Albany, N.Y. |
62 |
Boston |
61 |
Cincinnati |
60 |
Syracuse, N.Y. |
57 |
Providence, R.I. |
57 |
Minneapolis |
57 |
Looking at the two teams that play in the season opener, Gen Y makes up 21% of the total St. Louis population and 18% of the Miami population. 72% of Gen Y St. Louis residents watched, attended or listened to a Cardinals game in the past year and 36% of Gen Y Miami residents watched, attended or listened to a Marlins game in the same time period.
Top Local Markets for Gen Y MLB Fans
*Scarborough defines the different American generations as Generation Y (age 18–29), Generation X (30–44), Baby Boomers (45–64) and the Silent Generation (65+).
Continue the dialogue with Scarborough Sports Marketing over Twitter by reaching out to @ ScarbSports or @ScarboroughInfo using hashtag #OpeningDay and be sure to visit us on Facebook at https://www.facebook.com/ ScarboroughSports.
This data is from Scarborough USA+ 2011 Release 2. Scarborough measures 210,000 adults aged 18+ annually across a wide variety of media, lifestyle, shopping and demographic categories.
If you are interested in additional Scarborough Sports Marketing reports, please contact Brad Sherer, 480.659.7395/[email protected].
About Scarborough Sports Marketing
Scarborough Sports Marketing (www.scarboroughsportsmarketing.com, [email protected]) measures local and national consumer and lifestyle information by interviewing over 210,000 adults (18+) in 77 Top-Tier Markets, including all professional sports markets. Scarborough sports measurements include fan avidity; multi-media measures including sports viewing and listening; corporate sponsorship information including fans’ shopping and product/service usage; and leisure activities. Scarborough delivers twice-yearly updates of its local market reports to a diverse client base, spanning all major media, advertisers and their agencies. Scarborough Sports Marketing is a division of Scarborough Research, which is a joint venture between Arbitron Inc. and The Nielsen Company.
Contact: Haley Dercher, 646.654.8426/[email protected]
Source: Rightsholder: Scarborough USA 2012; http://www.prnewswire.com/news-releases/hitting-a-home-run-with-the-digital-generation-145950285.html.
Marketing research as defined by the American Marketing Association (2004/2014) is: the process or set of processes that links the consumers, customers, and end users to the market through information – information used to identify and define marketing opportunities and problems; generate, refine, and evaluate marketing actions; monitor marketing performance; and improve understanding of marketing as a process. Marketing research specifies the information required to address these issues, designs the method for collecting information, manages and implements the data collection process, analyzes the results, and communicates the findings and their implications. More specifically, sports marketing research is the systematic process of collecting, analyzing, and reporting information to enhance decision making throughout the strategic sports marketing process.
Three key issues emerge from this definition. First, marketing research must be systematic in its approach. Systematic research is both well organized and unbiased. The well-organized nature of good research depends on adherence to the marketing research process, which is discussed later in this chapter. Researchers must also be careful not to make up their minds about the results of a study prior to conducting it; therefore, researchers must conduct the study in an unbiased manner.
Second, the marketing research process involves much more than collecting data and then reporting them back to decision makers. The challenge of research lies in taking the data collected, analyzing them, and then making sense of the data. Marketing researchers who can collect data, dump them in the computer, and spit out reports are a dime a dozen. The most valuable marketing researcher is the person who has the ability to examine the data and then make recommendations about how the information should be used (or not used) in the strategic marketing process.
Third, the importance of marketing research is found in its ability to allow managers to make informed decisions. Without the information gathered in research, management decision making would be based on guessing and luck. As Woody Hayes, Ohio State’s legendary football coach, once said about the forward pass, “Three things can happen and two of them are bad!”
Finally, the definition states that marketing research is useful throughout the entire strategic sports marketing process. Traditionally, the focus of marketing research has been on how the information can be used in better understanding consumers during the planning phase of the strategic sports marketing process. It is also important to realize that marketing research is relevant at the implementation and control phases of the strategic marketing process. For example, research is used in the control phase to determine whether marketing goals are being met.
The marketing research process
As previously mentioned, marketing research is conducted using a systematic process, or the series of interrelated steps shown in Figure 3.1. Before we discuss each step in the research process in greater detail, two points should be kept in mind. First, the basic framework or process for conducting marketing research does not change, although every marketing research problem will be different. For example, the Detroit Red Wings may engage in research to understand fan satisfaction or the effectiveness of a between-period promotion. Each of these research questions is different. However, the basic marketing research process used to address each question is the same.
Second, you should understand that the steps of the research process are interdependent. In other words, defining the problem in a certain way will affect the choice of research design. Likewise, selecting a certain type of research design will influence the selection of data collection tools. Let us now examine each of the steps in the research process.
Defining the problem or opportunity
The first and most important step of the marketing research process for sports marketers is to define the problem or opportunity. Problem definition requires the researcher to specify what information is needed to assist in either solving problems or identifying opportunities by developing a research problem statement. If the research addresses the correct problem or opportunity and seeks to properly define the problem or opportunity, then the project could be successful. However, the data collected may be useless if they are not the information needed by the sports marketing manager.

Figure 3.1 Marketing research process
Table 3.1 Issues addressed at initial research meeting
• A brief background or history of the organization or indivldual(s) requesting the research |
• A brief background of the types of research the organization has done in the past, if any |
• The information the organization wants and why (i.e., what they plan to do with the information once it is obtained) |
• The targeted population of interest for this research |
• The expectations in terms of the timeframe for the research and costs of conducting the study |
How does the researcher identify problems or opportunities that confront the sports organization? Initially, information is gathered at a meeting between the researcher and his or her client. In this meeting, the researcher should attempt to collect as much information as possible to better understand the need for research. Table 3.1 shows a list of the typical questions or issues addressed at the first information-gathering meeting. Keep in mind that the ultimate goal of these meetings is to ensure that there is a clear understanding between the researcher and the decision makers as to the nature and role of the research and how it relates back to the need for information in the decision-making process.
Research objectives
Based on this initial meeting, the researcher should have collected the proper information to develop a set of research objectives; guidelines that establish an agenda of research activities necessary to implement the research process. Research objectives describe the various types of information needed to address the problem or opportunity. Each specific objective will provide direction or focus for the rest of the study.
Here is an example of the research objectives developed for the NASCAR Sponsorship Study conducted by Sponsorship Research and Strategy (SRS).1 The purpose of the study was to provide information that would assist NASCAR sponsors in planning, evaluating, and justifying their NASCAR sponsorships. More specifically, the research objectives were as follows:
![]() Identify the benefits associated with NASCAR sponsorships.
Identify the benefits associated with NASCAR sponsorships.
![]() Record fan preferences for sales promotions.
Record fan preferences for sales promotions.
![]() Identify lucrative market segments among NASCAR fans.
Identify lucrative market segments among NASCAR fans.
![]() Develop an extensive profile of NASCAR fans.
Develop an extensive profile of NASCAR fans.
![]() Examine fan attitudes toward NASCAR and NASCAR sponsors.
Examine fan attitudes toward NASCAR and NASCAR sponsors.
![]() Analyze sponsorship effectiveness for different types of NASCAR sponsorships (e.g., car vs. league).
Analyze sponsorship effectiveness for different types of NASCAR sponsorships (e.g., car vs. league).
![]() Provide a comparative basis for sponsorship performance among NASCAR Nextel Cup drivers.
Provide a comparative basis for sponsorship performance among NASCAR Nextel Cup drivers.
![]() Provide a comparative basis for sponsorship performance among official NASCAR sponsors in selected product categories.
Provide a comparative basis for sponsorship performance among official NASCAR sponsors in selected product categories.
How would NASCAR or any sports entity go about measuring whether these objectives have been reached? The accompanying article describes this growing concern as it relates to sponsorship ROI. As the IEG narrative illustrates, to not define evaluation tools in accordance with objectives measures and/or the failure to analyze research outcomes completely can be more dangerous than not measuring at all.
A sponsorship measurement solution
COMPLEX CHALLENGES REQUIRE NEW TOOLS
Sponsorship’s impact is not one-dimensional. A partnership’s ability to meet its goals depends on a series of interconnected variables.
Marketers long ago recognized that the sponsorship equation is not a simple one. They responded by reinventing the way they activate and execute partnership programs, developing big new ideas and using the latest technology to make sponsorships more relevant and engaging.
But when it comes to measurement, evaluation tools have not kept up with the pace of change. As the case study on the following pages shows, well-intentioned attempts that don’t ask the right questions, or fail to analyze research outputs completely, can be more dangerous than not measuring at all, as they lead to false deductions and wrong decisions.
It also reveals that the solution does not need to be invented, merely applied.
First, brands must incorporate deep knowledge of how sponsorship works in shaping perceptions and driving changes in attitude and behavior into each step, ensuring the right partnership is targeted to the right group and activated in the right ways.
Second, marketing science—which already determines results for traditional media campaigns—must be applied to close the loop and determine ROI. The metrics, models and analyses used by brands to determine the effectiveness of their advertising can be adapted and scaled for partnerships of all types, including sports, entertainment, events and causes.

MAKING THE RIGHT DECISIONS
IEG Consulting engaged with a premium whiskey brand that was in the middle of a multi-year auto racing sponsorship to determine how the investment was performing against multiple objectives and whether it was delivering ROI. Chief among the brand’s goals: acquiring one million new consumers.
In the process of gathering the necessary data to model the brand’s return, the full picture of the program emerged, revealing that if true accountability and smart analytics had been incorporated from the start, the brand’s objectives, execution and results would have been dramatically different.
The brand made its initial decision to sponsor motorsports based on research that showed a high percentage of whiskey drinkers among fans of the sport.
A deeper dive into the purchasing habits and lifestyles of racing fans revealed that they were much more likely to purchase non-premium brands and drank whiskey only on special occasions. In direct opposition to the sponsor brand’s positioning, they were more likely to drink whiskey as a shot or mixed with soft drinks.
If the brand had the right data at the start, it could have targeted its racing efforts to build loyalty among the niche audience of its consumers to be found in the suites and skyboxes at race tracks instead of trying to convert the fans in the grandstands.
Broadcast reports showed that the brand received significant exposure during telecasts of races. Translating impressions into advertising equivalencies showed a 2:1 return vs. the sponsorship fee.

However, analysis of survey research determined that little to no awareness was generated for the responsible drinking campaign that was a focal point of the brand’s messaging through signage and on-car exposure and a key goal of the sponsorship. The broadcasting of an already well-known brand name was not a primary objective.
SURVEY RESEARCH
Sixteen waves of pre- and post-race research were conducted in key markets. On the surface, a number of outputs indicated positive movement as a result of exposure to the sponsorship, including higher awareness of retail and on-premise activity and increased likelihood of associating the brand with key image attributes and benefits.
Applying historical insights from sponsorship research that indicate a greater impact with current consumers vs. non-consumers, IEG’s analysis determined that this pattern repeated itself here: There was virtually no increase in awareness of promotions or positive brand associations among consumers of competitive brands. Additionally, research into activity among two other whiskey brands that also were racing sponsors indicated better results for the competitors.
Finally, survey results showed an increase in intent to purchase the brand. Additionally, the brand’s overall sales increased during the term of the sponsorship.
But when modeling was applied to the drivers of business, it was clearly determined that the sponsorship was not among them. These sophisticated analytics were able to show the client that it had acquired only 10,000 new customers—not one million—as a result of its racing program.

LINKING SPONSORSHIP INVESTMENTS WITH BUSINESS RESULTS
Marketing science applications such as the ROI modeling used in the spirits brand case study are typically thought of in the context of traditional media campaigns. But leading brands are putting these analytics to work for partnerships ranging from six-figure single-market deals to nine-figure global platforms.
More marketers will follow suit as the accountability bar continues to rise. Nearly two-thirds of CMOs say that ROI—the direct impact of expenditures on business results—will be the primary measure of marketing effectiveness by 2015.*
Sponsorship—because it delivers true engagement—is poised to claim a better seat at the marketing table, but only if it can demonstrate its contributions to the enterprise. But measuring multifaceted engagement rather than one-dimensional reach and evaluating the complex ecosystem of sponsorship—with its ability to impact multiple audiences—requires at least the same level of data, rigor and analysis that is used to assess the other tools in the marketing arsenal.
This is not as daunting as it may sound. The techniques and analytic approaches of marketing science have become much more accessible and are flexible to the amount of data available. Much of the data needed to develop meaningful models and analyses is routinely captured by companies in the course of business.
Brands that have already taken this step know how their sponsorship investments are performing and how to make them work better.
In addition, their partnerships have gained a place in the strategic planning process, alongside other elements of the marketing mix rather than isolated and an afterthought. And, these brands are fostering better partnerships with rightsholders through a shared, fact-based understanding of the value exchange and what is needed for both to succeed.
Brands that don’t take this step will see sponsorship budgets reduced in favor of marketing communications that can prove their value.
*IBM Global CMO Study, October, 2011
6
Source: From “A Sponsorship Measurement Solution,” IEG October, 2011. Ukman, L. and Krasts, M.; http://www.sponsorship.com/ieg/files/07/07903e35-98d1-4f1c-b318-7524b3104222.pdf. Credit: IEG.
Table 3.2 Marketing research proposal outline
Background and History |
Defining the Problem or Opportunity |
Research Objectives |
Research Methodology |
a. Sample |
b. Procedures |
c. Topical areas |
Time Estimate |
a. Design of instrument |
b. Data collection |
c. Data entry |
d. Data analysis |
e. Final report preparation |
Cost Estimate |
Writing a marketing research proposal
To ensure agreement between the researcher and the client on the direction of the research, a research proposal is developed. A research proposal is a written blueprint that describes all the information necessary to conduct and control the study. The elements of the research proposal include background for the study; research objectives based on the need for the research, research methodology, timeframe, and cost estimates. An outline for developing a research proposal is shown in Table 3.2.
Choosing the research design type
Once the researcher is certain that the problem is correctly defined, the research design type is considered. The research design is the framework for a study that collects and analyzes data. Although every study is unique and requires a slightly different plan to reach the desired goals and objectives, three research design types have emerged: exploratory, descriptive, and causal designs. The type and nature of the design is highly dependent upon desired outcomes. Whatever research design or designs are ultimately chosen, it is important to remember the crucial principle in research is that the design of the research should stem from the problem.2
Exploratory designs
Exploratory designs are useful when research problems are not well defined. For instance, the general manager for the RailCats may say that ticket sales are down, but he is unsure why. In this case, an exploratory research design would be appropriate because there is no clear-cut direction for the research. The research is conducted to generate insight into the problem or to gain a better understanding of the problem at hand. For example, the researcher may recommend examining minor league baseball attendance trends or conducting one-on-one interviews with team management to determine their ideas about the lack of attendance. Because exploratory research design types address vague problems, a number of data collection techniques are possible. These data collection techniques will be addressed during the next phase of the research process.
Descriptive designs
If the research problem is more clearly defined, then a descriptive design is used. A descriptive design type describes the characteristics of a targeted group by answering questions such as who, what, where, when, and how often. The targeted group or population of interest to the decision maker might be current season ticket holders, people in the geographic region who have not attended any games, or a random group of people in the United States.
The RailCats study used a descriptive research design. The targeted group in this case was fans who may potentially attend RailCats home games. Characteristics of the group of interest in the study included where the fans were coming from (geographic area), how often they attended games, when they were most likely to attend games (weekends, weekdays, day, or evening), and demographics (age, race, and gender).
In addition to describing the characteristics of a targeted group, descriptive designs show the extent to which two variables differ or correlate. For example, a researcher may want to examine the relationship between game attendance and merchandising sales. Using the RailCats example, researchers wanted to understand the relationship between age of the fans and likelihood of attending games in the future. A descriptive research design type would allow us to examine the relationship or correlation between these two variables (age and future attendance).
If a positive relationship were found between age and likelihood of attending games in the future, then the older you get, the more likely you would be to attend future RailCats games. That is, as the age of the fan increases, the likelihood of going to future games also increases (see Figure 3.2a). However, a negative relationship means that as age increases, the likelihood of going to games decreases (see Figure 3.2b). Knowing the shape of this relationship will help the RailCats marketers make decisions on whom to target and how to develop the appropriate marketing mix for this group. What do you think the relationship between age and attendance would look like?

Figure 3.2 Descriptive research designs
Using a descriptive design, we can explore the relationship between two variables, such as age and likelihood of attending games in the future. However, what this does not tell us is that age causes the likelihood of attending to either increase or decrease. This can only be determined through a causal design.
Causal designs are useful when problems are very clearly defined. More specifically, causal designs examine whether changing the level of one variable causes the level of another variable to change. This is more commonly called a cause-and-effect relationship.
In an example of a causal design, the Southshore RailCats could conduct a study to determine whether varying the level of advertising on a local radio station has any effect on attendance. In this case, level of advertising is the independent variable and attendance is the dependent variable. The dependent variable is the variable to be explained, predicted, or measured (i.e., attendance). The independent variable is the variable that can be manipulated or altered in some way (i.e., level of advertising or perhaps whether to advertise at all).
To show cause-and-effect relationships, three criteria must be satisfied. The first criterion for causality is that the occurrence of the causal event must precede or be simultaneous to the effect it is producing. Using our example, advertising must precede or occur at the same time as the increase in attendance to demonstrate a cause-and-effect relationship.
The second criterion for causality involves the extent to which the cause and the effect vary together. This is called concomitant variation. If advertising expenditures are increased, then season ticket sales should also increase at the same rate. Likewise, when advertising spending is decreased, season ticket sales should also decline. Keep in mind, however, that concomitant variation does not prove a cause-and-effect relationship, but it is a necessary condition for it.
A third criterion used to show causal relationships requires the elimination of other causal factors. This means that another variable or variables may produce changes in the dependent variable. This possibility is called a spurious association or spurious correlation. In the dynamic sports marketing environment, it could be difficult to isolate and eliminate all possible causal factors. For instance, an increase in attendance may be due to the success of the team, ticket prices, and addition of other promotions (e.g., bobblehead night) rather than increased advertising. A researcher must attempt to eliminate these other potential factors, hold them constant, or adjust the results to remove the effects of any other factors.
Identifying data collection techniques
As with the previous steps in the research process, decisions regarding data collection techniques are very much a function of problem definition and research design type. If the research problem is loosely defined and requires an exploratory research design, then there are more alternatives for collecting that information. However, for well-specified problems using a causal design, the choice of data collection techniques decreases dramatically.
Data collection techniques can be broadly categorized as secondary or primary. Secondary data refer to data that were collected earlier but are still related to the research question. These data may come from within the sports organization or from outside the organization. For example, useful internal secondary data might include a history of team merchandise sales figures, event attendance figures, or fan satisfaction studies that were conducted previously. External secondary data, or data from outside the organization, may come from any number of the sources presented later in this chapter.
Although a researcher should always try to use existing data before conducting his or her own inquiries, it is sometimes impossible to find data relevant to the problem at hand. In that case, research must turn to the other data collection alternative, primary data. Primary data are information gathered for the specific research question at hand.
Before turning our discussion to the various types of primary and secondary data, it is important to note that both types of data are useful in understanding consumers. For example, sports marketers from the Chicago Bears may want to look at trends in merchandising sales for each NFL team before undertaking a study to determine why their sales have decreased. In this case, secondary data are a useful supplement to the primary data they would also need to collect.
As just mentioned, secondary data may be found within the sports marketing organization (internal secondary data) or from outside sources (external secondary data). External secondary data can be further divided into the following categories:3
![]() Government reports and documents
Government reports and documents
![]() Standardized sports marketing information studies
Standardized sports marketing information studies
![]() Trade and industry associations
Trade and industry associations
![]() Books, journals, and periodicals
Books, journals, and periodicals
Government reports and documents
As we discussed in Chapter 2, environmental scanning is an essential task for monitoring the external contingencies. Government reports and documents are excellent sources of data for sports marketers exploring the marketing environment. Government sources of data can provide demographic, economic, social, and political information at the national, state, and local levels. This information is generally abundant and can be obtained at no cost. There are thousands of government sources that are useful for environmental scanning. In fact, many are now published on the Internet. Let us look at a few of the most useful sources of government data.
Bureau of the Census of the U.S. Department of Commerce (www.census.gov)
The Bureau of the Census is one of the most comprehensive sources of secondary data that are readily available via the Internet. Here are some of the census documents that may be of interest: Census of Population, Census of Retail Trade, Census of Service Industries, and Census of Manufacturing Industries.
The Statistical Abstract of the United States (www.census.gov/compendia/statab/)
The Statistical Abstract of the United States, which is published each year by the Bureau of the Census, is an excellent place to begin a search for secondary data. In addition to more general statistical information on the population and economy, the Statistical Abstract has a section entitled “Parks, Recreation and Travel.” Within this section, statistics can be found on both participants and spectators.

Photo 3.1 The growing number of women’s sport participants is being monitored through secondary marketing research.
Source: Elissa Unger
Chambers of Commerce
Usually, Chambers of Commerce have multiple sources of demographic information about a specific geographic area, including education, income, and businesses (size and sales volume). This type of information can be helpful to sports marketers conducting research on teams or events within a metropolitan area.
Small Business Administration (SBA) (www.sba.gov)
SBA-sponsored studies can be a valuable source for the environmental scan. The sources include statistics, maps, national market analyses, national directories, library references, and site selection.
Standardized sports marketing information studies
Although government sources of secondary data are plentiful, they are generally more useful for looking at national or global trends in the marketing environment. Standardized sports marketing information studies, such as the ESPN Sports Poll or the Sports Business Research Network (www.sbrnet.com), focus more specifically on sports consumers and markets. In fact, these sources of secondary data can provide extremely specialized information on consumers of a specific sport (e.g., golf) at a specific level of competition or interest (avid golfers). Table 3.3 shows the table of contents for a standardized study available for better understanding the golf market in North America.
Table 3.3 North American Golf Report table of contents
Executive summary |
Golf supply |
• Golf supply |
• Golf supply by country |
• Population per holes |
Golf development |
• Development by country |
• Golf course openings |
• Recent golf course openings |
• New openings by state |
Golf participation |
• Participation by country |
• Participation by state |
• Number of golfers by state |
Regional breakdown of supply, growth and participation in golf related goods |
• Imports and exports by country |
Source: http://www.golf-research-group.com/reports/report/22/content.html.
Table 3.4 Standardized sports marketing information studies
Team Marketing Report’s Sports Sponsor Factbook |
Team Marketing Report’s Stadium Signage Report |
Team Marketing Report’s Inside the Ownership of Professional Sports Team |
IEG’s Sponsorship Report |
IEG’s Intelligence Reports |
Sports & Media Challenges Sports Sponsorship Survey |
National Sporting Goods Manufacturers’ Sports Media Index |
National Sporting Goods Manufacturers’ Country Market Research Studies |
American Sports Data’s American Sport Analysis Reports |
National Golf Foundation’s Golf Business Publications |
Gallup Poll’s Sports Participation Trends |
Simmons Market Research Bureau’s Study of Media and Market. Sports and Leisure |
ESPN Chilton Sports Poll |
Yankelovich Monitor Sports Enthusiast Profile |
These studies are called standardized because the procedures used to collect the information and the types of data collected are uniform. Once the information is collected, it is then sold to organizations that may find the data useful. Although the data collected are more specific than other sources of secondary data, the data may still not directly address the research question. Table 3.4 shows a sampling of the standardized sources of secondary data that may be useful to sports marketers.
Trade and industry associations
There are hundreds of associations that can be helpful in the quest for information. Sports associations range from the very broad in focus (e.g., NCAA) to the more specific (e.g., National Skating Suppliers Association). For example, the Women’s Sport Foundation (www.womenssportsfoundation.org), established in 1974 by Billie Jean King, works to improve public understanding of the benefits of sports and fitness for females of all ages. To support this educational objective, the foundation has a number of publications and research reports that serve as excellent sources of secondary data. In fact, the Women’s Sport Foundation now has a cyberlibrary that contains 40 plus years of information gathered on topics and issues such as business, coaching, ethics, gender equity, history, homophobia, leadership and employment, media, medical, participation, sexual harassment, special needs, and training and fitness. Here is just a small sampling of trade and sport associations:
American Marketing Association
European Association for Sport Management
Institute of Sport and Recreation Management
National Association of Sports Commissions
National Collegiate Athletic Association
National Sporting Goods Association
North American Society for Sport Management
Sport Management Association of Australia and New Zealand
Sport Marketing Association
Sports & Fitness Industry Association (formerly, SGMA)
Books and journals
A comprehensive list of journals related to sport follows the books listed here.
Books
IEG’s Complete Guide to Sponsorship
Sport Marketing (Mullins, Hardy, & Sutton)
Sport Marketing: A Strategic Perspective (Shank & Lyberger)
Sport Marketing (Pitts and Stotlar)
Sport Marketing (Fullerton)
Sport Marketing: Canadian (O’Reilly)
Sport & Entertainment Marketing (Kaser)
Team Marketing Report’s Newsletter
Cases in Sport Marketing (Donovan)
Cases in Sport Marketing (McDonald and Milne)
Case Studies in Sport Marketing (Pitts)
Developing Successful Sports Marketing Plans (Stotlar)
Sports Marketing: Global Marketing Perspectives (Schlossberg)
Sports Marketing: It’s Not Just a Game Anymore (Schaaf)
Sports Marketing: Famous People Sell Famous Products (Pemberton)
Sports Marketing: The Money Side of Sports (Pemberton)
Sports Marketing/Team Concept (Leonardi)
The Elusive Fan: Reinventing Sports in a Crowded Marketplace (Rein, Kotler, and Shields)
Marketing of Sport (Chadwick and Beech)
Team Sports Marketing (Wakefield)
Keeping Score: An Inside Look at Sports Marketing (Carter)
Ultimate Guide to Sport Marketing (Graham, Neirotti, and Goldblatt)
Sports Marketing: Managing the Exchange Process (Milne and McDonald)
Academic journals of interest to sports marketers
European Sport Management Quarterly
International Journal of Sport Management, Recreation and Tourism
International Journal of Sports Marketing and Sponsorship
Journal of Advertising
Journal of Services Marketing
Journal of Sport & Tourism
Journal of Sport and Social Issues
Journal of Sport Behavior
Journal of Sport Management
Journal of Sport Tourism
Sports Business Journal
Sport Management Review
Sport Marketing Quarterly
The Journal of Intercollegiate Athletics
The Journal of Sport
Data collected specifically to answer your research questions are called primary data. There are a wide variety of primary data collection techniques. Again, remember that your method of collecting primary data depends on your earlier choice of research design. Let us look briefly at some of the primary data collection methods and their pros and cons.
Depth interviews
Depth interviews are a popular data collection technique for exploratory research. Sometimes called “one-on-ones,” depth interviews are usually conducted as highly unstructured conversations that last about an hour. Unstructured means that the researcher has a list of topics that need to be addressed during the interview, but the conversation can take its natural course. As the respondent begins to respond, new questions may then emerge that require further discussion.

Web 3.1 Sport Business Research is an excellent source of primary and secondary data.
Source: www.SBRNET.com
The primary advantage of depth interviews is that they gather detailed information on the research question. Researchers may also prefer depth interviews to other primary methods when it is difficult to coordinate any interface with the target population. Just think of the difficulty in trying to organize research using professional athletes as the target population. For instance, a sports marketing researcher may want to determine what characteristics a successful athlete-endorser requires. To address this research question, depth interviews may be conducted with professional athletes who have been successful endorsers, athletes who have never endorsed a product, brand managers of products being endorsed, or any other individuals who may provide insight into the research question. The responses given in these interviews then would be used to determine the characteristics of a successful endorser.
Depth interviews may also be appropriate when studying complex decision making. For example, researchers may want to find out how others influence your decision to attend a sporting event. The information gathered in the depth interviews at the initial phase of this research may then be used in the development of a survey or some other type of primary research. In yet another example, depth interviews were used in a study to understand the decision-making process used by corporate sponsors.4
Focus groups
Another popular exploratory research tool is the focus group. A focus group is a moderately structured discussion session held with eight to ten people. The discussion focuses on a series of predetermined topics and is led by an objective, unbiased moderator. Much like depth interviews, focus groups are a qualitative research tool used to gain a better understanding of the research problem at hand. For instance, focus groups may be useful in establishing a team name or logo design, deciding what food to offer for sale in the concession areas, determining how best to reposition an existing sporting goods retailer or learning what kinds of things would attract children to a collegiate sporting event. Let us look at two examples of sports organizations that have used focus groups.

Photo 3.2 Focus groups
Source: Shutterstock.com
In 2010, a project to determine if public funding was supported by taxpayers for a new Minnesota Vikings stadium was commissioned by the Metropolitan Sports Facilities Commission, the agency that owns and operates the 28-year-old Metrodome. The commission utilized five focus groups conducted in various cities; each group was between nine and eleven participants who were identified as potential November voters, not big sports fans, and not following the Vikings stadium debate. Results show that participants would approve a variety of funding mechanisms including openness to a statewide sales tax.5 In another example, as part of their off-season efforts to improve their team and their public image, the Mets have cut single-game ticket prices by an average of 14 percent, an attempt to increase revenues and coax spectators back to Citi Field. The team’s season-ticket, ticket-plan, and group-ticket holders will receive an additional 10 percent discount. David Howard, the Mets executive vice president of business operations, said after conducting in-season market research and holding focus groups with fans, the Mets decided to make these price adjustments. “Largely what we’re doing here is a result from the feedback we’ve received from our customers,” he said. “We feel we are the people’s team.”6
Conducting focus groups, like those in the Vikings and Mets examples, requires careful planning. Table 3.5 provides questions and answers that must be considered when planning and implementing focus groups.
Projective techniques
Another source of data collection is through the use of projective techniques. Projective techniques refer to any of a variety of methods that allow respondents to project their feelings, beliefs, or motivations onto a relatively neutral stimulus. Projective techniques were developed by psychologists to uncover motivations or to understand personality.7 The most famous projective technique is the Rorschach test, which asks respondents to assign meaning to a neutral inkblot. Although the Rorschach may not have value for sports marketing researchers, other projective techniques are useful. For instance, sentence completion, word association, picture association, and cartoon tests could be employed as data collection techniques. Figure 3.3 demonstrates the use of sentence completion to gain insight into consumer attitudes toward Nike. The responses to these sentences could be analyzed to determine consumer perceptions of the target market for Nike (question 1), the brand image of Nike (question 2), and product usage (question 3).
Surveys
Data collection techniques are more narrowly defined for descriptive research design types. As stated earlier, a descriptive study describes who, where, how much, how often, and why people are engaging in certain consumption behaviors. To capture this information, the researcher would choose to conduct a survey. Surveys allow sports marketing researchers to collect primary data such as awareness, attitudes, behaviors, demographics, lifestyle, and other variables of interest. For example, the Cleveland Indians handed out roughly 30,000 surveys over 14 games to understand fans’ perceptions of the team’s on-the-field winning prospects, the quality of the team’s management and commitment to winning, and pricing issues.8
Table 3.5 Planning and implementing focus groups
Q. How many people should be in focus group? |
A. Traditionally, focus groups are composed of 8 to 10 people. However, there is a current trend toward having minigroups of 5 to 6 people. Minigroups are easier to recruit and allow for better and more interaction among focus group participants. |
Q. How many people should I recruit, if I want 8 people in my group? |
A. The general rule of thumb is to recruit 25 percent more people than the number needed. For example, if you are planning on holding minigroups with 6 people, you should recruit 8. Unfortunately, some respondents will not show up for the group, even if there is an incentive for participation. |
Q. What is a good incentive for participants? |
A. Naturally, a good incentive depends largely on the type of individual you want to attract to your group. For example, if your group wants to target runners who might be participating in a local 10K race, $3S to $50 may be the norm, including dinner or light snacks. However, if your group requires lawyers to discuss the impact of Title IX on the NCAA, an incentive of $75 to $100 may be more appropriate. In addition to or instead of cash, noncash incentives could also serve. For example, free tickets or merchandise may work better than cash for some groups. |
Q. Where should the focus group be conducted? |
A. The best place to conduct focus groups is at a marketing research company that has up-to-date focus group facilities. The facility is usually equipped with a one-way mirror, videotape, microphones connected to an audio system, and an observation room for clients. In addition, more modern facilities have viewing rooms that allow the client to interact with the moderator via transmitter while the group is being conducted. |
Q. How should I choose a moderator? |
A. There is no rule of thumb, but research has identified a set of characteristics that seem to be consistent among good moderators. These characteristics include the following: quick learner, friendly leader. knowledgeable but not all-knowing, excellent memory, good listener, a facilitator – not a performer, flexible, empathic, a “big-picture” thinker, and a good writer. In addition, a good moderator should have a high degree of sports industry knowledge or product knowledge.7 |
Q. How many groups should be conducted? |
A. The number of groups interviewed depends on the number of different characteristics that are being examined in the research. For example, Notre Dame may want to determine whether regional preferences exist for different types of merchandise. If so, two groups may be conducted in the North, two groups in the South, and so on. Using the previous example. If lawyers: were the participants in a focus group, two or three total groups may suffice. Any more than this and the information would become redundant and the groups would become inefficient. |
Q. What about the composition of the group? |
A. A general rule of thumb is that focus group participants should be homogenous. In other words. people within the group should be as similar as possible. We would not want satisfied, loyal fans in the same group as dissatisfied fans. Similarly, we would not want a group to be composed of both upper-level managers and the employees that report to them. In the latter case, lower-level employees may be reluctant to voice their true feelings. |

Figure 3.3 Sentence completion test
An additional illustration of survey research can be found in the following NASCAR study. In the article Taylor performed market research to demonstrate how team and brands can improve how they engage fans in digital and social media outlets.9
DRIVERS SHOULD TAKE A SPIN ONLINE, STUDY SHOWS
NASCAR fans consume more and more information on the sport from social and digital media, but a new study by marketing and communications firm Taylor shows teams and brands can improve how they engage the fans through those outlets.
Avid NASCAR fans over the last year reported they were twice as likely to have engaged and interacted with athletes of other sports through social and digital media than they were with NASCAR drivers. The sport’s teams and sponsors historically have had drivers make appearances at retail outlets in race markets but are only beginning to make drivers available online, as Roush Fenway Racing did when it hosted a Google+ Hangout with Matt Kenseth, Greg Biffle, Ricky Stenhouse Jr. and Trevor Bayne before the Daytona 500.
“We’re still doing a lot of Kroger retail visits,” said Ryan Mucatel, Taylor’s managing partner. “How many brands are truly engaging with an active fan base online the way they could be?”
Avid NASCAR fans continue to increase their consumption of social and digital media. More than half said they visit social media sites regularly for NASCAR content and 78 percent of 18- to 34-year-olds said they turn to outlets such as Facebook and Twitter for NASCAR information. Most of them use those outlets to share NASCAR information with others, too.
The study, which is based on a survey of 1,500 self-described avid NASCAR fans, was fielded for Taylor by the global research company Toluna. It is the fifth year the firm has done the study. Taylor counts NASCAR as a client and oversaw several studies for the sanctioning body two years ago in such areas as communications and the race-day experience.

Taylor’s study didn’t identify the overall size of the NASCAR fan base or the percentage of casual or avid fans. It concentrated on avid fans and their consumption patterns.
Avid NASCAR fans remain loyal to sponsors, saying they are more likely to buy the products of a brand that sponsors their favorite driver.
The survey gave avid fans a list of 25 companies not in NASCAR and asked them which sponsors they would like to see get involved in the sport. The four most common answers were Nike, Google, Amazon and Apple. NASCAR and its teams have pushed to sign technology sponsors in recent years but had limited success.
In a question on how avid fans choose their favorite driver, Taylor executives were surprised to see that 41 percent of NASCAR fans in the 18- to 34-year-old demographic said they pick their driver based on who his sponsor is, while only 27 percent of all avids said they chose a driver that way.
Approximately 78 percent of avid fans said they would recommend the sport to others. That number was up from 71 percent a year earlier.
Half of avid fans said they are “more” or “much more” interested in the sport than they were a year ago, and 61 percent of 18- to 34-year-olds said they are more interested in NASCAR than they were in 2011. Among fans surveyed who are relatively new to the sport, the number that said they are “much more interested” in NASCAR jumped to 65 percent.
Source: Tripp Mickle. Rightsholder: Sports Business Journal. http://www.sportsbusinessdaily.com/Journal/Issues/2012/11/05/Research-and-Ratings/NASCAR-study.aspx.
Surveys that are considered “snapshots” and describe the characteristics of a sample at one point in time are called cross-sectional studies. For example, if a high school athletics program wanted to measure fan satisfaction with its half-time promotions at a basketball game, a cross-sectional design would be used. However, if a researcher wanted to investigate an issue and examine responses over a longer period of time, a longitudinal study would be used. In this case, fan satisfaction would be measured, improvements would be made to the half-time promotions based on survey responses, and then fan satisfaction would be measured again at a later time. Although longitudinal studies are generally considered more effective, they are not widely used due to time and cost constraints.
Experiments
For well-defined problems, causal research is appropriate. As stated earlier, cause-and-effect relationships are difficult to confirm. Experimentation is research in which one or more variables are manipulated while others are held constant; the results are then measured. The variables being manipulated are called independent variables, whereas those being measured are called dependent variables.
An experiment is designed to assess causality and can be conducted in either a laboratory or a field setting. A laboratory, or artificial setting, offers the researcher greater degrees of control in the study. For example, Major League Baseball may want to test the design of a new logo for licensing purposes. Targeted groups could be asked to evaluate the overall appeal of the logo while viewing it on a computer. The researchers could then easily manipulate the color and size of the logo (independent variables) while measuring the appeal to fans (dependent variable). All other variation in the design would be eliminated, which offers a high degree of control.
Unfortunately, a trade-off must be made between experimental control and the researchers’ ability to apply the results to the “real purchase situation.” In other words, what we find in the lab might not be what we find in the store. Field studies, therefore, are conducted to maximize the generalizability of the findings to real shopping experiences. For example, MLB could test the different colors and sizes of logos by offering them in three different cities of similar demographic composition. Then, MLB could evaluate the consumer response to variations in the product by measuring sales. This common approach to experimentation used by sports marketers is called test marketing.
Test marketing is traditionally defined as introducing a new product or service in one or more limited geographic areas. Through test marketing, sports marketers can collect many valuable pieces of information related to sales, competitive reaction, and market share. Information regarding the characteristics of those purchasing the new products or services could also be obtained. Over a two-year span, ESPN completed market testing of their new 3D channel, including the showing of a USC–Ohio State college football game in select theaters. With a favorable response, ESPN launched ESPN 3D in summer 2010.10 ESPN 3D produced hundreds of events, including NCAA college football, college basketball, NBA Playoffs and Finals, Grand Slam tennis tournaments, Summer and Winter X games, the Little League World Series, MLS and international soccer, boxing, and more. However, ESPN will shut down its 3D network by the end of the 2013 year. ESPN 3D has struggled to gain traction with viewers as the adoption of 3D television sets by U.S. consumers has yet to meet the sky-high expectations of set manufacturers since being launched.11 Another test market recently occurred in Columbus, Ohio, for the National Lacrosse League. Columbus, known as a good test market city because of its demographic composition, featured a star-studded demonstration match. If the game drew more than 5,000 spectators, the league was likely to consider Columbus as a strong possibility for a new franchise.12 Columbus did not enter the league, but the NLL is now 10 teams strong (www.nll.com).
Although test marketer information is invaluable to a sports marketer wanting to roll out a new product, it is not without its disadvantages. One of the primary disadvantages of test marketing is cost and time. Products must be produced, promotions or ads developed, and distribution channels secured – all of which cost money. In addition, the results of the test market must be monitored and evaluated at an additional cost. Another problem related to test marketing is associated with competitive activity. Often, competitors will offer consumers unusually high discounts on their products or services to skew the results of a test market. In addition, competitors may be able to quickly produce a “me-too” imitation product or service by the time the test market is ready for a national rollout.
The problems of cost, time, and competitive reaction may be alleviated by means of a more nontraditional test market approach called a simulated test market. Typically, respondents in a simulated test market participate in a series of activities, such as (1) receiving exposure to a new product or service concept, (2) having the opportunity to purchase the product or service in a laboratory environment, (3) assessing attitudes toward the new product or service after trial, and (4) assessing repeat purchase behavior.
Designing data collection instruments
Once the data collection method is chosen, the next step in the marketing research process is designing the data collection instrument. Data collection instruments are required for nearly all types of data collection methods. Guides are necessary for depth interviews and focus groups. Data collection forms are needed for projective techniques. Even experiments require data collection instruments.

Figure 3.4 Designing a questionnaire
Source: Churchill. IM/TM – Basic Markrting Research, 3/E, 3E. © 1996 South-Western, a part of Cengage Learning, Inc.
One of the most widely used data collection instruments in sports marketing is the questionnaire or survey. All forms of survey research require the construction of a questionnaire. The process of designing a questionnaire is shown in Figure 3.4.
Specify information requirements
As the first step of questionnaire design, the information requirements must be specified. In other words, the researcher asks what information needs to be gathered via the questionnaire. This should be addressed in the initial step of the research process if the problem is carefully defined. Remember, in the first step of the marketing research process, research objectives are developed based on the specified information requirements. The research objectives are a useful starting point in questionnaire design because they indicate what broad topic will be addressed in the study.
Decide method of administration
The method of administration is the next consideration in questionnaire design. The most common methods of administration are via mail, phone, e-mail, Web sites, or personal interview. Each method has its own unique advantages and disadvantages that must be considered (see Table 3.6). For example, if a short questionnaire is designed to measure fan attitudes toward the new promotion, then a phone survey may be appropriate. However, if the research is being conducted to determine preference for a new logo, then mail or personal interviews would be necessary.
Table 3.6 Comparison of methods of administration


Figure 3.5 New Year’s resolution survey
Determine content of questions
The content of individual questions is largely governed by the method of administration. However, several other factors must be kept in mind. First, does the question address at least one research objective? Second, are several questions necessary to answer an objective? Contrary to popular belief, more is not always better. Third, does the respondent have the information necessary to answer the question? For example, respondents may not be able to answer questions regarding personal seat licenses (PSLs) if they do not have a full understanding or description of what is meant by a PSL. Finally, will the respondent answer the question?
Sometimes respondents possess the necessary information, but they elect not to respond. For instance, questionnaires may sometimes ask sensitive questions (e.g., about income levels) that respondents will not answer.
After deciding on the content of the questions, the form of response should be considered. The form of the response is dependent on the degree of structure in the question. Unstructured questionnaires use a high number of open-ended questions. These types of questions allow respondents to provide their own responses rather than having to choose from a set of response categories provided by the researcher. The following are examples of open-ended questions:
![]() How do you feel about personal seat licenses?
How do you feel about personal seat licenses?
![]() How many years have you been a season ticket holder?
How many years have you been a season ticket holder?
![]() How will the personal seat license affect your attitude toward the team?
How will the personal seat license affect your attitude toward the team?
Determine exact wording of questions
One of the most rigorous aspects of questionnaire design is deciding on the exact wording of questions. When constructing questions, the following pitfalls should be avoided:
![]() Questions should not be too lengthy – Lengthy, run-on questions are difficult to interpret and have a higher likelihood of being skipped by the respondent.
Questions should not be too lengthy – Lengthy, run-on questions are difficult to interpret and have a higher likelihood of being skipped by the respondent.
![]() Questions should not be ambiguous – Clarity is the key to good survey design. For instance, “Do you like sports?” may be interpreted in two very different ways. One respondent may answer based on participation, whereas another may answer from a spectator’s viewpoint. In addition, there may be ambiguity in how the respondent defines sports. Some respondents would call billiards a sport, whereas others may define it as a game.
Questions should not be ambiguous – Clarity is the key to good survey design. For instance, “Do you like sports?” may be interpreted in two very different ways. One respondent may answer based on participation, whereas another may answer from a spectator’s viewpoint. In addition, there may be ambiguity in how the respondent defines sports. Some respondents would call billiards a sport, whereas others may define it as a game.
![]() Questions should not be double barreled or contain two questions in one – For example, “Do you enjoy collecting and selling baseball cards?” represents a double-barreled question. This should be divided into two separate questions: “Do you enjoy collecting baseball cards?” and “Do you enjoy selling baseball cards?”
Questions should not be double barreled or contain two questions in one – For example, “Do you enjoy collecting and selling baseball cards?” represents a double-barreled question. This should be divided into two separate questions: “Do you enjoy collecting baseball cards?” and “Do you enjoy selling baseball cards?”
![]() Questions should not lack specificity – In other words, clearly define the questions. “Do you watch sports on a regular basis?” is a poorly written question in that the respondent does not know the researcher’s definition of regular. Does the researcher mean once per week or once per day?
Questions should not lack specificity – In other words, clearly define the questions. “Do you watch sports on a regular basis?” is a poorly written question in that the respondent does not know the researcher’s definition of regular. Does the researcher mean once per week or once per day?
![]() Questions should not be technical in nature – Avoid asking respondents a question that will be difficult for them to answer. For instance, “What type of swing weight do you prefer in your driver?” may be too technical for the average golfer to answer in a meaningful fashion.
Questions should not be technical in nature – Avoid asking respondents a question that will be difficult for them to answer. For instance, “What type of swing weight do you prefer in your driver?” may be too technical for the average golfer to answer in a meaningful fashion.
Determine question sequence
Now that the question wording has been determined, the researcher must determine the proper sequence of the questions. First, a good questionnaire starts with broad, interesting questions that hook the respondents and capture their attention. Similarly, questions that are more narrow in focus, such as demographic information, should appear at the end of the questionnaire. Second, questions that focus on similar topical areas should be grouped together. For example, a fan satisfaction questionnaire may include sections on satisfaction with concessions, stadium personnel, or game promotions.
Finally, proper question sequencing must consider branching questions and skip patterns. Branching questions direct respondents to questions based on answers to previous questions. For example, the first question on a questionnaire may be, “Have you ever been to a RailCats game?” If the respondents answer “yes,” they might continue with a series of questions concerning customer satisfaction. If the respondents answer “no,” then they might be asked to skip forward to a series of questions regarding media preferences. Because branching questions and skip patterns are sometimes confusing to respondents, these types of questions should be avoided if at all possible.
Design physical characteristics of questionnaire
One of the final steps in the questionnaire development process is to consider carefully the physical appearance of the questionnaire. If the questionnaire is cluttered and looks unprofessional, respondents will be less likely to cooperate and complete the instrument. Other questionnaire design issues include the following:
![]() Questionnaire should look simple and easy to fill out.
Questionnaire should look simple and easy to fill out.
![]() Questionnaire should have subheadings for the various sections.
Questionnaire should have subheadings for the various sections.
![]() Questionnaire should provide simple and easy-to-understand instructions.
Questionnaire should provide simple and easy-to-understand instructions.
![]() Questionnaire should leave sufficient room to answer open-ended questions.
Questionnaire should leave sufficient room to answer open-ended questions.
Pretest
After the questionnaire has been finalized and approved by the client, the next step in the questionnaire design process is to pretest the instrument. A pretest can be thought of as a “trial run” for the questionnaire to determine if there are any problems in interpreting the questions. In addition to detecting problems in interpreting questions, the pretest may uncover problems with the way the questions are sequenced.
An initial pretest should be conducted with both the researcher and respondent present. By conducting the pretest through a personal interview, the researcher can discuss any design flaws or points of confusion with the respondent. Next, the pretest should be conducted using the planned method of administration. In other words, if the survey is being conducted over the phone, the pretest should be conducted over the phone.
The number and nature of the respondents should also be considered when conducting a pretest. The sample for the pretest should mirror the target population for the study, although it may be useful to have other experienced researchers examine the questionnaire before full-scale data collection takes place. The number of people to pretest depends on time and cost considerations. Although pretests slow down the research process, they are invaluable in discovering problems that would otherwise make the data collected meaningless.
After the data collection instrument has been designed, the research process turns to selecting an appropriate sample. A sample is a subset of the population of interest from which data are gathered that will estimate some characteristic of the population. Securing a quality sample for sports marketing research is critical. Researchers rarely have the time or money to communicate with everyone in the population of interest. As such, developing a sample that is representative of this larger group of consumers is required.
To design an effective and efficient sample, a variety of sampling techniques are available. Sampling techniques are commonly divided into two categories: nonprobability sampling and probability sampling. The primary characteristic of nonprobability sampling techniques is that the sample units are chosen subjectively by the researcher. As such, there is no way of ensuring whether the sample is representative of the population of interest. Probability sampling techniques are objective procedures in which sample units have a known and nonzero chance of being selected for the study. Generally, probability sampling techniques are considered stronger because the accuracy of the sample results can be estimated with respect to the population.
Nonprobability sampling
The three nonprobability sampling techniques commonly used are convenience, judgment, and quota sampling. Convenience sampling techniques are also called accidental sampling because the sample units are chosen based on the “convenience” of the researcher. For example, a research project could be conducted to assess fans’ attitudes toward high school soccer in a large metropolitan area. Questionnaires could be handed out to fans attending Friday night games at three different high schools. These individuals are easy to reach but may not be representative of the population of interest (i.e., high school fans in the area).
Other researchers may approach the same problem with a different data collection method. For example, three focus groups might be conducted to gain a better understanding of the fans’ attitudes toward high school soccer. Using this scenario, long-time, loyal soccer fans might be chosen as participants in the three focus groups. These participants represent a judgment sample because they are chosen subjectively and, based on the judgment of the researcher, they best serve the purpose of the study.
A quota sampling technique may also be used to address the research problem. In quota sampling, units are chosen on the basis of some control characteristic or characteristics of interest to the researcher. For instance, control characteristics such as gender and year in school may be appropriate for the soccer study. In this case, the researcher may believe there may be important distinctions between male and female fans and between freshmen and seniors. The sample would then be chosen to capture the desired number of consumers based on these characteristics. Often, the numbers are chosen so that the percentage of each sample subgroup (e.g., females and juniors) reflects the population percentages.
Probability sampling
As stated earlier, the stronger sampling techniques are known as probability sampling. In probability sampling, the sample is chosen from a list of elements called a sampling frame. For example, if students at a high school define the population of interest, the sampling frame might be the student directory. The sample would then be chosen objectively from this list of elements.
Although there are many types, a simple random sample is the most widely used probability sampling technique. Using this technique, every unit in the sampling frame has a known and equal chance of being chosen for the sample. For example, Harris Interactive (http://www.harrisinteractive.com/) e-mails a random and representative sample of the U.S. population drawn from a database of more than 6.5 million respondents who have agreed to cooperate. Respondents who agree to participate are directed to the appropriate URL for each survey. The Internet-based methodology allows Harris to randomly sample a minimum of 10,000 people each month on various topics of interest to decision makers in the sports and entertainment industry. A probability sampling technique, such as simple random sampling, allows the researcher to calculate the degree of sampling error, so the researcher knows how precisely the sample reflects the true population.
Sample size
Another question that must be addressed when choosing a sample is the number of units to include in it, or the sample size. Practically speaking, sample sizes are determined largely on the basis of time and money. The more precise and confident the researchers want to be in their findings, the greater the necessary sample size. Another important determinant in sample size is the homogeneity of the population of interest. In other words, how different or similar are the respondents? To illustrate the effect of homogeneity on sample size, suppose the RailCats are interested in determining the average income of their season ticket holders. If the population of interest includes all the season ticket holders and each person has an income of $50,000, then how many people would we need to have a representative sample? The answer, because of this totally homogeneous population, is one. Any one person that would be in our sample would give us the true income of RailCats’ season ticket holders. As you can see from this brief discussion, sample size determination is a complex process based on confidence, precision, and the nature of the population of interest, time, and money. Larger samples tend to be more accurate than smaller ones, but researchers must treat every research project as a unique case that has an optimal sample size based on the purpose of the study.
After the data are collected from the population of interest, data analysis takes place. Before any analytical work occurs, the data must be carefully scrutinized to ensure its quality. Researchers call this the editing process. During this process, the data are examined for impossible responses, missing responses, or any other abnormalities that would render the data useless.
Once the quality of the data is ensured, coding begins. Coding refers to assigning numerical values or codes to represent a specific response to a specific question. Consider the following question:
How likely are you to attend a RailCats’ game in 20XX?
1. Extremely unlikely
2. Unlikely
3. Neither unlikely nor likely
4. Likely
5. Extremely likely
The response of extremely unlikely is assigned a code of 1, unlikely a code of 2, and so on. Each question in the survey must be coded to facilitate data analysis.
After editing and coding are completed, you are ready to begin analyzing the data. Although there are many sophisticated statistical techniques (and software programs) to choose from to analyze the data, researchers usually like to start by “looking at the big picture.” In other words, researchers want to describe and summarize the data before they begin to look for more complex relationships between questions.
Often, the first step in data analysis is to examine two of the most basic informational components of the data – central tendency and dispersion. Measures of central tendency (also known as the mean, median, and mode) tell us about the typical response, whereas measures of dispersion (range, variance, and standard deviation) refer to the similarity of responses to any given question.
To give us a good feel for the typical responses and variation in responses, frequency distributions are often constructed. A frequency distribution, such as the one shown in Table 3.7, provides the distribution of data pertaining to categories of a single variable. In other words, frequency distributions or one-way tables show us the number (or frequency) of cases from the entire sample that fall into each response category. Normally, these frequencies or counts are also converted into percentages.
After one-way tables or frequency distributions are constructed, the next step in data analysis involves examining relationships between two variables. A cross-tabulation allows us to look at the responses to one question in relation to the responses to another question. Two-way tables provide a preliminary look at the association between two questions. For example, the two-way table shown in Table 3.8 explores the relationship between the likelihood of going to RailCats’ games and gender. Upon examination, the two-way table clearly shows that females are less likely to attend RailCats’ games in the future than males. Implications of this finding may include the need to conduct future research to better understand why females are less likely to attend RailCats’ games than males and the design of a marketing mix that appeals to females.
Table 3.7 Frequency distribution or one-way table
How likely are you to attend a RailCats’ game in 20XX? |
||
Respondents |
||
Number |
Percent |
|
1. Extremely unlikely |
88 |
9.1 |
2. Unlikely |
60 |
6.2 |
3. Neither unlikely or likely |
336 |
34.6 |
4. Likely |
201 |
20.7 |
5. Extremely likely |
169 |
17.4 |
NA |
118 |
12.0 |
Total |
972 |
100.00 |
Table 3.8 Two-way table of cross-tabulation
How likely are you to attend a RailCats’ game in 20XX? |
||
Gender |
||
Male |
Female |
|
1. Extremely unlikely |
35 |
53 |
2. Unlikely |
28 |
32 |
3. Neither unlikely or likely |
178 |
158 |
4. Likely |
111 |
90 |
5. Extremely likely |
101 |
68 |
NA |
56 |
62 |
Total |
509 |
463 |
The last step in the marketing research process is preparing a final report. Typically, the report is intended for top management of the sports organization, who can either put the research findings into action or shelve the project. Unfortunately, the greatest research project in the world will be viewed as a failure if the results are not clearly communicated to the target audience.
How can you prepare a final report that will assist in making decisions throughout the strategic marketing process? Here are some simple guidelines for preparing an actionable report:
![]() Know your audience – Before preparing the oral or written report, determine your audience. Typically, the users of research will be upper management, who do not possess a great deal of statistical knowledge or marketing research expertise. Therefore, it is important to construct the report so it is easily understood by the audience who will use the report, not by other researchers. One of the greatest challenges in preparing a research report is presenting technical information in a way that is easily understood by all users.
Know your audience – Before preparing the oral or written report, determine your audience. Typically, the users of research will be upper management, who do not possess a great deal of statistical knowledge or marketing research expertise. Therefore, it is important to construct the report so it is easily understood by the audience who will use the report, not by other researchers. One of the greatest challenges in preparing a research report is presenting technical information in a way that is easily understood by all users.
![]() Be thorough, not overwhelming – By the time they are completed, some written research reports resemble volumes of the Encyclopedia Britannica. Likewise, oral presentations can drag on for so long that any meaningful information is lost. Researchers should be sensitive to the amount of information they convey in an oral research report. Oral presentations should show only the most critical findings, rather than every small detail. Generally, written reports should include a brief description of the background and objectives of the study, how the study was conducted (methodology), key findings, and marketing recommendations. Voluminous tables should be located in an appendix.
Be thorough, not overwhelming – By the time they are completed, some written research reports resemble volumes of the Encyclopedia Britannica. Likewise, oral presentations can drag on for so long that any meaningful information is lost. Researchers should be sensitive to the amount of information they convey in an oral research report. Oral presentations should show only the most critical findings, rather than every small detail. Generally, written reports should include a brief description of the background and objectives of the study, how the study was conducted (methodology), key findings, and marketing recommendations. Voluminous tables should be located in an appendix.
![]() Carefully interpret the findings – The results of the study and how it was conducted are important, but nothing is as critical as drawing conclusions from the data. Managers who use the research findings often have limited time and no inclination to carefully analyze and interpret the findings. In addition, managers are not only interested in the findings alone, but they also want to know what marketing actions can be taken based on the findings. Be sure you do not neglect the implications of the research when preparing both oral and written reports.
Carefully interpret the findings – The results of the study and how it was conducted are important, but nothing is as critical as drawing conclusions from the data. Managers who use the research findings often have limited time and no inclination to carefully analyze and interpret the findings. In addition, managers are not only interested in the findings alone, but they also want to know what marketing actions can be taken based on the findings. Be sure you do not neglect the implications of the research when preparing both oral and written reports.
Survey shows split on racial opportunity
Twenty-five years after Martin Luther King Jr.’s life was first honored with a national holiday and nearly 50 years after the civil rights leader’s “I Have a Dream” speech, black and white sports fans alike view the sports world as far more racially progressive and unifying than the rest of society, according to a recent online survey conducted for ESPN.
However, there remains a strong racial divide among those fans about the extent to which African-Americans enjoy equal opportunities in sports, as well as about the degrees of prejudice and discrimination that continue to pervade the sports landscape.
Eighty-two percent of those surveyed believe that sports provide equal opportunities for African-Americans, compared with 55 percent who think the same is true in all other sectors of society. Of those surveyed, 73 percent give a very high rating to the sports world in terms of equal opportunities, in contrast to only 19 percent who give a very high rating to the corporate world.
As well, 72 percent believe sports do more to unite people across racial lines, while only 6 percent think sports do more to divide race relations.
However, African-Americans surveyed are less convinced than whites about the extent of the progress in the sports world. Only 36 percent of blacks – compared with 65 percent of whites – give sports high marks on the question of whether African-Americans have equal opportunities to succeed.
Most African-Americans surveyed say blacks have fewer opportunities than whites to become owners of professional sports franchises (71 percent); athletic directors at major, Division I universities (72 percent); major league baseball managers (64 percent); NFL head coaches (62 percent); or head coaches at major Division I schools (58 percent). A majority of white sports fans believe African-Americans have equal opportunities.
Charlotte Bobcats owner Michael Jordan is the only black majority owner in the four major professional sports, according to the University of Central Florida’s Institute for Diversity and Ethics in Sports. Jordan bought the team from another African-American, Robert Johnson, and those two constitute the only black majority owners in the history of the four major sports.
Nevertheless, only 47 percent of white sports fans surveyed think blacks have fewer opportunities to be owners, and 44 percent believe that blacks have the same opportunities.
The online survey of 1,822 sports fans (1,213 whites, 435 African-Americans) was conducted Dec. 15 – Dec. 21 by Hart Research Associates.
An ESPN survey of coaching salaries by race indicates disparities remain. At the start of the 2010 NFL season, six out of 32 coaches were black, and the average annual salary for those coaches was $3.1 million, compared with $4.1 million for white coaches. Of the 120 major Division I college football programs, there were only 14 black coaches (and one Hispanic coach) at the start of this past season; the average annual salary for those African-American coaches was $1 million, while white coaches averaged $1.4 million.
The surveyed fans also were somewhat divided on their views about the need for the NFL’s Rooney Rule, which requires consideration of minority candidates for head coaching and senior football operations positions. Of black fans polled, 57 percent believe the rule will be needed for years to come, compared with only 20 percent of white fans. Twenty-three percent of white fans indicate the rule was never needed in the first place, while only 7 percent of African-Americans feel it is unnecessary.
In conjunction with the 25th anniversary of the Martin Luther King holiday, ESPN also surveyed 100 African-American athletes about their views of the black athlete in 2010. The athletes were promised anonymity to encourage freer responses to a series of 10 questions.
“Wow, it’s an honor to take this survey,” said one NFL Pro Bowl player. “MLK had a huge impact on me as a kid – even though I was born a few years after he died. That’s legacy, man.”
“What sets Jordan apart is he’s done so much more than basketball. Even the whole baseball attempt was inspiring to me. I remember thinking, ‘He’s the best basketball player ever, and he’s walking away to try baseball just because he wants to test himself? Maybe I need to think more like that.’”
– MLB player on Michael Jordan
Asked to name the retired black athlete they could most imagine being president in 2024, the athletes’ top choice was Michael Jordan, garnering 17.5 percent of votes.
“What sets Jordan apart is he’s done so much more than basketball,” said an MLB player. “Even the whole baseball attempt was inspiring to me. I remember thinking, ‘He’s the best basketball player ever, and he’s walking away to try basketball just because he wants to test himself? Maybe I need to think more like that.’”
The NBA swept the top five among potential presidents, with Jordan followed by current Laker Derek Fisher and former Laker Magic Johnson (each at 12.4 percent); former Phoenix Suns great Kevin Johnson (6.2), now the mayor of Sacramento; and former Spurs superstar David Robinson (5.2).
Jackie Robinson (62.5 percent) was the top vote-getter when the athletes were asked to name the most important black athlete ever, followed by Muhammad Ali (57.3) and Jordan (54.2).
The athletes surveyed resoundingly (81 percent) believe African-American athletes need to take a more active role in the black community.
“You need more black athletes doing more positive things,” said a world champion boxer. “A lot of people in the ghetto, in poor neighborhoods like where I grew up, don’t believe there’s life outside of the city, outside what they know. We need to be in there showing them, telling them, that there is.”
Asked to identify who was the most color-blind among fans, coaches, owners and media, more than half the athletes (53.4 percent) selected coaches, followed by fans (21.8), owners (14.4) and media (10.4).
“When it’s all said and done, the color that counts the most is green,” said one NFL linebacker.
The athletes’ answers reflected a level of suspicion regarding the media. When asked to rank five athletes by how the media treated them (1 being the kindest; 5 being the worst), the survey revealed the African-American athletes believe Steelers quarterback Ben Roethlisberger (1.6) was handled with kid gloves compared with Eagles quarterback Michael Vick (4.8). Roethlisberger was accused of sexually assaulting a 20-year-old woman, and he ultimately was given a four-game suspension by the NFL although no charges were filed against him. Vick served 21 months in prison for his role in a dogfighting ring.
Other players named in the question were pitching great Roger Clemens (2.3), who faces charges of lying before Congress when he denied steroid use; NFL wide receiver Plaxico Burress (3.5), who is currently serving a two-year prison sentence stemming from gun charges after he accidentally shot himself at a New York nightclub; and seven-time National League Most Valuable Player Barry Bonds (3.6), who is set to stand trial in March on perjury charges related to his grand jury testimony in the BALCO steroids case.
“All of those guys got raked pretty bad. But what happened to Vick wasn’t right, especially compared with how the other guys on that list were treated.”
– Champion boxer on Michael Vick
“All of those guys got raked pretty bad,” said a champion boxer. “But what happened to Vick wasn’t right, especially compared with how the other guys on that list were treated.”
African-American sports fans who took part in the online survey also indicated the media had been biased in its treatment of black athletes. By a margin of 57 percent to 7 percent, the African-Americans surveyed say the media unfairly criticizes black athletes more than white athletes, while the white fans suggest there is no difference in the media’s handling of various cases.
Of black sports fans surveyed, 65 percent say they admire Vick, compared with just 25 percent of the white fans. Black fans surveyed actually also seem more forgiving of Roethlisberger, with 30 percent expressing admiration, compared with just 22 percent of white fans. Asked for their views on 17 different sports figures – from NFL quarterback Tom Brady to race car driver Danica Patrick, from golfer Tiger Woods to NFL wide receiver Terrell Owens – fans overwhelmingly name Jordan as the figure they most admire (67 percent). Owens is last (18 percent), although 35 percent of black fans surveyed say they admired him, compared with just 14 percent of whites.
Provided a list of seven facts about African-Americans in sports today, sports fans of both races say they are most concerned that the graduation rate for black student-athletes is 53 percent compared with 63 percent for white student-athletes. The fan survey also touched upon the often-taboo notion of whether African-Americans are athletically superior to whites. Across the board, blacks and whites indicate they believe blacks are superior runners, have greater jumping and leaping ability, and possess more natural athletic ability than whites. In fact, 66 percent of the African-American fans surveyed associate fast runners more with black athletes than white, and 61 percent associate natural athletic ability more with blacks than whites. A very small percentage of blacks and whites associate superior athletic ability with white athletes.
The NFL is far and away the most popular sport among all fans surveyed, with Major League Baseball a distant second, followed by college football. Among black fans specifically, the NBA ranks second, followed by college football, college basketball and then MLB. Asked to rank a series of breakthrough sports moments involving African-Americans, black fans view as most significant Tony Dungy and Lovie Smith being the first African-American head coaches to reach the Super Bowl, with Dungy being the first black coach to win the title. Ranking second among blacks is Serena Williams becoming the first African-American woman to win a career grand slam in tennis. Overall, the black and white fans surveyed view Jordan becoming the first former NBA player to become the majority owner of an NBA franchise as the sports event that demonstrates the most progress in achieving King’s dream of a society that provides equal opportunities for all races.
More than twice as many of the surveyed fans (32 percent to 13 percent) say the dream has been reached in sports compared with those who say it has been reached by the country as a whole. Again, though, black fans are far less convinced than whites: Regarding society in general, just 6 percent of African-Americans believe the country has fulfilled the dream, compared with 15 percent of whites; and in sports, 14 percent of the black fans indicate equality has been achieved, while 37 percent of whites think the dream has been realized.
Source: Mark Fainaru-Wada, 2011, “Survey Shows Split on Racial Opportunity,” ESPN, January 11. Rightsholder: ESPN; http://sports.espn.go.com/espn/otl/news/story?id=6006813. Originally published in The Good Men Project.
Chapter 3 focuses on the tools used to gather information to make intelligent decisions throughout the strategic sports marketing process. More specifically, the chapter describes the marketing research process in detail. Marketing research is defined as the systematic process of collecting, analyzing, and reporting information to enhance decision making throughout the strategic sports marketing process.
The marketing research process consists of seven interrelated steps. These steps include defining the problem; choosing the research design type; identifying data collection methods; designing data collection forms; designing the sample; collecting, analyzing, and interpreting data; and preparing the research report. The first step is defining the problem and determining what information will be needed to make strategic marketing decisions. The tangible outcome of problem definition is to develop a set of research objectives that will serve as a guide for the rest of the research process.
The next step in the marketing research process is to determine the appropriate research design type(s). The research design is the plan that directs data collection and analysis. The three common research design types are exploratory, descriptive, and causal. The choice of one (or more) of these design types for any study is based on the clarity of the problem. Exploratory designs are more appropriate for ill-defined problems, whereas causal designs are employed for well-defined research problems.
After the research design type is chosen, the data collection method(s) is selected. Once again, decisions regarding data collection are contingent upon the choice of research design. Data collection consists of two types – secondary and primary. Secondary data refers to data that were collected earlier, either within or outside the sports organization, but still provide useful information to the researcher. Typically, sources of secondary data include government reports and documents; trade and industry associations; standardized sports marketing information studies; and books, journals, and periodicals. Primary data are information that is collected specifically for the research question at hand. Common types of primary data collection techniques include, but are not limited to, in-depth interviews, focus groups, surveys, and experiments.
The fourth step in the research process is to design the data collection instrument. Regardless of whether you are collecting data by in-depth interviews, focus groups, or surveys, data collection instruments are necessary. The most widely used data collection technique in sports marketing research is the questionnaire. As such, it is important that sports marketing researchers understand how to construct a questionnaire properly. The steps for questionnaire design include specifying information requirements, deciding the method of administration (i.e., mail, phone, and stadium interview), determining the content of questions, determining the form of response for questions, deciding on the exact wording of the questions, designing the order of the questions, designing the physical characteristics of the questionnaire, pretesting the questionnaire, and modifying it according to pretest results.
Once the data collection forms are constructed, the next step in the research process is choosing a sampling strategy. Rarely, if ever, can we take a census where we communicate with or observe everyone of interest to us in a research study. As such, a subset of those individuals is chosen to represent the larger group of interest. Sampling strategy identifies how we will choose these individuals and how many people we will choose to participate in our study.
Data analysis is the next step in the marketing research process. Before the data can be analyzed, however, they must be edited and coded. The editing process ensures the data being used for analysis are of high quality. In other words, it makes sure that there are no problems, such as large amounts of missing data or errors in data entry. Next, coding takes place. Coding refers to assigning numerical values to represent specific responses to specific questions. Once the data are edited and coded, data analysis is conducted. The method of data analysis depends on a variety of factors, such as how to address the research objectives. The last step in the marketing research process is to prepare a final report. Oral and written reports typically discuss the objectives of the study, how the study was conducted, and the findings and recommendation for decision makers.
This ESPN study clearly shows that there are major differences between how white fans and black fans view white and black athletes. According to the statistics, white fans appear to have far less interest in cheering on black athletes than they do athletes of their own skin color – but is this assumption really accurate? One thing that jumped out to Dr. Christopher Stankovich, founder of Advance Human Performance Systems, when looking over this report was the fact that black fans didn’t dislike any black athletes, something that would certainly catch the attention of savvy researchers. Dr. Stankovich identified that the generalizability of these data may be compromised, therefore for discussion identifies how these data may be compromised and what limitations, if any, may be associated with the study? Also, identify how these data may be used by sport marketing professionals to enhance functions of the SSMP?
![]() concomitant variation
concomitant variation
![]() convenience sampling techniques
convenience sampling techniques
![]() cross-sectional studies
cross-sectional studies
![]() data collection techniques
data collection techniques
![]() dependent variable
dependent variable
![]() experimentation
experimentation
![]() focus group
focus group
![]() independent variable
independent variable
![]() judgment sample
judgment sample
![]() longitudinal study
longitudinal study
![]() marketing research
marketing research
![]() methodology
methodology
![]() nonprobability sampling
nonprobability sampling
![]() pretest
pretest
![]() primary data
primary data
![]() probability sampling
probability sampling
![]() problem definition
problem definition
![]() projective techniques
projective techniques
![]() questionnaire design
questionnaire design
![]() quota sampling
quota sampling
![]() research design
research design
![]() research objectives
research objectives
![]() research problem statement
research problem statement
![]() research proposal
research proposal
![]() sample
sample
![]() secondary data
secondary data
![]() simulated test market
simulated test market
![]() sports marketing research
sports marketing research
![]() test marketing
test marketing
1. Define sports marketing research. Describe the relationship between sports marketing research and the strategic marketing process.
2. What are the various steps in the marketing research process?
3. Define problem and opportunity definition and explain why this step of the research process is considered to be the most critical.
4. What are some of the basic issues that should be addressed at a research request meeting?
5. Outline the steps in developing a research proposal.
6. Define a research design. What are the three types of research designs that can be used in research? How does the choice of research design stem from the problem definition? Can a researcher choose multiple designs within a single study?
7. Describe some of the common data collection techniques used in sports marketing research. How does the choice of data collection technique stem from the research design type?
8. What are some of the central issues that must be considered when conducting focus groups?
9. What are the pros and cons of laboratory studies versus field studies?
10. Outline the nine steps in questionnaire design. What are some of the most common errors in the wording of questions?
11. Define nonprobability sampling and probability sampling techniques. What are three types of nonprobability sampling?
12. What is a sampling frame? How do researchers decide on the appropriate sample size for a study?
13. What are some of the guidelines for preparing oral and written research reports?
You are interested in purchasing a new minor league baseball franchise. The franchise will be located in your area. To reduce the risk in your decision making, you have requested that a sports marketing firm submit a detailed research proposal. The following questions pertain to this issue:
1. What is the broad problem/opportunity facing you in this decision? Write the research objectives based on the problem formulation.
2. What type of research design type do you recommend?
3. The sports marketing firm has submitted the following preliminary questionnaire. Please provide a detailed critique of their work. Age: _______________ Gender: ____________ Are you likely to go to a baseball game at the new stadium? Yes ___ No ___ How many minor league games did you go to last year? 0–3 _____ 4–6 _____ 6–9 ____ 10+ ______ What types of promos would you like to see? Beer Night ______ Straight-A Night Polka _____ Night _____
4. Now that you have looked at their survey, create a questionnaire of your own. Would any other data collection techniques be appropriate, given the research problem?
5. What sampling technique(s) do you recommend? How is the correct sample size determined, given your choice of sampling technique?
1. Using secondary data sources on the Internet, find the following and indicate the appropriate URL (Internet address):
a. Number of women who participated in high school basketball last year
b. Attendance at NFL games last year
c. Sponsors for the New York City Marathon
d. Universities that offer graduate programs in sports marketing.
2. Using the Internet, find at least five articles that relate to the marketing of NASCAR.
3. Using the Internet, locate three companies that conduct sports marketing research. What types of products and services do the companies offer?
1 NASCAR Sponsorship Study, “Sponsorship Research and Strategies.” Available from: http://sponsorstrategy.com/_wsn/page9.html.
2 Gilbert Churchill, Basic Marketing Research, 3rd ed. (Ft. Worth, TX: Dryden Press, 1996).
3 Ibid.
4 Kristie McCook, Douglas Turco, and Roger Riley, “A Look at the Corporate Sponsorship Decision Making Process,” Cyber-Journal of Sport Marketing, vol. 1, no. 2 (1997). Available from: http://fulltext.ausport.gov.au/fulltext/1997/cjsm/v1n2/mcook.htm.
5 Jay Weiner, “New Focus Group Report, Showing Surprising Openness to Sales Tax, Could be Key to Vikings Stadium Effort” (May 4, 2010). Available from: http://www.minnpost.com/politics-policy/2010/05/new-focus-group-report-showing-surprising-openness-sales-tax-could-be-key-vi.
6 Mike Sielski, “After Losing Season, Mets Slash Ticket Prices” (November 4, 2010). Available from: http://online.wsj.com/news/articles/SB10001424052748703506904575592780665674228.
7 Gilbert Churchill, Basic Marketing Research, 3rd ed (Fort Worth, TX: Dryden Press, 1996).
8 “Cleveland Indians Look to Long-Term Viability through Market Research,” Akron Beacon Journal (April 16, 1999).
9 Tripp Mickle, “Drivers Should Take a Spin Online, Study Shows,” Sports Business Journal (November 5, 2012).
10 “ESPN 3D to Show Soccer, Football, More.” Available from: www.ESPN.com (January 5, 2010).
11 Jason Dachman, “ESPN to discontinue ESPN 3D by Year’s End.” Available from: www.sportsvideo.org/main/blog/2013/06/breaking-news-espn-to-discontinue-3d-network/.
12 Craig Mertz, “Pro Lacrosse League to Test Local Support,” The Columbus Dispatch (July 7, 2000), 5D.