
Understanding the social network
Abstract
As we discussed in previous chapters, there is an important assumption made on the maximum likelihood estimation (MLE) model about sources: it is assumed the sources independently report their observations. However, this assumption usually does not hold in various kinds of real world social sensing applications, especially when human are seen as data sources (i.e., sensors) who are actually connected through the social network. What makes this problem formulation different from the one we reviewed in previous chapters is that, in the case of human sources, not only is the reliability of sources usually unknown but also the original data provenance may be uncertain. Individuals may report observations made by others as their own. In this chapter, we review a model that considers the impact of such information sharing on the analytical foundations of social-aware reliable sensing and generalizes the MLE model we reviewed before to explicitly address the source dependency problem.
8.1 Information Propagation Cascades
With the advent of online social networks, humans are able to volunteer free observations about the physical world at scale, as well as communicate and share their observations with each other in a prompt and efficient way. As individuals choose to propagate information, their observations spread through the underlying social networks that connect them. We call such information spread on social networks information propagation cascades as the propagated information will eventually reach a larger population in a similar way as epidemic cascades (ECs) [117]. Information cascades happen naturally within social networks (e.g., Twitter) where individuals are given the option to forward messages or follow behaviors of other people in the network. The properties of information propagation cascades have been well studied in different types of online social networks such as Twitter [118], Facebook [119], Flickr [120], Digg [121], and YouTube [122].
In this chapter, we review the work that address two important problems: (i) How will the information propagation cascades on social network affect the performance of the social sensing model discussed in the previous chapters? (ii) How to further generalize the basic maximum likelihood estimation (MLE) model to consider the information propagation properties? Twitter is a good platform to study the information propagation cascades, especially during the process of natural disasters and emergency events where a lot of warnings, news, and rumors are generated and propagated on Twitter [123]. In particular, Twitter allows users to send short messages through various devices and broadcasts messages to a large population. In particular, Twitter has the option that allows users to follow each other. When a user posts a tweet, that tweet is immediately visible to all of his/her followers. Twitter also has the function called Retweet, which allows users to easily forward tweets from other users. Follower-followee relationship and the Retweet function make it easy and fast for the information propagation cascades to occur on Twitter.
The reader must be cautioned that social networks carry a lot of extraneous information as well, such as subjective opinions (e.g., “It is an inspiring day!”) and personal emotions (e.g., “I am depressed”). These are not the topic of this chapter. Instead, we are interested in objective claims in social sensing that describe external physical state. In the aftermath of important events, many microblog entries offer physical descriptions of the event (e.g., “Shooting erupts on Liberty Square!”). Such reporting is an act of sensing of the physical environment that is external to the human observers. In this case, the physical environment has a unique state, leading to a unique ground truth, according to which these descriptions are either true or false (e.g., either there was shooting on Liberty Square or not). It is this category of claims about the physical environment that this chapter is concerned with. The reviewed work has developed tools to collect such claims from online social media in large-scale disaster and unrest events [124].
8.2 A Binary Model of Human Sensing
In this section, we review a model that takes humans as sources of (i) unknown reliability, generating (ii) binary observations of (iii) uncertain provenance [105]. Of these three features, the first is perhaps the most intuitive. Unlike physical sensors whose characteristics, calibration, and failure modes are known, we do not, in general, know the reliability of human observers and hence cannot assume it in the problem formulation. In the following subsections, we explain the remaining two model features; namely, binary observations and uncertain provenance.
8.2.1 A Binary Sensor Model
From a sensor modeling perspective, an obvious difference between physical sensors and human observations is one of functional specialization versus breadth. Humans, are much broader in what they can observe, albeit less accurate. Table 8.1 gives examples of actual observations made on Twitter.
Table 8.1
Examples of Twitter Observations
Crash blocking lanes on I-5S @ McBean Pkwy in Santa Clarita
BREAKING NEWS: Shots fired in Watertown; source says Boston Marathon terror bomb suspect has been pinned down
The police chief of Afghanistan’s southern Kandahar province has died in a suicide attack on his headquarters.
Yonkers mayor has lifted his gas rationing order. Fill it up!
Such observations can be thought of as measurements of different binary variables. They are binary because the observation reported can either be true or false. In a system featuring a collaboration of sensors and humans, it is therefore meaningful to collect from humans these binary states. On the other hand, sensors provide continuous values that can be used to infer some state of the work (e.g., the room is occupied since the room temperature is 72.2 degrees). This has been the practice in participatory sensing, where participants were asked to make binary observations, such as “there is garbage here”; whereas sensors, such as GPS, would provide the corresponding continuous variable (e.g., location).
With the above in mind, the reviewed work focuses on a binary observation model, common to geotagging applications. Generalizing from participatory sensing, each human reports an arbitrary number of observations, which refer to as claims, that can be individually either true or false. Different individuals have different reliability, expressed as the probability of producing true claims. In this model, the physical world is just a collection of mention-worthy facts. For example, “Main Street is flooded,” “The BP gas station on University Ave. is out of gas,” or “Police are shooting people on Market Square.” Human observers report some of the facts they observe (e.g., on Twitter). The problem of reliable sensing is to infer which of the reported human observations match ground truth in the physical world.
8.2.2 Uncertain Provenance
A feature that lends novelty to the human sensor model, is the notion of uncertain data provenance. Namely, it is not unusual for a person to report observations they received from others as if they were his/her own. Such rumor spreading behavior has no analogy in correctly functioning physical sensors. We call this problem one of uncertain data provenance because when Bob tweets that “Main Street is flooded,” even if we authenticate Bob as the actual source of the tweet, we do not know if Bob truly observed the event first-hand or heard it from another source such as Sally. From a sensing perspective, this means that errors in “measurements” across “sensors” may be non-independent, as one erroneous observation may be propagated by other sources without being verified.
8.2.3 A Word on Simplicity
In the interest of initial progress, the model discussed in this chapter is purposely simple to promote applicability in many different contextual situations. The reader will legitimately find several key ways this simplified model can be extended. One can think of the method presented in this chapter as offering a performance baseline against which such future potential enhancements can be benchmarked. Clearly, the performance of the baseline sheds light on the utility of such enhancements. To emphasize its simplicity, we call the reviewed baseline model the binary model of human sensing and show in evaluation review section that the resulting ground truth reconstruction algorithm does very well.
8.3 Inferring the Social Network
In this section, we discuss possible methods that can be used to infer the social network with a focus on Twitter. In order to have a holistic view of the entire system, we put such discussion in the context of the solution architecture. To enable reconstruction of ground truth information from data reported by human sources, a solution needs to (i) collect data from the “humans as a sensor network,” (ii) structure the data for analysis, (iii) understand how sources are related, and (iv) use this collective information to estimate the probability of correctness of individual observations. These steps are described in the following subsections, respectively. The reviewed solution focused on Twitter as the underlying “humans as a sensor network.”
8.3.1 Data Collection
The solution performs data collection using Apollo, a data distillation tool built for social sensing applications [125]. In principle, Apollo can collect data from different participatory sensing front end, such as a online social media and smartphone applications. In the reviewed work, Apollo was used to collect data from Twitter. Tweets are collected through a long-standing query via the exported Twitter API to match given query terms (keywords) and an indicated geographic region on a map. These overall query can either be a conjunction or disjunction of the keyword and location terms. In essence, Apollo acts as the “base station” for a participatory sensing network, where the query defines the scope of information collected from participants.
8.3.2 Computing the Source-Claim Graph
Next, the solution determines the internal consistency in reported observations. For this reason, observations are clustered based on a distance function. This function, distance (t1,t2), takes two reported observations, t1 and t2, as input and returns a measure of similarity between them, represented by a logical distance. The more dissimilar the observations, the larger the distance. In the case of data collection from Twitter, the solution regarded individual tweets as individual observations, and borrowed from natural language processing literature a simple cosine similarity function [110] that returns a measure of similarity based on the number of matching tokens in the two inputs. The distance function nicely separates natural language processing concerns from sensing concerns.
As distances are computed, the set of input observations is transformed to a graph where vertices are individual observations and links represent similarity among them. Then the graph is clustered, causing similar observations to be clustered together. Note that clustering is an important step that significantly improves the scalability and quality of the process. In a real-world human sensing application, sources will typically report slightly different observations, even when they measure the same variable or observe the same event. This results in a large number of (slightly different) individual claims and a large, poorly-connected, source-claim network, which has at least two negative consequences. First, it impairs scalability of the human sensing (and increases its convergence time). Second, it lowers the quality of outputs because similar claims are treated separately and cannot get the credibility boost they would have enjoyed had they been considered together. Clustering of similar claims alleviates the above problems. It results in smaller well-connected source-claim networks in which joint estimation of source and claim correctness converges rapidly and the outcome becomes more accurate. One limitation of the reviewed work is that it has not applied more advanced natural language processing techniques in the clustering function (e.g., it does not account for sentiment analysis). This is partly because of the difficulty of applying those NLP techniques in short text messages (e.g., tweets) that are lack of context information. In the future, the authors plan to explore the possibility of using some deep NLP or semantic analysis techniques to further improve the performance of the clustering component.
The output of the clustering algorithm is a graph of individual sources and claim clusters (we call consolidated claims). In such graph, each source, Si, is connected to all claims they made (i.e., clusters they contributed to), and each claim, Cj, is connected to all sources who espoused it (i.e., all sources of tweets in the corresponding cluster). We say that SiCj = 1 if source Si makes claim Cj. Each claim can either be true or false. The claim is true if it is consistent with ground truth in the physical world. Otherwise, it is false. The source-claim graph constitutes an input to our analysis algorithm.
8.3.3 Inferring the Social Network
Next, the solution infers the social network to account for uncertain data provenance. Sources may have reported either their own observations or observations they heard from others. It is assumed there exists a latent social network represented by an information dissemination graph, SD, that estimates how information might propagate from one person to another. A recent Sigmetrics paper [117] describes an algorithm to infer the latent contagion network underlying ECs, given the time when each node got infected. For the current work, an EC social graph was constructed using the iterative greedy strategy described in the Sigmetrics paper, where each distinct observation is modeled as a cascade and the time of contagion of a source describes when the source mentioned this observation. The resulting graph is called the EC network. Specific to Twitter, three other ways were also used to estimate potential information dissemination among sources. The first is to construct this graph based on the follower-followee relationship. A directed link (Si, Sk) exists in the social graph from source Si to source Sk if Sk is a follower of Si. This graph is called the FF network. The second option is to construct the social network from the retweeting (RT) behavior of twitter users. In this case, a directed link (Si,Sk) exists in the social graph if source Sk retweets some tweets from source Si. This graph is called the RT network. The third option combines the above two, forming a network where a directed link (Si, Sk) exists when either Sk follows Si or Sk retweets what Si said. The third type of social network is called the RT+FF network. Though arbitrary network can be formed, as of now, we constrain the analysis to a two-level forest (clusters) in the following sections, but will consider arbitrary networks in the future.
8.3.4 Solving the Estimation Problem
With inputs computed, the next stage is to perform the analysis that estimates correctness of claims. For each claim, Cj, Apollo determines if it is true or false. Apollo uses a sliding window approach for analyzing received tweets. Let the total number of claims computed from tweets received in the last window be N. A trivial solution would be to count the number of sources, Si, that made each claim. In other words, for each Cj, where 1 ≤ j ≤ N, count all Si, where SiCj = 1. The idea being that claims with more support are more believable. This solution is called voting, in an analogy with counting the number of votes. Unfortunately, it is suboptimal for two reasons. First, different sources have different degrees of reliability. Hence, their “votes” do not have the same weight. Second, sources may not be independent. When a source simply repeats what they heard from others, their “vote” does not add to the credibility of the claim.
Since the only information available to the model (other than the reported observations themselves) is the source claim graph, SC, and the social dissemination graph, SD, computed from the two steps above, the question becomes: Given graphs SC and SD what is the likelihood that claim Cj is true, for each j? Formally, it is given by:
where P(Cj = 1|SC,SD) is the conditional probability that Cj is true given SC and SD. With the aforementioned probability computed, Apollo forward to the user those tweets that meet a specified (user configurable) probability of correctness. This feed is the solution to the reliable sensing problem.
8.4 A Social-Aware Algorithm
It remains to show how to cast the problem of computing the probability of correctness of claims as a MLE problem when sources have unknown reliability and data has uncertain provenance. This section presents a social-aware algorithm that solves this problem. Let m be the total number of sources in the system from which we have data. Let us describe each source (i.e., “sensor”), Si, 1 ≤ i ≤ m, by two parameters; the likelihoods of true positives, ai = P(SiCj = 1|Cj = 1) and the likelihoods of false positives, bi = P(SiCj = 1|Cj = 0), neither of which are known in advance. d is denoted as the unknown expected ratio of correct claims in the system, d = P(Cj = 1). The vector θ is defined to be the vector of the above unknowns:
A MLE finds the values of the unknowns that maximize the probability of observations, SC, given the social network SD. Hence, the goal is to find θ that maximizes P(SC|SD, θ). The probability P(SC|SD,θ) depends on which claims are true and which are false. Let us therefore introduce the vector Z where element zj = 1 if Cj is true and zero otherwise. Using the total probability theorem, the expression to maximize, namely P(SC|SD, θ), can be rewritten as follows:
This problem can be solved by using the expectation maximization (EM) algorithm [93, 126]. The current work explicitly models the source dependency and uncertain data provenance in the MLE and presents an enhanced EM algorithm to address these challenges. The EM scheme starts with some initial guess for θ, say θ0 and iteratively updates it using the formula:
The above breaks down into three quantities that need to be derived:
• The log likelihood function, ![]()
• The expectation step, ![]()
• The maximization step, ![]()
Note that, the latter two steps are computed iteratively until the algorithm converges. The above functions are derived below.
8.4.1 Deriving the Likelihood
The key contribution of the social-aware EM scheme lies in incorporating the role of uncertain provenance into the MLE algorithm. To compute the log likelihood, the function P(SC,z|SD, θ) needs to be computed first. The source claim graph SC can be divided into subsets, SCj, one per claim Cj. The subset describes which sources espoused the claim and which did not. Since claims are independent, we have:
which can in turn be re-written as:

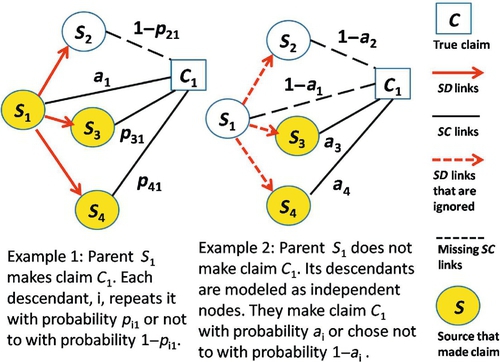
where P(SCj|SD, θ, zj) is the joint probability of all observations involving claim Cj. Unfortunately, in general, the sources that make these observations may not be independent since they may be connected in the social network leading to a possibility that one expressed the observation of another. Let pik = P(SiCj|SkCj) be the probability that source Si makes claim Cj given that his parent Sk (in the social dissemination network) makes that claim. pik is referred to as repeat ratio and can be approximately computed from graph SC, for pairs of nodes connected in graph SD, as follows:
Hence, the joint probability that a parent Sp and its children Si make the same claim is given by ![]() which is
which is ![]() . This probability accounts for the odds of one source repeating claims by another. Note that the model assumes that a child will not independent make the same claim as a parent. For illustration, let us now consider the special case of social network topology SD, where the network is given by a forest of two-level trees.* Hence, when considering claim Cj, sources can be divided into a set Mj of independent subgraphs, where a link exists in subgraph g ∈ Mj between a parent and child only if they are connected in the social network and the parent claimed Cj. The link implies source dependency as far as the claim in question is concerned. The intuition is that if the parent does not make the claim, then the children act as if they are independent sources. If the parent makes the claim, then each child repeats it with a given repeat probability. The assumed repeat probability determines the degree to which the algorithm accounts for redundant claims from dependent sources. The higher it is, the less credence is given to the dependent source. Two scenarios are illustrated by the two simple examples in Figure 8.1, showing the situation where source S1, who has children S2, S3, and S4, makes claim C1 and when it does not make it, respectively. Note the differences in the computed probabilities of its children making claim C1. In general, let Sg denote the parent of subgraph g and cg denote the set of its children, if any. Equation (8.6) can then be rewritten as follows:
. This probability accounts for the odds of one source repeating claims by another. Note that the model assumes that a child will not independent make the same claim as a parent. For illustration, let us now consider the special case of social network topology SD, where the network is given by a forest of two-level trees.* Hence, when considering claim Cj, sources can be divided into a set Mj of independent subgraphs, where a link exists in subgraph g ∈ Mj between a parent and child only if they are connected in the social network and the parent claimed Cj. The link implies source dependency as far as the claim in question is concerned. The intuition is that if the parent does not make the claim, then the children act as if they are independent sources. If the parent makes the claim, then each child repeats it with a given repeat probability. The assumed repeat probability determines the degree to which the algorithm accounts for redundant claims from dependent sources. The higher it is, the less credence is given to the dependent source. Two scenarios are illustrated by the two simple examples in Figure 8.1, showing the situation where source S1, who has children S2, S3, and S4, makes claim C1 and when it does not make it, respectively. Note the differences in the computed probabilities of its children making claim C1. In general, let Sg denote the parent of subgraph g and cg denote the set of its children, if any. Equation (8.6) can then be rewritten as follows:

where

8.4.2 Deriving the E-Step and M-Step
Given the above formulation, substitute the likelihood function defined in Equation (8.8) into the definition of Q function of EM. The Expectation step (E-step) becomes:

where Z(n, j) is the conditional probability of claim Cj to be true given the observed source claim subgraph SCj and current estimation on θ. It is given by:

where

where P(SgCj|θ(n),zj), P(SiCj|SgCj), and P(zj) are defined in Equation (8.9).
θ* (i.e., ![]() ) are chosen to maximize the Q(θ|θ(n)) function in each iteration to be the θ(n+1) of the next iteration. To get θ* that maximizes Q(θ|θ(n)), the derivatives are set to 0:
) are chosen to maximize the Q(θ|θ(n)) function in each iteration to be the θ(n+1) of the next iteration. To get θ* that maximizes Q(θ|θ(n)), the derivatives are set to 0: ![]() ,
, ![]() ,
, ![]() ,
, ![]() ,
, ![]() which yields:
which yields:

where N is the total number of claims in the source claim graph SC. Z(n,j) is defined in Equation (8.11). SJg denotes the set of claims the group parent Sg makes in SC, and ![]() denotes the set of claims Sg does not make. Similar definitions apply to the children sources in the group (i.e., SJi and
denotes the set of claims Sg does not make. Similar definitions apply to the children sources in the group (i.e., SJi and ![]() ). One should note that the computation of repeat ratios (i.e., pig ) falls out of the estimation step in the EM algorithm and the result is not dependent on previous values of θ during the iteration.
). One should note that the computation of repeat ratios (i.e., pig ) falls out of the estimation step in the EM algorithm and the result is not dependent on previous values of θ during the iteration.
Given the above, The E-step and M-step of EM optimization reduce to simply calculating Equations (8.11) and (8.12) iteratively until they converge. The convergence analysis has been done for EM scheme and it is beyond the scope of this book [108]. In practice, the algorithm will run until the difference of estimation parameter between consecutive iterations becomes insignificant. Since the claim is binary, the correctness of claims can be decided based on the converged value of Z(n,j). Specially, Cj is true if Z(n,j) ≥ 0.5 and false otherwise. We summarize the resulting algorithm in the subsection below.
8.4.3 The Social-Aware EM Algorithm
In summary of the EM scheme derived above, the input is the source claim graph SC from social sensing data and the source dissemination graph SD estimated from social network, and the output is the MLE of source reliability and claim correctness. In particular, given the source claim graph SC, the algorithm begins by initializing the parameter θ with random values between 0 and 1.† The dependent ratio of each non-independent source (i.e., pig) is also estimated from the source disseminate graph SD. The algorithm then iterates between the E-step and M-step until θ converges. Specifically, the conditional probability of a claim to be true (i.e., Z(n,j)) is computed from Equation (8.11) and the estimation parameter (i.e., θ(n+1)) from Equation (8.12). Finally, the correctness of each claim Cj can be decided based on the converged value of Z(n,j) (i.e., ![]() ). The pseudocode is shown in Algorithm 4.
). The pseudocode is shown in Algorithm 4.
8.5 Evaluation
In this section, we review the evaluation of the social-aware algorithm through three real world case studies based on Twitter. Evaluation results show the viability of predominantly correct ground truth reconstruction from social sensing data. In the evaluation, the social-aware MLE algorithm, Apollo-social, is compared to three baselines from current literature. The first baseline is voting, where data credibility is estimated by the number of times the same cluster of tweets is collected from the human network. The larger the repetition, the more credibility is attributed to the content. Considering possible retweets on Twittter, two versions of the voting scheme are considered: one that counts both retweets and original tweets as full votes (called regular Voting) and one that only counts the original tweets (called Voting-NoRT). The second baseline is the basic EM algorithm we reviewed in Chapter 5 [100]. We henceforth call it regular EM. The algorithm differs from the social-ware EM in that it assumes that all sources constitute independent observers. The regular EM was shown to outperform four current information ranking schemes. The last baseline is the social data cleaning scheme suggested in [127], which extends regular EM with admission control. The admission controller is designed to improve source independence by simply removing dependent sources using some heuristic approaches from social networks. The winning admission control scheme in [127] called Beta-1 is used.
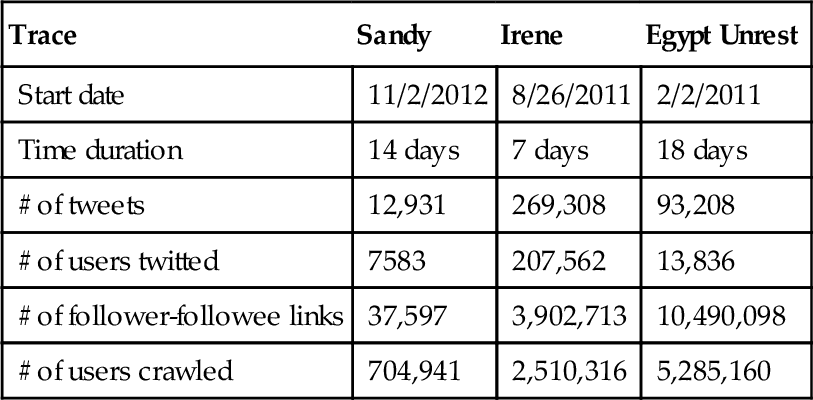
To compare these algorithms, they were implemented inside Apollo. Three datasets were composed by Apollo by using its keyword and geographic filtering mechanism. The first was collected by Apollo during and shortly after hurricane Sandy, from around New York and New Jersey in October/November 2012. The second was collected during hurricane Irene, one of the most expensive hurricanes that hit the Northeastern United States in August 2011. The third one was collected from Cairo, Egypt during the violent events that led to the resignation of the former president in February 2011. These traces are summarized in Table 8.2.
Table 8.2
Statistics of Three Traces
| Trace | Sandy | Irene | Egypt Unrest |
| Start date | 11/2/2012 | 8/26/2011 | 2/2/2011 |
| Time duration | 14 days | 7 days | 18 days |
| # of tweets | 12,931 | 269,308 | 93,208 |
| # of users twitted | 7583 | 207,562 | 13,836 |
| # of follower-followee links | 37,597 | 3,902,713 | 10,490,098 |
| # of users crawled | 704,941 | 2,510,316 | 5,285,160 |
The Apollo tool operated over each data trace above, while executing each one of the compared filtering algorithms. The output of filtering was manually graded in each case to determine match with ground truth. Due to man-power limitations, only the 150 top ranked claims were manually graded by each algorithm using the following rubric:
• True claims: Claims that describe a physical or social event that is generally observable by multiple independent observers and corroborated by sources external to the experiment (e.g., mainstream news media).
• Unconfirmed claims: Claims that do not meet the definition of true claims.
Note that, the unconfirmed claims contain the false claims and some possibly true claims that cannot be independently verified by external sources. Hence, the evaluation presents a pessimistic performance estimates, taking all unconfirmed claims as false.
Figure 8.2 shows the result for the Hurricane Sandy trace. We observe that Apollo-social (i.e., the social-aware EM) generally outperformed the regular EM schemes in providing more true claims and suppressing the unconfirmed claims. This is achieved by incorporating the source dependency into the analytical framework of expectation maximization to better handle non-independent sources and their claims. The performance advantage of Apollo-social compared to regular EM is significant (nearly 20%) if the combined social network information (i.e., RT+FF social network) constructed from follower-followee and retweet relationship between users was used. We observed that the performance of the Apollo-social using ECs to estimate the social network is between Apollo-social using RT and FF social network. The reason is the RT social network is generated from the retweet relationship from current data interval and is very dynamic to reflect current source dependency and while FF social network is generated from the follower-followee relationship independently from the data traces and is relatively static. The dynamics of source dependency of EC social network is between RT and FF social network.

We also observe the regular EM schemes with admission control perform slightly worse than the one without admission control. The reason is: since the social network in the Sandy trace is relatively dense, the admission controller dropping some sources reduces the amount of useful information by sources that are tweeting when their parents are silent. In contrast, the Apollo-social scheme is shown to handle the social links in a more appropriate way. We also note the voting scheme has a reasonable performance on this trace. The reason is: a set of concrete key words (e.g., gas, station, fuel, etc.) were used for data collection, which results in a relatively “clean” input with less irrelevant information. As we shall see, the performance of voting drops significantly when the input tweet trace has more noise (e.g., Egypt trace as we will discuss later).
Note that, the exact recall may be of less interest, since we are usually interested in only the milestones and key moments of an event as opposed to every possible detail. Experiments were carried to evaluate an approximate recall metric. Specifically, 5 important events reported by media during Sandy were independently collected and checked to see if they are captured in the top claims. The top ranked claims for each of the algorithms were scanned to find these events. Results for selected baselines are shown in Table 8.3. We observed that all five events were covered by the top claims from the Apollo-social scheme, while two of them were missing from the top claims returned from the regular EM scheme.
Table 8.3
Ground Truth Events and Related Claims Found by Apollo-Social Versus Regular EM in Sandy
| # | Media | Tweet Found by Apollo-Social | Tweet Found by Regular EM |
| 1 | Rockland County Executive C. Scott Vanderhoef is announcing a Local Emergency Order restricting the amount of fuel that an individual can purchase at a gas station. | Rockland County Orders Restrictions on Gas Sales - Nyack-Piermont, NY Patch http://t.co/cDSrqpa2 | MISSING |
| 2 | New York City Mayor Michael Bloomberg has announced that the city will impose an indefinite program of gas rationing after fuel shortages led to long lines and frustration at the pump in the wake of superstorm Sandy. | Gas rationing plan set for New York City: The move follows a similar announcement last week in New Jersey to eas…http://t.co/nkmF7U9I | RT @nytimes: Breaking News: Mayor Bloomberg Imposes Odd-Even Gas Rationing Starting Friday, as Does Long Island http://t.co/eax7KMVi |
| 3 | New Jersey authorities filed civil suits Friday accusing seven gas stations and one hotel of price gouging in the wake of Hurricane Sandy. | RT @MarketJane: NJ plans price gouging suits against 8 businesses. They include gas stations and a lodging provider. | MISSING |
| 4 | The rationing system: restricting gas sales to cars with even-numbered license plates on even days, and odd-numbered on odd days will be discontinued at 6 a.m. Tuesday, Gov. Chris Christie announced on Monday. | # masdirin City Room: Gas Rationing in New Jersey to End Tuesday # news | RT @nytimes: City Room: Gas Rationing in New Jersey to End Tuesday http://t.co/pYIVOmPo |
| 5 | New Yorkers can expect gas rationing for at least five more days: Bloomberg. | Mayor Bloomberg: Gas rationing in NYC will continue for at least 5 more days. @eyewitnessnyc #SandyABC7 | Bloomberg: Gas Rationing To Stay In Place At Least Through The Weekend http://t.co/mmqqjYRx |

The above precision and recall experiments were repeated on the Irene tweet trace and Egypt tweet trace. The precision results for Irene are shown in Figure 8.3. In Figure 8.3, we consistently observe that Apollo-social achieves non-trivial performance gain in reducing the number of unconfirmed claims and providing more useful information by using the social network information. Similar results are shown for the Egypt trace in Figure 8.4. For recall, collecting 10 media events on each case, we observed that Apollo-social found all 10 of them in the case of Irene and 9 in Egypt, compared to 7 and 7 by regular EM. Detailed results are shown in Tables 8.4 and 8.5.


Table 8.4
Ground Truth Events and Related Tweets Found by Apollo-Social Versus Original EM in Hurricane Irene
| # | Media | Tweet Found by Apollo-Social | Tweet Found by Regular EM |
| 1 | East Coast Braces For Hurricane Irene; Hurricane Irene is expected to follow a path up the East Coast | RT @BBCNews: President Barack Obama has warned that Hurricane Irene, currently looming off the east coast of the US, could be a “historic” storm. | MISSING |
| 2 | Hurricane Irene’s effects begin being felt in NC, The storm, now a Category 2, still has the East Coast on edge. | RT @kainepaine: Hurricane nears U.S.: Ferocious winds and torrential rainfall lashed coastal North Carolina early Saturday as ma…http://t.co/JDkeO58 | RT @cnnbrk: Hurricane Irene make landfall near Cape Lookout, North Carolina, National Hurricane Center says http://t.co/LV7L7TX |
| 3 | NEWARK, N.J. (CBSNewYork/AP) ł Officials say they will close the five New York-area airports to arriving passenger flights beginning at noon on Saturday. | RT @BreakingNews: All 5 major NYC-area airports to close to arriving flights at noon Saturday due to Hurricane Irene http://t.co/kkwvuPg | RT @BreakingNews: All 5 major NYC-area airports to close to arriving flights at noon Saturday due to Hurricane Irene http://t.co/FMOCfbF |
| 4 | Hurricane Irene charged up the U.S. East Coast on Saturday toward New York, shutting down the city, and millions of Americans sought shelter from the huge storm. | RT @AlArabiya_Eng: Hurricane # Irene rages up # US east coast, # Alarabiya http://t.co/TuvCGg4 | MISSING |
| 5 | WASHINGTON:Obama declares emergency in New York, Virginia and Massachusetts as hurricane Irene approaches | RT @cnnbrk: President Obama declares state of emergency in Virginia and Massachusetts ahead of Hurricane Irene. http://t.co/W7f0Y3U | RT @ShantiDas404: RT @cnnbrk: President Obama declares state of emergency in Virginia and Massachusetts ahead of Hurricane Irene. http://t.co/W8wCZCp |
| 6 | Irene remains a Category 1, the low- est level of hurricane classification, as it churns toward New York over the next several hours, the U.S. National Hurricane Center said on Sunday | RT @BreakingNews: Hurricane Irene speeds up as center nears New York City, maintains hurricane strength with 75 mph winds - AP | RT @BreakingNews Hurricane Irene speeds up as center nears New York City, maintains hurricane strength with 75 mph winds - AP |
| 7 | The Wall Street Journal has created a way for New Yorkers to interact with the location based social media app Foursquare to find the nearest NYC hurricane evacuation center. | Hurricane Irene: Find an NYC Evacuation Center on Foursquare: The Wall Street Journal has created a way f…http://t.co/pH20Ttk | MISSING |
| 8 | President Obama declared Wednesday what much of the state has known for days: New Jersey is a disaster area in the aftermath of Hurricane Irene. | RT @BreakingNews: President Obama signs disaster declaration for hard-hit New Jersey after Hurricane Irene | RT @BreakingNews: President Obama signs disaster declaration for hard-hit New Jersey after Hurricane Irene |
| 9 | Hurricane Irene’s rampage up the East Coast has become the tenth billion-dollar weather event this year, breaking a record stretching back to 1980, climate experts said Wednesday. | Psychic Readings: Hurricane Irene: 2011s 10th Billion-dollar Disaster http://t.co/gdCotzr | RT @cnnbrk: Hurricane #Irene to join billion-dollar disaster club. |
| 10 | Hurricane Irene has led to the deaths of at least 45 people in 13 states, according to an Associated Press tally. | RT @washingtonpost: Hurricane #Irene blamed for at least 45 deaths in 13 states http://t.co/SXHckqg | RT @DMVFollowers: Hurricane Irene blamed for at least 45 deaths in 13 different state. |

Table 8.5
Ground Truth Events and Related Tweets Found by Apollo-Social vs Original EM in Egypt Unrest
| # | Media | Tweet Found by Apollo-Social | Tweet Found by Regular EM |
| 1 | Hundreds of thousands of Egyptians flooded into the heart of the capital, filling up Cairo’s main square in the largest demonstration in a week | RT @nytimes: Pictures of the Day - Thousands gather in Tahrir Square for the largest protests yet in #Egypt http://nyti.ms/eDcBhb | RT @nytimes: Pictures of the Day - Thousands gather in Tahrir Square for the largest protests yet in #Egypt http://nyti.ms/eDcBhb |
| 2 | Google says one of its Middle East managers has gone missing in Cairo, where violent protests against the ruling regime have embroiled Egypts capital for the past week. | Egypt protest prisoner Wael Ghonim @ghonim STILL IN CUSTODY since Jan 28. He’s an activist and Google exec | Egypt protest prisoner Wael Ghonim @ghonim STILL IN CUSTODY since Jan 28. He’s an activist and Google exec |
| 3 | Number of protesters in Cairo’s Tahir Square are revised to more than a million people | RT @amrwaked: Almost 1,000,000 already in #Tahrir! Besides immense other amounts on Kasr El Nil bridge. Historical day for sure!! | MISSING |
| 4 | Bursts of heavy gun-fire early aimed at anti-government demonstrators in Tahrir leave at least five people dead and several wounded. | RT @bencnn: Witness in #Tahrir says pro-democracy people being shot at from rooftops, several dead. #Egypt #Jan25 | RT @bencnn: Witness in #Tahrir says pro-democracy people being shot at from rooftops, several dead. |
| 5 | Al Jazeera correspondent Ayman Mohyeldin is detained by the Egyptian military. | RT @evanchill: We can now tell you that our Cairo correspondent, @aymanM, has been in military custody for four hours. | RT @evanchill: We can now tell you that our Cairo correspondent, @aymanM, has been in military custody for four hours. |
| 6 | Ayman Mohyeldin is released seven hours later. | RT @AymanM: Safe & sound after being detained by the military Thanks 2 all for love/support Hope they Release all! Back 2 work Love Ayman | MISSING |
| 7 | Thousands of pro-democracy demonstrators have poured into Cairo’s Tahrir Square, seeking president Mubarak’s ouster, despite a slew of government concessions. | RT @AJEnglish: Protests swell at Tahrir Square: Tens of thousands pour into central Cairo seeking president Mubarak’s ouster, http://aje.me/hItQXB | RT @AJEnglish: Protests swell at Tahrir Square: Tens of thousands pour into central Cairo seeking President Mubarak’s ouster http://aje.me/gjiOsF |
| 8 | Hosni Mubarak resigns as president and hands over power to the army. | RT @3arabawy: We got rid of Mubarak. Now it’s time to get rid of the Mubarak’s regime. | MISSING |
| 9 | 365 people, at least, were killed during the 18 days of anti-government unrest that took place in Cairo, according to the Healthy Ministry on Wednesday. | RT @AymanM: #egypt health ministry: official death toll from #jan25 protests till today is 365 dead more than 5000 injured. | RT @AymanM: #egypt health ministry: official death toll from #jan25 protests till today is 365 dead more than 5000 injured. |
| 10 | A sea of Egyptians from all walks of life packed every meter in and around Cairos Tahrir Square on Friday for a “Day of Victory” | MISSING | News - Egyptians gather for ’Day of Victory’: Waving flags and beating drums, thousands gathered at Cairo’s Tahr…http://bit.ly/eOMl1L |

Note that, in the experiments above, the number of claims that were verified to be false (i.e., false positives) was not reported. This is because it is easier to verify that an event occurred than it is to verify that it did not. Prominent events that are true would typically be reported in the media. Obscure events would not be. It is therefore hard to verify if they really happened or not.
There was one exception to the above. Namely, in the Sandy example, it was possible for the authors to collect ground truth on gas availability at a subset of New York and New Jersey gas stations at different points in time. This data was mainly obtained from two sources: (i) GasBuddy.com, which recruited spotters to go out and report the status of gas stations in New York and New Jersey during the gas shortage event in the aftermath of hurricane Sandy [128], and (ii) NYC_GAS_Finder, which generated updates on NYC gas stations serving gas based on credit card transaction data [129].
In order to match claims with the ground truth, tweets from the top claims were selected to meet the following criteria: (i) unambiguously mention fuel status, and (ii) explicitly describe a gas station location that matches one of the gas stations for which we have ground truth on the day of the claim. The claim is considered to be true if it matched ground truth status. Otherwise it was false. Thirty (30) of the top ranked Apollo claims could be verified this way. Of these, 29 were true matches, which is 97%. Hence, it is reasonable to hypothesize that the number of unverified claims in other data sets actually contains many true claims.
Finally, we review the analysis of the average running time for the entire Apollo system (with different algorithms) to process and analyze data collected over a one hour window in each of three data traces. The running time is measured from the point when the first tweet of the hour is processed to the point when the results for the hour window are available. The processing times are shown in Table 8.6. We observe that the processing time depends mainly on the size of the trace. The Voting scheme did exhibit the fastest run-time, as might one expect, at the cost of more error in classifying claims correctly. The running speed of Apollo-social is quite comparable to the regular EM scheme. We also note that the running time of Apollo-social and other baselines is well below one hour, which verified the real-time feature of the Apollo system on the real-world data traces.
Table 8.6
Running Time (seconds) of Different Algorithms on an Hour’s Trace
| Algorithms | Sandy | Irene | Egypt Unrest |
| Apollo-social | 2.06 | 61.1 | 2.67 |
| Regular EM | 1.99 | 47.25 | 2.47 |
| Voting | 1.98 | 33.96 | 2.34 |

Note that, the values reported in Table 8.6 include the time taken for computing distance functions, clustering, and running the chosen estimation algorithm (i.e., Voting, Regular EM, or Apollo-social). This explains why voting comes so close to the other two algorithms in run-time, despite the fact that they involve multiple iterations, while voting does not. A more detailed examination reveals that the bottleneck in Apollo lies in computing the distance functions between pairs of observations (as mentioned in Section 8.3). Hence, in total terms, the iterative expectation maximization algorithm described in this paper does not add too much overhead.
8.6 Discussion and Limitations
The chapter reviews encouraging results demonstrating that the accuracy of claims made by social sources can be estimated predominantly correctly even when such sources have unknown reliability and when data has uncertain provenance.
Interestingly, it was observed that the social-aware EM scheme tended to reduce the number of introspective (e.g., emotional and opinion) tweets, compared to tweets that presented descriptions of an external world. This was serendipitously quite appropriate of a “sensor network” that is not supposed to have emotions and opinions, but rather convey observations. Looking into the problem further, it was noticed that emotions and slogans tended to be retweeted along social network topology pathways and hence, tended to be suppressed by the social aware algorithm. In contrast, external facts (such as gas availability at a given location) were often observed independently by multiple sources, and hence not suppressed.
The observation offers many questions and opportunities for improvement, especially when it comes to modeling information propagation. The FF, RT, and RT+FF only provide an approximation of the actual latent social network of how sources are influencing each other. They can be improved by building information propagation models that account for topic (e.g., sensational, emotional, and other news might propagate along different models), expertise, relationship reciprocity, mutual trust, and personal bias (e.g., the claim that “police is beating up innocent demonstrators,” versus “demonstrators are attacking the police”). Note that distortions and biases of human sensors are quite persistent in terms of direction and amplitude, unlike white noise distortions. In a sense, humans exaggerate information in predictable ways. Understanding more about the community of sources can help better quantify the distortion and bias, leading to more accurate formulations of the maximum likelihood model.
The source node behavior model deserves more investigation. The work presented in this chapter only considers the social network structure that can be represented by a forest of two level trees. It also assumes the child node will not independently make the same claim as its parent. Those assumptions might not hold in many real world applications. For example, the twitter user could independently tweet about a popular event with very similar content as its parent. Therefore, it is necessary to develop more comprehensive models to accurately characterize the social network structure in a more general form. The key challenge is how to integrate the new node behavior model with the maximum likelihood framework we reviewed in this chapter.
In this chapter, the social-aware EM scheme focused on a binary claim model. It is shown to be a reasonable model to represent the physical events that are either true or false. However, there is also a large number of real world applications where observations from participants are non-binary (e.g., on-line review systems). It is possible to generalize the fact-finding method that accounts for multiple mutually exclusive values (see Chapter 7) to incorporate the social network model. Furthermore, it is also interesting to generalize the estimation model to better handle claims that have continuous values. Probabilistic, Subjective, or Fuzzy logics could be good modeling techniques to apply in this case.
A separate problem is to deal with dynamics. When the network changes over time, how best to account for it in MLE? A better formulation is needed that puts less weight on older data. Deception and malicious users also need to be addressed. Of particular interest are sources that gain advantage by acting reliably then change their behavior to deceive the system. It is also interesting to understand the impact of distance functions inside Apollo on the accuracy of estimation results. Distance function assess how close two tweets are. Current functions are based on lexicology only (i.e., they compare words without interpreting them). How much benefit is attained by syntactic and semantic analysis of different levels of sophistication? How does that benefit depend on the properties of the trace? These issues provide directions for future work.
Finally, we should note that the human sensor model and the estimation framework reviewed in this chapter is not limited to the applications that are based on Twitter. It can also be applied to a much broader set of crowdsourcing and mobile sensing applications, where the data are collected from both human sources and the devices on their behalf. Examples include traffic condition prediction using data from in-vehicle GPS devices and geo-tagging applications using participant’s smartphones. In these applications, humans or their devices represent the sources and measurements they report represent claims. The reviewed estimation approach can be used to address similar data reliability and uncertain data provenance challenges in these applications.