pandas objects provide the .describe() method, which returns a set of summary statistics of the object's data. When applied to a DataFrame, .describe() will calculate the summary statistics for each column. The following code calculates these statistics for both stocks in omh:

With one quick method call, we have calculated the count, mean, standard deviation, minimum, and maximum values, and even the 25th, 50th, and 75th percentiles for both series of stock data.
.describe() can also be applied to a Series. The following code calculates summary statistics for just MSFT:

Only the mean can be obtained, as follows:

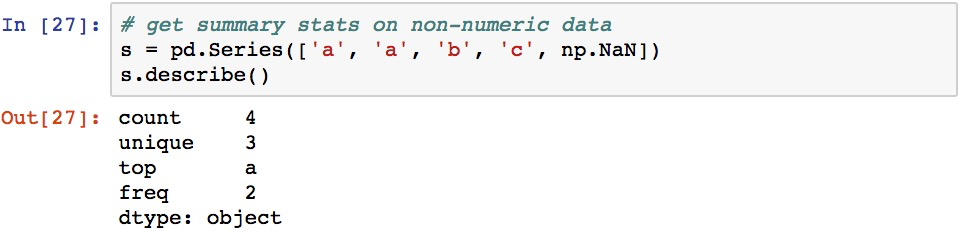
Non-numerical data will result in a slightly different set of summary statistics, returning the total number of items (count), the count of unique values (unique), most frequently occurring value (top), and the number of times it appears (freq):