
Chapter 51. Unlocking the secrets of SQL Server 2008 Reporting Services
I want to share some of the Reporting Services technology implemented in SQL Server 2008—at least those features that make a difference to application developers. Thanks to your (and my) suggestions, Reporting Services is better this time. Thankfully, they left in almost all of the good features and added a few more. That said, there are still a number of things I would like improved—but I’ll get to that. Yes, there are a few Reporting Services features that are still under development. These include the real MicrosoftReportViewer control that can process the second-generation Report Definition Language (RDL) produced by the Reporting Services 2008 Report Designers.
Why should developers care about Reporting Services?
Over the last 35 years I’ve written lots of programs and taught many developers how to build best practice applications. Many of these programs were simply ways to present data to ordinary end users or extraordinary corporate executives, so they could better understand, assimilate, and leverage the information being presented. Initially these reports were heavily processed and formatted data dumps to paper, which were often discarded as fast as the systems could print them. Later, reports were implemented as programs—often as Windows Forms applications, but more recently they might be based on ASP, Windows Presentation Foundation (WPF), or Silverlight platforms. Yes, sometimes developers were forced to use one of the early Microsoft and third-party Visual Studio report development tools, but after a period of frustration, some decided it was easier to take up a career in coal mining than to face the rigors of one of these troublesome reporting paradigms. All that has changed—mostly due to innovations in Microsoft Reporting Services.
Let’s get started with an overview of Reporting Services in terms that anyone can understand. Later on I’ll show how Visual Studio in one of its many manifestations can serve as a powerful tool to create your reports, get them deployed to the Reporting Services server, or include them in your ASP, Windows Forms, or other projects.
What is Reporting Services?
Reporting Services is just that: a service that runs (starting with SQL Server 2008) as a self-hosted service on a network server, as illustrated in figure 1. The SQL Server 2000 and 2005 versions of Reporting Services run as a web service hosted by Internet Information Services (IIS).
Figure 1. SQL Server Reporting Services architecture

Note
It’s best if Reporting Services runs on a dedicated system because in high-stress production environments it can consume considerable resources that can hobble the performance of a DBMS engine sharing the same resources.
When a report is deployed to a Reporting Services service instance, its RDL file is compressed into a binary large object (BLOB) and stored in the SQL Server Reporting Services Catalog, where it waits to be rendered by a SOAP request from your application, the Report Manager, SharePoint Services, or by referencing the right URL.
Now let’s look more closely at the Report Server. Reporting Services processes requests for reports as follows:
- The Report Server extracts the RDL by virtual directory path and name from the SQL Server Reporting Services report catalog. It’s then decompressed (and decrypted) and passed to the Report Processor.
- The Report Processor works like a language interpreter—the RDL is the script that drives its operations. Its job begins by extracting the connection strings from the SQL Server report catalog tables and passing them, along with the queries and report parameters to the Data Processing Extension. Yes, a report can reference many data sources and can contain many queries—some of which might require input parameters.
- The Data Processing Extension opens the connection(s), passing in the appropriate credentials, and executes the report queries using any parameters specified in the RDL. Yes, the SELECT statements used to fetch report data or to populate parameter pick-lists are imbedded in the report RDL. The Report Processor subsequently merges data from the named columns extracted from the query rowsets with the RDL-defined report elements and passes the results to the Report Rendering extension.
- The Report Rendering extension works like a printer but with a number of specifically targeted output devices; the default is HTML so reports can be shown in Internet Explorer. (No, Reporting Services reports don’t render consistently in Firefox or Chrome browsers.) In addition, in SQL Server 2008 the Report Rendering extension can also output the report to PDF, TIFF, Excel, CSV, and to Windows Word as well.
When an application or a user requests a report, the RDL might require the user or the Report Processor to supply the values for one or more report parameters. These parameters are often used to focus the report data on a specific subset or set display options as managed by RDL-resident expressions. Capturing parameters requires Reporting Services to render appropriate dialog boxes in the browser to capture these parameters as shown in figure 2.
Figure 2. Report parameters as generated by the Report Processor

Note
When starting the Report Manager for the first time (or after a period of inactivity), be prepared for a wait. It can take 30 to 90 seconds to get the Reporting Services functionality compiled and to render the initial menu of available reports.
As I discuss later, when you set up your report with the Visual Studio Business Intelligence (BI) tools, you can specify as many query and report parameters as needed, as well as default values to use in place of user-provided values. After all required parameters are supplied, the user can click the View Report button to render the report—and repeat this as many times as needed. It’s up to your code to make that process efficient—in some cases, the Report Processor might not need to re-run the query which can save considerable time.
Using Visual Studio to create an RDL report
SQL Server Reporting Services is available with all editions of SQL Server including the SQL Server 2008 Express with Advanced Services edition. Included with SQL Server is a version of Visual Studio used to create CLR executables and Reporting Services reports (among other tasks). I’ll use this pared down business intelligence development toolkit to create, preview, and deploy a sample report. If you have any version of Visual Studio above Express, you’ll be able to create and preview reports as well—even without Reporting Services, but I’ll talk about that option a bit later.
Note
SQL Server Compact editions do not support Reporting Services. For more info, see http://www.microsoft.com/express/sql/download/default.aspx.
Setting up Reporting Services is an important step but we don’t have enough room to devote a dozen pages to this process. Thankfully, it’s easier than ever, so I don’t anticipate that you’ll have significant problems.
In this example, I’ll be using Visual Studio 2008 SP1 that includes the ability to create Reporting Services reports. Nope, without SP1, you won’t be able to do so, as SP1 activates all of the Reporting Services BI functionality. In Visual Studio 2005 you could build, test, and deploy reports. However, you can’t open Visual Studio 2005 BI report projects in Visual Studio 2008 without SP1.
So follow along and I’ll walk you through the process of creating your own report. Relax, it will be fun—I promise.
1.
Start Visual Studio 2008 (SP1) and choose New Project.
2.
Choose Business Intelligence Projects from the New Project dialog box.
3.
Choose Report Server Project Wizard. This launches a wizard that I expect you’ll use once. After that you’ll reuse the RDL file it generates to create other reports.
4.
Before clicking OK, point to an appropriate project save path and name the project. I’m calling mine SQL Bible Report. Click OK.
5.
After the initial Welcome screen (where you clicked Next) you’re ready to start defining where the data for your report is sourced. Sure, the data can come from anywhere—anywhere that can be seen with a .NET provider including the object linking and embedding (OLE) DB and Open Database Connectivity (ODBC). This means data can come from SQL Server, Analysis Services, SAP, Oracle, a flat file, a third-party database visible with a custom ODBC driver or OLE DB provider, or even a JET/Access database.
6.
Name your data source so you’ll recognize it later. No, I don’t recommend DataSource1. Next, choose the Type from the drop-down list. I chose SQL Server.
7.
Fill in the Connection string by clicking on the Edit... button or type it in yourself if you’re sure how to code it. I’m connecting to AdventureWorks2008.
8.
Set the Credentials default to the Security Support Provider Interface (SSPI), which is fine for development. Peter (my coauthor of Hitchhiker’s Guide to SQL Server 2000 Reporting Services) and I do not recommend using trusted authentication for production reports for many good reasons.
9.
If you plan to have several reports in the Visual Studio project that use the same ConnectionString, go ahead and click Make This a Shared Data Source. Remember, the data source name you use here might be shared by other reports in other projects so check with your report DBA.
10.
Click Next to open the Report Wizard’s Design the Query dialog box. Enter the data source–specific SQL to return the rowset (just one) used to populate your report or click the Query Builder to get the wizard to help build it. This launches the ever-familiar Query Designer we’ve used for years. However, this time you’re creating a report, not an updatable TableAdapter. This means you might not need nearly all of the columns or even the Primary Key columns.
Note
To make your report run faster and keep your DBA happy, be sure to choose only the columns needed and include a WHERE clause in your query to focus the rowset on only the data needed by the report.
11.
For my report, I chose a few columns from the AdventureWorks2008 Production.Products table. I also set up a WHERE clause that returns rows where the SellStartDate is between a given range of dates as shown in figure 3.
Figure 3. Specifying the report query with a WHERE clause

12.
After the query is done, click Next to proceed to the report layout dialog boxes. These give you the option to specify a Tabular or Matrix report.
13.
Click Next to specify which column values are to be used to specify report page and group breaks as shown in figure 4. Note that I chose not to include the Weight in this report. This means the query will fetch data that’s not needed—not a good idea. Click Next to continue.
Figure 4. Specifying the report page, group breaks, and detail elements

14.
Choose the Table layout mode (stepped or blocked) and whether you want subtotals. Click Next to continue.
15.
Choose the Table style (the color used as accents in the report) and click Next.
16.
Stop. This is a critical point and if you don’t get this right, nothing will work correctly. For some reason, the wizard has not detected that I installed a named instance during SQL Server setup and chose to use SSL web traffic encryption. This means you must change the Report Server path in the Choose the Deployment Location dialog box to point to the correct Reporting Services instance. In my case, I installed SQL Server 2008 on my BETAV1 system with the instance name of SS2K8. Note that the virtual directory (VD) is named ReportServer (the default VD name) followed by an underscore and the instance name as follows: BETAV1/ReportServer_SS2K8.
But before you jump in and change the Report server name, I suggest you see how Reporting Services Setup initialized the virtual directory name by starting the SQL Server 2008 Reporting Services Configuration tool. Log into your Reporting Services instance and choose the Web Service URL tab (on the left). If the Report Server virtual directory is properly installed, it will provide the Report Server Web Service URLs at the bottom of the dialog box as shown in figure 5.
Figure 5. Reporting Services Configuration Manager Web Service URLs report
Note
These settings are dependent on whether or not you had a proper SSL certificate in place when Reporting Services was installed. In my case, I created a certificate for BETAV1 beforehand. Notice that the Reporting Services configuration tool can also see my laptop’s Reporting Services installation. You can click on these URLs to test if Reporting Services is running properly and to be taken to the Report Server virtual directory.
Yes, you’ll need to change the Report Server name URL each and every time you create a report from the Wizard. No, you won’t want to run the wizard again. In most cases you’ll leverage existing reports and report projects where these settings are maintained.
We’re almost ready to move forward, but before we do, consider the name of the deployment folder—this is where Visual Studio will deploy the report. Consider that anyone with access to an explorer might be able to see your Reporting Services Virtual Directory (VD) and the Report Manager, so as you start creating reports, others will be able to see your unfinished reports as you learn to use Reporting Services.
You can deal with this problem in a couple of ways. First, you should work with Report Manager and your DBA to prevent access to reports under development. Next, it makes sense to create a directory to place the work in progress reports, and use rights management to hide these from casual viewers. This makes sure that unauthorized people don’t run reports they shouldn’t. More importantly, it prevents people from bringing the system to its knees by running reports that consume all of the available resources or those that are not ready for use.

17.
Now we’re ready to click Next, which brings us to the last dialog box. Here you can name the report, view the Report Summary, and choose to preview the report after the wizard is done. Name the report, check the Preview checkbox, and click Finish.
Warning
After you click Finish, you’re done. You won’t be able to rerun the wizard to alter the report later.
18.
At this point you’re taken back to Visual Studio where your report layout is shown in the Design Window, the Report Data window is exposed, and the (report) Preview tab is exposed. You are ready to execute the report and render it locally (as shown in figure 6).
Figure 6. Visual Studio BI project with the newly generated report

No, you don’t need to have Reporting Services up and running at this point—that won’t be necessary until you’re ready to deploy the report.
Sure, the Visual Studio BI tools include a Report Designer that helps developers (or trained end users) build reports by hand. No, this does not involve setting type and getting ink all over your clothes (been there, done that). It means working with a drag-and-drop paradigm to add appropriate report control elements to a report and drag columns from pre-built DataSet objects exposed in the Report Data window.
Using the Visual Studio 2008 Report Designer
If you’re familiar with SQL Server 2005 Reporting Services, you’ll see a number of important differences in the Visual Studio 2008 BI toolset. Note that there is no Data tab—it’s been replaced by the far more sophisticated Report Data window, which is used to manage Built-in Fields (something new for Reporting Services 2008), Parameters, Images, and the data sources created for the report. Sure, you can pull in data from any number of data sources for a single report. There are other changes as well like the incorporation of the Tablix report element that combines functionality of the Table and Matrix report elements. This permits you to group by rows and columns as well as manage RichText data in your reports.
Dundas offerings
Microsoft Partners like Dundas have also helped Microsoft add new functionality to the BI tools. As you develop your reports you’ll find an improved Chart report element as well as a Gauge element. Dundas also provides a host of data visualization products to enrich your reports that are exposed through the Reporting Services extensibility model.
After you’re ready to see your report rendered and populated with data, click the Preview tab on the Report Design window. At this point, the local renderer in Visual Studio processes the RDL just as would be done by the Reporting Services service. It displays the report just as the user would see it (well, almost).
Managing report parameters
If your report requires any query (or report) parameters, the report is rendered with UI prompting dialog boxes to capture these values from the user as shown in figure 7. Where did these parameters come from? Well, remember that the query WHERE clause called for two dates to be provided before the query can run. When the Report Processor finds parameters imbedded in the report, it automatically generates the UI elements to capture the parameters—even if it means building an interactive drop-down list for acceptable parameter values.
Figure 7. The report rendered in the Preview tab

Note
Report parameters don’t initially have a preset default value. Wouldn’t it make sense to provide default values or even a drop-down list of acceptable values? Unfortunately, the wizard has not evolved to the point of capturing default values for parameters. Thankfully, this is fairly easy to configure here in the Visual Studio BI tools or in the Report Manager.
You can configure how parameters are displayed, managed, populated, and validated through a Report Parameter Properties window. Figure 8 illustrates the dialog box exposed by drilling into the Report Data window and a specific Report Parameter. Here you’re given the option to set default values, provide a hard-coded list of permissible values, define an expression to compute the default value, or specify a query to populate a list of permissible values (and more).
Figure 8. Setting a default value for report parameters

If you define default values for all your report parameters, the Report Processor does not wait to capture parameters before rendering the report. This means it’s important to provide default values that don’t return all available rows. Let users decide which part of the data they need to see.
Note
Report performance is directly tied to the amount of work the Report Processor needs to perform to build and render the report. This means that parameters that focus the report query on specific, relevant rows are critical to a best-practice design.
Deploying your report
When you’re happy with how the report behaves and appears to the user, you’re ready to deploy it to a specific Reporting Services instance. Yes, you chose that instance name when you ran the Report Wizard, but let’s assume that you did not use the Report Wizard to create your report (and I don’t expect you will after you have built your first report). In any case, it does not hurt to double-check these settings in the report project property page as shown in figure 9.
Figure 9. Setting the report deployment properties

Notice that you’re able to set whether or not Visual Studio overwrites existing server-side data sources when deploying the report. This should be left as False as it permits your DBA to properly reset the data souce when it comes time to bring your report into a production directory.
Verify the TargetServerURL to make sure it correctly addresses your Reporting Services Server instance as I discussed earlier.
Assuming the Reporting Services instance is started and accessible from your development system, you’re ready to deploy the report. From the Solution Explorer window, right-click an individual report (.RDL) or the report project and choose Deploy. If the TargetServerURL is set correctly and the Reporting Services server instance is running and properly initialized, your report should deploy in a few seconds.
Using the Report Manager
After your report is deployed, you’re ready to see how it is rendered in a browser by invoking it from Report Manager.
Warning
If you plan to use Report Manager, it assumes you have not installed the SharePoint Services extensions. This configuration option is an either/or deal—you can use one or the other, but not both.
Again, I suggest using the SQL Server Reporting Services Configuration utility to verify that your Report Manager URL is correctly configured as shown in figure 10.
Figure 10. Verifying the Report Manager URL

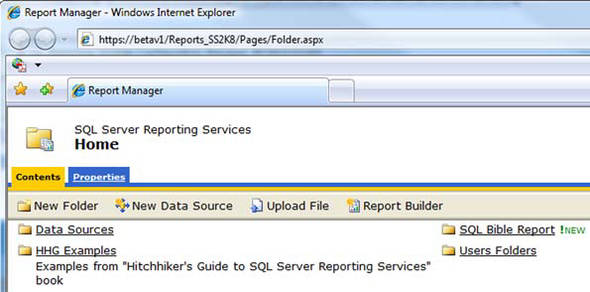
I find it’s easiest to click on the appropriate URL and save it in my IE favorites. Doing so launches the Report Manager as shown in figure 11—eventually (it can take 90 seconds to launch).
Figure 11. The Report Manager home directory
Note
I like to think of the Report Manager as two tools, one to view directories and launch selected reports and another to manage the reports and Reporting Services configuration.
In this case we’ll be navigating to the new SQL Bible Report path and launching the new report we just deployed. Click on the SQL Bible Report icon and choose Products by Sell Date (or the path and report name you choose for your report). This instructs the Reporting Services service to start the Report Processor, which processes the report and sends the rendered HTML back to the browser. The report that’s shown in the browser should appear to be similar to the report previewed in the Visual Studio BI project but because these are two different rendering engines (one client-side and one server-side), you can expect some subtle differences—especially on complex reports.
In the 2008 version of Reporting Services, you can now render reports to Microsoft Word as well as the previously supported XML, CSV, PDF, MHTML, Excel, and TIFF formats. You can also navigate to a specific page, zoom in, find specific items, and print the report.
Using the Visual Studio MicrosoftReportViewer control
No discussion of Reporting Services would be complete without mentioning the latest implementation of the (still evolving) Visual Studio ReportViewer (MRV) control. Unfortunately, Visual Studio SP1 does not include an update for this control despite its name change. It’s expected that the real version of the MicrosoftReportViewer control won’t appear until Visual Studio 2010 ships. Be that as it may, it’s still an important technology first introduced in Visual Studio 2005.
The MRV control was made possible by leveraging the innovative work done by the Microsoft engineers working on the Visual Studio BI tools. Because they had to create a stand-alone Report Processor that previewed the report on the developer’s system, all they had to do was expose the reporting interface as a class (not to minimize the work required to accomplish this). The end result is the MicrosoftReportViewer control that developers can use to leverage some RDL reports. Visual Studio also contains report-authoring tools that create local client-side reports and persist them as Report Definition Language Client-side (RDLC) files. But there’s a hitch. First, consider that there are three types of RDL report file formats:
- First-generation RDL as implemented by Reporting Services 2005
- First-generation RDLC as implemented by Visual Studio 2005 BI tools
- Second-generation RDL as implemented by Reporting Services 2008
Because there are few significant differences between first-generation RDL and RDLC report files, they are easily transmogrified. Unfortunately, there is no support for second-generation RDL local reports in the Visual Studio 2008 MRV control. However, you can display server-hosted second-generation reports. We expect this to be updated with the next major revision of Visual Studio or as a separate release from the SQL Server team sometime in 2010.
Let’s see how the MRV control works. Consider that the MRV Report Processor does not attempt to run any queries. It assumes that you pass in the following (basic) items to the control before you can expect it to render the report:
- An RDLC file containing the report definition. Although an RDLC file contains information about the data source, the query and the columns it returns, and how these are mapped to report elements, the MRV control only uses this information to map columns of the data provided by the host application to the report elements.
- A data structure that implements IBindingList. This includes any .NET Data Table and custom data arrays.
- Any report parameters used in expressions imbedded in the RDLC.
- A pointer to the named data souce referenced in the RDLC.
These items are set via properties in the ReportViewer.Local report class exposed by the MRV control and are set and managed by your code. This means it’s up to your client-side code to take on many of the tasks that Reporting Services would perform server-side. These include the following:
- Building a project (Windows Forms or ASP) that includes a MRV control bound to a specific RDLC report file. Yes, this can be assigned at runtime.
- Building the UI elements to capture user-provided or code-generated query and report parameters, capturing and validating the parameter values.
- When the report is to be displayed, establishing a client-side connection to the appropriate data providers—one for each unique data source.
- Executing data queries for each dataset defined by the report including passing in any query parameters and (typically) constructing one or more DataTable objects.
- Passing the DataTable object (or objects) to the MRV Local report class via binding interfaces.
Visual Studio makes the process of setting up a locally rendered report easy. After you create a local RDLC report (using the same Report Wizard as discussed previously), linking it up to a MRV control is a matter of choosing it from a configuration menu. If you use the Visual Studio Table Adapter Configuration Wizard to build the data souce (report data query), Visual Studio automatically saves the appropriate code to the Form_Load event handler in your project to fill the bound data table. This means you don’t have to write any code at all—except the code needed to manage any input parameters.
There is a lot more to the MRV control and how to implement it in a variety of application scenarios than I have space to present here.
What’s in Reporting Services 2008 for developers?
Let’s visit some of the refined features that should make your job as a developer easier and a few unfinished features that will stick out on the road like a dead moose hit by that cement truck that passed you a minute ago.
Virtual directory changes
Reporting Services 2008 no longer needs IIS—at least not to host the virtual directories. This makes it faster (as IIS does not add an additional layer). You’ll still want to set up a certificate to be able to access your reports via Secure Sockets Layer (SSL). Running a production report without SSL is like mentioning your big sister’s phone number on the local country-western radio station.
Reporting Services 2008 has also changed the default virtual directory name used to reference the Report Manager and Report Server. For the two people in Cleveland that didn’t set up SQL Server with a named instance, you can skip on down to the next tip. For the rest of you, when it comes time to address the Report Manager, or to deploy your Visual Studio BI Report Project, you’ll discover the syntax shown in figure 12. Note that the deployment TargetServerURL name appends the instance name after reportserver with an underscore (_) instead of a dollar sign ($) which probably offended someone in the Ural Mountains and all IIS purists.
Figure 12. Setting the TargetServerURL

Notice that this dialog box is still not sizeable so if the server name or instance name is a bit longer, you’ll have to figure out how to squirrel around with the arrow keys to inspect the current setting. This also means that when it comes time to get to the Report Manager (and you’ll want to), you’ll need to use this URL: https://<system name>/Reports_<instance name>.
Using SQL Server Reporting Services Configuration Manager
This is not a new tool, but it’s had a facelift and its functionality polished up. This is where you bind the SSL port to the certificate you created with IIS manager. Anyone installing Reporting Services (any version post 2000) needs to visit this tool and walk through the icons to make sure everything is not only hooked up correctly, but to configure SSL, set up the email links and, most importantly, set and back up your encryption keys. It’s going to be pretty tough to get your reports back without these keys. I visited the Report Manager URL link and saw the page as shown in figure 13.
Figure 13. The Reporting Services Configuration Manager—setting the Report Manager URL

Exporting reports
Reporting Services still does not have an easy way to export your reports, so you can protect your work outside the scope of the scheduled SQL Server backup. Frankly, I would find it hardly worth the effort if I had to restore a single report, and my only option was to restore the entire Reporting Services database.
Thankfully, Jasper Smith has (apparently) mastered SOAP and the programmatic interfaces to Reporting Services and invented a (free) utility[1] to suck out the RDL and data sources and all of the other catalog items from the database. I tried this utility and although it initially did not seem to support SQL Server 2008 (2.0.0.0.11), I was able to get it to connect to my SS2K8 instance and script out the reports as well as create a Visual Studio BI project for each directory. This saved me a lot of worry and trouble to propagate my test reports to another system. The Reporting Services team tells me that this is on their radar and might appear in a future release.
1 Jasper’s utility can be found at http://www.sqldbatips.com/showarticle.asp?ID=62.
Enabling My Reports
Not all of you will expose the Report Manager utility to your users, but those of you who do might also want to enable the My Reports feature to help users maintain a personal directory of reports based on their domain login name. For example, after I enabled My Reports, Reporting Services included a new directory tree for my reports that I could use to help catalog specific reports that I use on a regular basis. However, enabling this feature is a bit tricky. Unfortunately, the documentation is a bit sketchy, but it’s not that hard after you know the secret handshake.
Start SQL Server Management Studio but instead of connecting to a Database Engine, choose Reporting Services from the initial Connect to Server dialog box. The Reporting Services Object Explorer is one way to create specific Reporting Services Roles to which you can assign specific rights. This prevents all or groups of users from accessing reports that they should not see. But that’s not why we’re here—we want to enable the My Reports functionality. Right-click on the base connection and choose Properties. The dialog box shown in figure 14 should appear (except if you’re a member of Congress, in which case seven identical copies will appear).
Figure 14. Setting Reporting Services properties

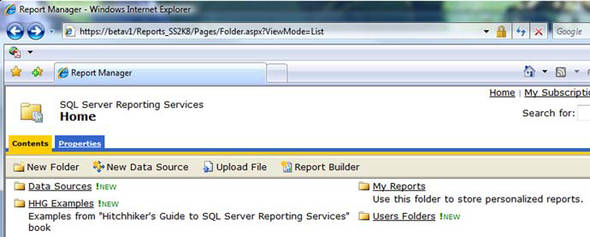
When enabled, you’ll be able to set the role applied to each of the My Reports directories created on the server. Yes, that’s right. As Windows users open the Report Manager URL, shown in figure 15, they will each have a new path created in the Reporting Services catalog for domain name.
Figure 15. The Report Manager with My Reports enabled
Working with the Report Designer
Many report designers are available to Reporting Services developers. The Microsoft designers include the following:
- The Report Designer used in Visual Studio 2003— This designer has the Reporting Services add-in tacked on with binary duct tape. The designer can only work with Reporting Services 2000 RDL reports. This version of Visual Studio does not support the ReportViewer control.
- The Report Designer used in Visual Studio 2005— This designer cannot see or work with Reporting Services 2008 (at all) but it can import Reporting Services 2003 (SQL Server 2000) Reporting Services RDL reports and interface with Reporting Services 2005. It supports the first-generation ReportViewer control, which can cross pollinate with SQL Server 2005 Reporting Services RDL reports.
- The Report Designer used in Visual Studio 2008— This designer still cannot see or work with Reporting Services 2008 (at all) or even open Reporting Services 2005 projects. It still supports the first-generation ReportViewer control and can cross pollinate with SQL Server 2005 Reporting Services RDL reports.
- The Report Designer used in Visual Studio 2008 SP1— This designer can now work with Reporting Services 2008 and even open Reporting Services 2005 projects, which it converts to the Visual Studio 2008 format. It supports only first-generation ReportViewer control projects and can cross pollinate with SQL Server 2005 Reporting Services RDL reports but not Reporting Services 2008 RDL.
- The Report Designer launched by the Reporting Services BI Tools— This (Visual Studio) BI designer is specifically designed to work with Reporting Services 2008 and also Reporting Services 2005 projects and converts them to the Visual Studio 2008 BI format. It does not support Windows Forms or ASP development at all so the ReportViewer control is not an issue here.
Confused? Join the club. Yes, there are at least four people over in Building 35 on the Microsoft campus who understand the reasoning behind these evolutionary trends that keep breaking compatibility between versions, but that does not help us understand why we can’t do what we’ve been told to do when creating Reporting Services reports.
The real story is, there is a SQL Server Reporting Services 2008 RDL rendering engine that solves many ugly problems seen in the first-generation RDL renderers (yes, there are several). SQL Server Reporting Services 2008’s rendering engine supports the Tablix control (which isn’t a report control at all), and lots of Rich Text functionality. That’s good. The fact that the engine is faster and more flexible is also good. The problem is that the 2008 rendering engine and the Report Designers who build RDL to feed it create new and incompatible RDL files that can’t be consumed by the old engine. That’s bad—at least for the people who want to use the easy-to-develop-your-report BI tools to build these new reports and leverage the ReportViewer control in Windows, WPF, and ASP applications to deploy them. You see, behind the scenes, the Visual Studio 2008 SP1 ReportViewer control only knows how to render the old (first-generation) RDL-style reports. Sigh.
Thankfully, another upgrade to Visual Studio and the ReportViewer control to incorporate the next-generation RDL renderer is underway. I hope it ships before the new Boeing 787 rolls off the line and given that the machinists are on strike, it might have a chance.
Summary
Consider that reporting is a way of life for any serious (and many not-so-serious) application developers. Given how easy it is to create server-hosted or even client-hosted reports, it’s easy to see how developers are leveraging these evolving technologies to reduce the amount of code needed to present data (and graphics) to end users. Consider as well that the Report Processor is designed to take on the responsibility of dealing with complex hierarchies and aggregates as well as parent-child relationships with little code to implement it. That’s why I like it. It generates more solutions with less code that I have to write, debug, and deploy.
About the author

William (Bill) Vaughn is an industry-recognized author, mentor, and subject matter expert on Visual Studio, SQL Server, Reporting Services, and data access technologies. He’s worked in the computer industry for over 37 years. In 2000, after 14 years at Microsoft, Bill stepped away to work on his books, consulting, mentoring, and independent training seminars. He’s written over a dozen books, including Hitchhiker’s Guide to Visual Studio and SQL Server, seventh edition, and Hitchhiker’s Guide to SQL Server Compact Edition. He and Peter Blackburn also wrote the critically acclaimed Hitchhiker’s Guide to SQL Server 2000 Reporting Services.