
Chapter 50. BI for the relational guy
I have frequently been asked by database administrators (DBAs) how they can learn more about business intelligence (BI) and data warehousing. A skill set in database administration is a good base for data warehouse administration and business intelligence, which is why so many data warehouse administrators you meet are either ex-DBAs or perform double duty at their place of employment (I include myself in this category). The approaches have many differences, though. You could even say that the approach to OLTP database design and administration is completely at odds with the approach to designing a business intelligence solution. In this chapter, I will introduce some of the key terminology and give you some tips on starting down the path to business intelligence.
Business intelligence overview
Two general high-level methodologies are adopted in data warehousing. I have found Ralph Kimball’s methodology of using dimensional modeling for data warehousing to be the most widely adopted approach in Microsoft shops. Bill Inmon suggests a more traditional relational design to data warehouses, which feeds one or more subject-specific data marts. I will admit my unfamiliarity with the Inmon approach, which is not to suggest that it is in any way inferior. I will simply say that business intelligence solutions that utilize the Microsoft BI stack tend to also adopt the Kimball methodology. As such, I will only discuss the Kimball methodology in this chapter.
Business intelligence results from an evolution of reporting, shown in figure 1. Some organizations still only utilize operational reporting, but some have implemented sophisticated data mining solutions.
Figure 1. Reporting evolution

Terminology
Certain basic terms, many of which are defined differently by different people, are used in business intelligence. I will submit my definitions, which are based on my background, to serve as a reference for this chapter.
- Data warehouse— Aa relational store of data that serves as a basis for reporting queries and/or a source for OLAP cubes. It consists of tables that support multiple subject areas in the organization. It is often designed using dimensional modeling techniques and, in most Microsoft shops, is housed in SQL Server. This term is often interchanged with data mart, and in most cases data mart is more accurate. Data warehouse just sounds so much more substantial. I tend to use data warehouse even when referring to a data mart, because it tends to be used generically to cover both, and so that is the term used throughout this chapter.
- Data mart— Can be thought of as a mini data warehouse that is specific to a particular subject area. Subject areas tend to align themselves with organizational departments, such as Sales, Finance, or Human Resources.
- Dimensional model— Represents business data in terms of dimensions and facts. Dimensional models are represented as star or snowflake schema. (The section “Dimensional modeling” later in this chapter will cover this topic in more detail.)
- Business intelligence (BI)— Generally, a process and infrastructure that facilitates decision-making based on business data. BI is too often thought of in technical terms; it is far more driven by business.
- Data mining— The process of discovering valuable trends in historical data that can provide insight into future events, based on a predetermined set of factors. A well-known example is on Amazon.com, where books are recommended to you based on your past buying patterns compared to those of other customers who have purchased the same books.
- ETL (extract, transform, and load)— The process of moving data from a source system, usually online transactional processing (OLTP), transforming it into the data schema represented in the data warehouse, and loading it into data warehouse tables. ETL will usually also initiate cube loading. The transformation stage can include various processes, such as converting codes, cleansing the data, and looking up surrogate keys from dimension tables.
- OLAP (online analytical processing)— A process that allows a user to quickly analyze data using common techniques known as slicing, dicing, and drillthrough. In the Microsoft world, OLAP is provided via Analysis Services cubes.
Really, what is so different?
If you’ve had any exposure to operational reporting, you’ll already know many of the differences between reporting systems and traditional OLTP systems. Some of the these are shown in table 1.
Table 1. OLTP versus reporting environment characteristics
|
OLTP |
Reporting |
|
|---|---|---|
|
Queries |
Few rows (1–50) |
Many rows (millions, billions, or more) |
|
Indexes |
Few |
Many |
|
Query volume |
Medium to high |
Low |
|
Updates |
Small, frequent, dynamic |
Large, infrequent, scheduled |
The difference is even more fundamental. OLTP applications are designed based on a discreet set of specifications. Specific data is to be collected, and there are clear patterns about who will enter the data, at what point in the business process, and using what method. The first step to designing a business intelligence solution is to take several steps back to understand the business at its core: Why does it exist? What is its mission? How does the business plan to achieve its mission? What key performance indicators (KPIs) need to be measured to assess success? A business intelligence solution needs to be able to address not just the needs of today, but those of the future, and that can only be accomplished by obtaining a core understanding of the underlying business processes.
I remember a past client who had chosen to implement a replicated OLTP data scheme for all of their reporting needs. They were suffering from numerous repercussions of this decision, including tempdb capacity issues, slow query times, and the inability to scale. When asked why they were not open to discussion about a business intelligence solution that provided more efficient analysis via OLAP cubes, they cited a prior attempt at a BI application that only addressed the queries for which it was designed. When the questions (queries) changed, the cube did not contain the information necessary to respond, and the whole project was aborted. This is why it is so critical to model the data warehouse based on the business, not on the specific reporting needs of the day.
Note
One of the hardest things for a relational DBA to come to grips with is the redundancy involved in data warehousing. It’s disk intensive, to be sure. Often, a copy of a subset of the data is made for staging prior to loading the data warehouse, then there is the data warehouse itself, plus the cube store. This redundancy can be mitigated somewhat in the data warehouse design, but it’s best to come to terms with the idea of redundancy as soon as possible. One exciting benefit is the potential to archive data from the operational system as it is loaded into the data warehouse, making the OLTP system more lean.
Approach
The following is a high-level view of how a business intelligence project should be approached. This is intended to provide an overview to contrast with the approach taken in typical OLTP development projects.
- Determine overall strategy— The general approach to a business solution is to develop an overall strategy to the data warehouse, determining how departments interact with each other and developing a high-level plan for how each subject area will be built out. In practice, I find that most companies skip this step. Departments in an organization tend to vary in their readiness for data warehousing, and cooperation from all departments is critical for making this step possible.
- Address a subject area— Each subject area should be addressed in great detail, fleshing out the relevant dimensions and developing one or more star
schemas to represent the business segment. This is done by conducting interviews with business subject-matter experts.
Tip
One common pitfall I have found is clients insisting that the IT staff knows all there is to know about the business. It is true that they are intimate with the business rules that underlie the technology solutions that run much of the business, but that should not be confused with a core understanding of the business, including insights into where the business is heading. IT personnel are a valuable resource for knowing where data is housed and how to best get it into the data warehouse. The data model should be based on interviews with stakeholders within the departments represented in the subject area.
- Develop the dimensional model— Developing a dimensional model that represents the business based on the information gathered in the preceding step is paramount in a successful business intelligence solution. It’s important to get this step right. An indication of a well-designed model is its ability to accommodate changes easily.
- Extract, transform, and load— When the dimensional model has been established, it is time to determine data sourcing, or how to best populate the model. ETL processes need to be designed to accommodate the initial loading of the data warehouse, as well as ongoing incremental loads, which will, hopefully, be able to isolate new data in the source system from data that has been previously loaded.
- Develop the cube— Cube design usually closely follows the dimensional design, which is one reason for the focus on the dimensional design. Analysis Services provides easy mechanisms for understanding the dimensional model and building dimensions and measure groups.
The remaining steps involve data validation, the automation of remaining processes, and more. This is a simplified, high-level description of the approach to building a business intelligence solution. For more information, the best text I have found on the topic is The Data Warehouse Lifecycle Toolkit by Ralph Kimball and others (Wiley Publishing, 2008). Note that this book will only take you through the implementation of the relational data warehouse. For information regarding the implementation of Analysis Services cubes, as well as other things to consider when using the Kimball approach in a Microsoft BI implementation, check out The Microsoft Data Warehouse Toolkit by Joy Mundy and Warren Thornthwaite (Wiley Publishing, 2006).
Dimensional modeling
I’d like to spend some more time on dimensional modeling, because it is core to the implementation of a quality data warehouse. It can also be difficult to grasp for those used to modeling tables in third normal form. Why build a dimensional model in the first place? What’s wrong with duplicating the source tables?
First of all, end users have a difficult time navigating tables in third normal form. A normalized model is intended to support the fast and accurate input of data, with minimal redundancy. OLTP table and column names are usually cryptic, and several tables may have to be joined together in order to create a query. The application has also built-in cryptic business rules that a user would have to know about, such as WHERE ActiveInd = 'A', or WHERE EntityCode = 'XYZ'. Dimensional models make more sense to users because they more closely match how they view the business. They provide a flexible means of accessing the data. On top of all that, dimensional designs respond more quickly to queries that span large amounts of data. SQL Server often recognizes star schemas and optimizes accordingly.
Dimensional models are implemented as star or snowflake schemas. I will only address the star schema, because the snowflake schema can be considered a variation on the star schema. A star schema consists of from one to many dimensions (one dimension would be highly unlikely) that are related to a single fact table. The dimensions represent ways of looking at the data—the who, what, where, when, and why. The fact table has implicit foreign keys to each of these dimensions, as well as a collection of facts that are numerical. For example, a fact table may represent sales in terms of amount, quantity, tax, discount, and so on. The numbers in a fact table can then be aggregated, usually summed, across aspects of the dimensions to answer queries about what has happened in the past.
Let’s take an example of a star schema that represents retail sales. The dimensions would be things like customer (who), product (what), sales territory (where), date (when), and promotion (why). The star schema might look something like figure 2.
Figure 2. A star schema

An important thing to note is that the fact table joins to the dimension tables on surrogate keys, which are usually IDENTITY columns in SQL Server, intended to abstract the row from the business key. Always use surrogate keys (except on the Date dimension), even if you don’t think you need one right now. Surrogate keys are useful in slowly changing dimensions and when a dimension spans multiple entities, each of which may assign distinct business keys. For example, Human Resources may use one key for an employee, such as a social security number, and a Sales system may assign its own business key to an employee. Using a surrogate key will tie the two together across applications, facilitating richer analysis.
Tip
Even if you are developing a dimensional model that currently supports a single department in the organization, be sure to keep the entire organization in mind to facilitate future enhancements. Shared, or conformed, dimensions facilitate analysis across departmental fact tables. For example, an Employee dimension might include employee salary, manager, and hire dates (Human Resource information) as well as sales region assignments (Sales information). Storing both sets of data enables the analysis of hiring programs and manager-mentoring effectiveness on sales performance.
Cubes, anyone?
You could stop after creating the data warehouse. Some do. Analysis Services, or any OLAP technology, requires a new skill set to develop and maintain cubes. But a cube solution vastly improves the analytical and usability factor in the resulting solution. Users no longer have to know how to write T-SQL or be constrained by static reports. There are also a number of tools that consume OLAP data sources—Excel (shown in figure 3), PerformancePoint, Reporting Services, and Panorama, just to name a few. And the query response speed can go from many minutes (or hours) for a SQL query to seconds from a cube. The power of online analysis is the ability to quickly ask a question, get an answer, and then ask another question based on the first result.
Figure 3. MS Excel 2007 Pivot Table sourcing Analysis Services cube
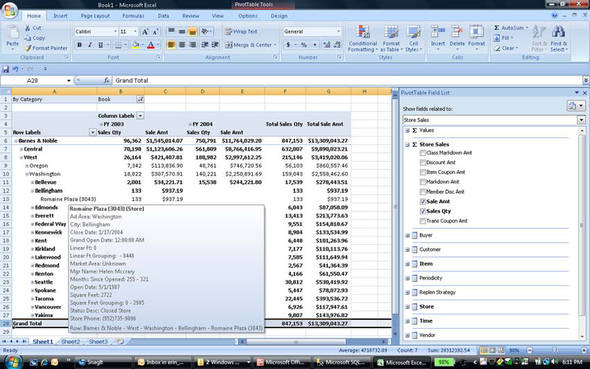
Analysis Services cubes are specifically designed to retrieve thousands or millions of data points and aggregate them quickly. Some of this performance is accomplished through aggregations, which precalculate the data at predefined intersections of dimensions. Think of it as building several indexed views to provide summarized information in SQL Server. The difference in query time often differs in orders of magnitude.
There is a common misconception regarding where cube data is stored. Cubes have their own separate data store in addition to the data warehouse. This can be greatly minimized using ROLAP (relational OLAP) partitions, but this is universally considered a bad idea except for small real-time partitions, due to performance. MOLAP (multidimensional OLAP) is the preferred storage option, which results in a redundant data store that is specifically tuned for OLAP query performance. Cube processing is the activity that loads data into the cube from the data source.
Resist cutting corners in regard to storing data in the data warehouse. It might be tempting to prune data from the data warehouse once it is contained in the cube, but this would remove your ability to reprocess the associated cube partitions, and that data would eventually be lost, because cubes must be reprocessed if associated dimension structures change. Again, the relational DBA approach is all about economizing on disk usage, but that mindset is at odds with the data warehouse implementation.
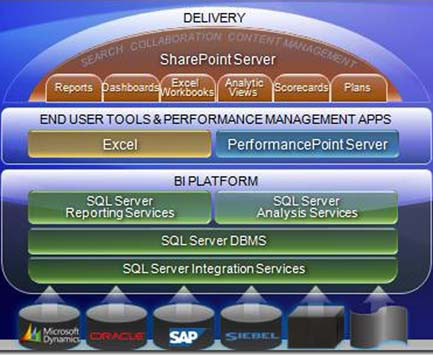
Microsoft BI stack
Microsoft provides all the tools required to implement a business intelligence solution, from the relational data warehouse store to the front-end analytics.
Microsoft’s initial approach was to provide only the back-end tools, up to the delivery of OLAP cubes. They relied upon partners, such as Proclarity and Panorama, to deliver the front-end functionality. Over the last few years, Microsoft has completed the stack with the development of Business Scorecard Manager and the acquisition of Proclarity. Both of these products are now released in a single product called PerformancePoint.
The Microsoft BI stack is represented in figure 4.
Figure 4. The Microsoft BI stack
How do I get started?
This chapter was intended to give you a basic introduction to business intelligence and to explain why it differs so dramatically from the traditional OLTP approach. From here, my best recommendation is to start the way I started, with a book I cannot recommend enough: The Data Warehouse Lifecycle Toolkit by Ralph Kimball and others. One of the things that I like about it is that it not only explains the what, but it also explains the why. I occasionally deviate from the approaches recommended in the book, but only after reading the why to be sure there was nothing I was missing. This book is not technical; it is more specific to the methodology, which is what is most lacking in technicians coming from an OLTP environment. It does contain some great information on dimensional modeling, including techniques for handling common scenarios that arise when trying to represent business data in a dimensional model.
It is difficult to make a universal recommendation about how to get your feet wet. One option is to develop your own cube to represent a solution to a problem. One of my favorite projects was to build a cube to analyze how disk space was being used on my computer. I have a difficult time identifying files that are duplicated in several folders, and building such a cube helped me identify where most of my space was going (I freed up about 30 percent of my disk space based on this analysis!). Another implementation could analyze server resource consumption. In fact, such a solution is available for download as a PerformancePoint sample (see “Scorecards and Dashboards for your IT Department” at http://www.microsoft.com/bi/department/department.aspx?id=tab1), so you can validate your approach.
If there is a data warehouse project in development or already implemented at your company, you may be able to find a way to become a team member and learn from other practitioners with more experience. And there are courses available from the major training vendors to get you started.
Summary
I hope you have gained some insight into the various aspects of business intelligence and learned how it differs from legacy OLTP applications. This should give you the fundamentals, so you can decide if this is something you want to pursue. I have found business intelligence projects to be some of the most rewarding in my professional career. Historically, IT projects have typically been about getting information entered into computer systems, so there is no greater reward than to see the excitement on a business user’s face when they see how easy it can be to make some actionable knowledge out of years of stored data.
About the author

Erin Welker has spent 25 years in information technology development, management, database administration, and business intelligence. She began working with SQL Server in version 1.11, and Analysis Services, SSIS, DTS, and Reporting Services since their inception. Erin has consulted at several Fortune 500 and other well-known companies, developing business intelligence solutions with a specialization in performance. She loves to share her passion for SQL Server and BI through authoring and speaking.