
CHAPTER 7
![]()
Runtime Performance
The last chapter explored ways to optimize web performance with JavaScript. You learned several ways to avoid having external JavaScript block the parsing of the rest of the page. We looked at the async attribute, which is new to HTML 5, and at drawing script tags with JavaScript.
You learned about the lazy load pattern, and applied it to our example's script tags, adding them to the page only after the page has loaded. We expanded that idea to apply to our CSS; lazy loading our CSS files only after the document has loaded.
You ran tests for each of these scenarios; you captured data about each one and visualized comparisons of the results.
In this chapter we will now look at runtime performance optimizations in the browser. We will look at caching references across the scope chain to save time on look-ups. You will learn about using frameworks such as JQuery and compare the runtime performance of operations in JQuery and pure JavaScript. You’ll even try to quantify a long-held belief that using eval() hurts performance. And finally the chapter looks at how to streamline DOM interaction, and quantify the incremental cost of nesting loops.
Keep in mind that because each browser uses a different JavaScript engine, runtime performance numbers can be different for each browser. So for the examples we will look at in this chapter you will first write the code to test, using our perfLogger library, and then look at the perfLogger results in a single browser, and then presumably put the code in a public place where you can crowd-source traffic to it or run it through our own browser lab - where you hit the page many times from a number of different browsers. I’ll talk more about how to implement these changes in production next chapter. And finally we chart the difference in aggregate for each test grouped by browser.
![]() Note Some of these tests have results in the sub-millisecond range, so for best results we’ll use browsers that support high-resolution time. Also remember that your results may vary based on the browsers that you test on or that your clients use. As you’ll see in this chapter’s tests, each browser has varying degrees of efficiency in different areas of execution. The point of this chapter is to learn how to make your own tests and analyze those results, as browsers and client configurations change, to continually evaluate your own best practices based on your end users.
Note Some of these tests have results in the sub-millisecond range, so for best results we’ll use browsers that support high-resolution time. Also remember that your results may vary based on the browsers that you test on or that your clients use. As you’ll see in this chapter’s tests, each browser has varying degrees of efficiency in different areas of execution. The point of this chapter is to learn how to make your own tests and analyze those results, as browsers and client configurations change, to continually evaluate your own best practices based on your end users.
Cache Variables and Properties across Scope
The first optimization to consider is caching variables and object properties.
Let’s look at what this means. Normally when you reference variables in other scopes— at the global level, in other namespaces, and so on—the interpreter needs to traverse the stack to get to the variable.
Let’s use document.location as an example. If you reference document.location from within an object, the interpreter will need to go from the function that references the variable, up out of the namespace to the global window scope, down to the document scope, and get the location value. See Figure 7-1.
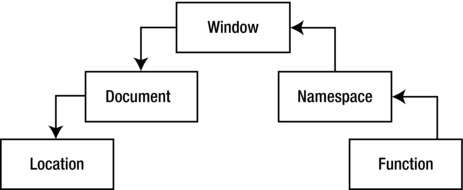
Figure 7-1. Tracing through the stack to get to document.location
This is based on the efficiency of the interpreter and the inheritance hierarchy that you create— if there are namespaces 4 or 5 or 10 objects deep, it will take just that much longer to get to the global scope and then back down to the scope of your intended variable.
To get around this, you can create a locally scoped variable to hold that value, and reference that variable instead. This allows you to create a shortcut to the variable reference and reap a runtime performance boost. See Figure 7-2.
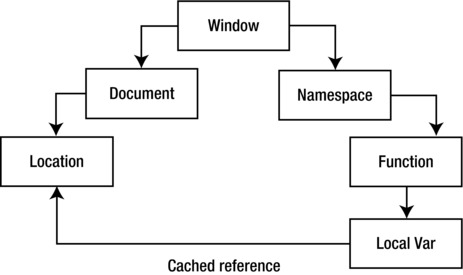
Figure 7-2. Creating a local variable to cache the reference to document.location
Let’s quantify this performance boost with a practical example.
Creating a New File
First create a new file, called cache_locationcomparison.html, and create an HTML skeletal structure of just the doctype, html, head, title, character set, and body tags. This structure will be the base structure that you start each test with for the remainder of this chapter.
<!DOCTYPE html>

<html>

<head>

<meta charset="UTF-8" />

<title>Cache Location Comparison</title>

</head>

<body>

</body>

</html>
In the head, add our perfLogger and a function you can call populateArray that creates and returns an array of whatever size is passed into the function:
<script src="/lab/perfLogger.js"></script>

<script>

function populateArray(len){

          var retArray = new Array(len)

          for(var i = 0; i < len; i++){

               retArray[i] = i;

          }

          return retArray

}

</script>
In the body, you’ll create a new script tag and instantiate a new array of size 400 that you will use for the remainder of these tests:
<script>

tempArray = populateArray(400);


</script>
Creating Tests
Now that we are done with setup, let’s create our first test. In this test you’ll capture ad hoc timing data for referencing the document.location. Start by calling perfLogger.startTimeLogging, pass in an ID of "uncached_location", give a description of the test, and set the test to be displayed on the screen as well as saved in our log file. Refer to Chapter 4 for the perfLogger API.
// Capture ad hoc timing data for referencing uncached document.location

perfLogger.startTimeLogging("uncached_location", "Capture ad hoc timing data for referencing

document.location", true, true, true)
Immediately after the call to startTimeLogging, you will run the code for the test. Create a for loop, and have it iterate through tempArray using tempArray’s length property, and each step in the array, set a variable loc to document.location:
for(var i = 0; i < tempArray.length; i++){

     var loc = document.location;

}
Finally, after the loop call perfLogger.stopTimeLogging and pass in the "uncached_location" ID to stop the test, display it to the screen, and log it to the server:
Your completed test should look like the following:
// Capture ad hoc timing data for referencing uncached document.location

perfLogger.startTimeLogging("uncached_location", "Capture ad hoc timing data for referencing

document.location", true,true, true)

for(var i = 0; i < tempArray.length; i++){

     var loc = document.location;

}

perfLogger.stopTimeLogging("uncached_location");
If you view it in the browser, you’ll see the test output:
Capture ad hoc timing data for referencing document.location

run time: 0.2339999999749125ms

path: http://tom-barker.com/lab/cache_locationcomparison.html

useragent: Mozilla/5.0 (Macintosh; Intel Mac OS X 10_5_8) AppleWebKit/536.11 (KHTML, like Gecko)

Chrome/20.0.1132.47 Safari/536.11

Perceived Time: 40370

Redirect Time: 0

Cache Time: 0

DNS Lookup Time: 0

tcp Connection Time: 0

roundTripTime: 12636

pageRenderTime: 107
Let’s make another test, this time benchmarking the for loop just shown. First wrap the loop in a function called uncachedLoc():
//benchmark timing data for uncached document.location

function uncachedLoc(){

     for(var i = 0; i < tempArray.length; i++) {

      var loc = document.location;

     }

}
Then call perfLogger.logBenchmark, pass in an ID of "LocationUnCached_benchmark", tell it to run the function 10 times, pass in the function to benchmark, and have it display to the page and log to the server:
perfLogger.logBenchmark("LocationUnCached_benchmark", 10, uncachedLoc, true, true);
Your completed test should look like this:
//benchmark timing data for uncached document.location

function uncachedLoc(){

     for(var i = 0; i < tempArray.length; i++) {

      var loc = document.location;

     }

}

perfLogger.logBenchmark("LocationUnCached_benchmark", 10, uncachedLoc, true, true);
OK. These tests are your baseline, they are direct references to document.location. What you will do now is create two more tests, optimized to cache the reference to document.location.
First create a variable called l; this will hold the reference to document.location:
Then recreate the logic from the baseline ad hoc test, but instead of setting loc to document.location within the loop, set it to l.
Your complete test should look like the following:
// Capture ad hoc timing data for referencing cached document.location

var l = document.location;

perfLogger.startTimeLogging("cached_location", "Capture ad hoc timing data for referencing

document.location", true,true, true)

for(var i = 0; i < tempArray.length; i++){

     var loc = l;

}

perfLogger.stopTimeLogging("cached_location");
Finally, you’ll benchmark the cached test. Just you did before, create a function called cacheLoc where you create a variable l to reference document.location and reference, that variable in the loop. The completed test looks like this:
//benchmark timing data for cached document.location


function cachedLoc(){

     var l = document.location;

     for(var i = 0; i < tempArray.length; i++){

          var loc = l;

     }

}


perfLogger.logBenchmark("LocationCached_benchmark", 10, cachedLoc, true, true);
Now your completed cache_locationcomparison.html page should look like the following:
<!DOCTYPE html>

<html>

<head>

<meta charset="UTF-8" />

<title>Cache Location Comparison</title>

<script src="/lab/perfLogger.js"></script>

<script>

function populateArray(len){

          var retArray = new Array(len)

          for(var i = 0; i < len; i++){

               retArray[i] = i;

          }

          return retArray

}

</script>

</head>

<body>

<script>

tempArray = populateArray(400);


// Capture ad hoc timing data for referencing uncached document.location
perfLogger.startTimeLogging("uncached_location", "Capture ad hoc timing data for referencing

document.location", true,true, true)

for(var i = 0; i < tempArray.length; i++){

     var loc = document.location;

}

perfLogger.stopTimeLogging("uncached_location");


//benchmark timing data for uncached document.location


function uncachedLoc(){

     for(var i = 0; i < tempArray.length; i++) {

      var loc = document.location;

     }

}


perfLogger.logBenchmark("LocationUnCached_benchmark", 10, uncachedLoc, true, true);


// Capture ad hoc timing data for referencing cached document.location

var l = document.location;

perfLogger.startTimeLogging("cached_location", "Capture ad hoc timing data for referencing

document.location", true,true, true)

for(var i = 0; i < tempArray.length; i++){

     var loc = l;

}

perfLogger.stopTimeLogging("cached_location");


//benchmark timing data for cached document.location


function cachedLoc(){

     var l = document.location;

     for(var i = 0; i < tempArray.length; i++){

          var loc = l;

     }

}


perfLogger.logBenchmark("LocationCached_benchmark", 10, cachedLoc, true, true);


</script>

</body>

</html>
When you view the page in a browser, you should see the following output (with the Performance Navigation data trimmed out for clarity):
Capture ad hoc timing data for referencing document.location

run time: 0.23800000781193376ms

path: http://localhost:8888/lab/chapter7/cache_locationcomparison.html
useragent: Mozilla/5.0 (Macintosh; Intel Mac OS X 10_5_8) AppleWebKit/536.11 (KHTML, like Gecko)

Chrome/20.0.1132.47 Safari/536.11


Benchmarking function uncachedLoc(){ for(var i = 0; i < tempArray.length; i++) { var loc =

document.location; }      }

average run time: 0.08210000523831695ms

path: http://localhost:8888/lab/chapter7/cache_locationcomparison.html

useragent: Mozilla/5.0 (Macintosh; Intel Mac OS X 10_5_8) AppleWebKit/536.11 (KHTML, like Gecko)

Chrome/20.0.1132.47 Safari/536.11


Capture ad hoc timing data for referencing document.location

run time: 0.027000001864507794ms

path: http://localhost:8888/lab/chapter7/cache_locationcomparison.html

useragent: Mozilla/5.0 (Macintosh; Intel Mac OS X 10_5_8) AppleWebKit/536.11 (KHTML, like Gecko)

Chrome/20.0.1132.47 Safari/536.11


Benchmarking function cachedLoc(){      var l = document.location; for(var i = 0; i < tempArray.

length; i++){ var loc = l; }      }

average run time: 0.012399995466694236ms

path: http://localhost:8888/lab/chapter7/cache_locationcomparison.html

useragent: Mozilla/5.0 (Macintosh; Intel Mac OS X 10_5_8) AppleWebKit/536.11 (KHTML, like Gecko)

Chrome/20.0.1132.47 Safari/536.11
Excellent! You can see from both the ad hoc tests and the benchmarking tests that we gain a significant performance improvement by caching the scope chain reference.
Visualizing Our Results
Now let’s chart our results in R. Open up runtimePerformance.R from the perfLogger project. Remember that in this file you have already read the runtimeperf_results flat file into a variable named perflogs.
So start by creating a function that accepts the ID of a test and returns a subset of perflogs that has a TestID that matches the passed in value. Name this function ParseResultsbyTestID(). You’ll use this in a little bit to create variables that will hold data frames for each test that you run:
ParseResultsbyTestID <- function(testname){

     return(perflogs[perflogs$TestID == testname,])

}
You already have the function getDFByBrowser() in runtimePerformance.R; you’ll be using it as well. Remember, this function returns the subset of the data frame passed in that has a UserAgent column that contains the browser name, which is also passed in.
getDFByBrowser<-function(data, browsername){

     return(data[grep(browsername, data$UserAgent),])

}
Next create a variable that you’ll call avg_loc_uncache_chrome, which will hold the average runtime for the uncached location test in Chrome browsers. To get this value, you will call ParseResultsbyTestID and pass in the test ID of "LocationUnCached_benchmark". Pass the results of that function call into getDFByBrowser, along with the string "Chrome":
avg_loc_uncache_chrome <- mean(getDFByBrowser(ParseResultsbyTestID("LocationUnCached_

benchmark"), "Chrome")$RunTime)
If you print the value in the console, you’ll see something like this.
> avg_loc_unucache_chrome

[1] 1.75
Great! Next do the same for Firefox, and then again the same for the "LocationCached_benchmark" test for both Chrome and Firefox (and any other browser you want to track).
avg_loc_cache_chrome <- mean(getDFByBrowser(ParseResultsbyTestID("LocationCached_benchmark"),

"Chrome")$RunTime)


avg_loc_uncache_firefox <- mean(getDFByBrowser(ParseResultsbyTestID("LocationUnCached_

benchmark"), "Firefox")$RunTime)


avg_loc_cache_firefox <- mean(getDFByBrowser(ParseResultsbyTestID("LocationCached_benchmark"),

"Firefox")$RunTime)
Excellent. You now have the mathematical mean for each test in each browser. Now create a data frame to hold all of these and assign meaningful names to the columns of the data frame:
location_comparison <- data.frame(avg_loc_uncache_chrome, avg_loc_cache_chrome, avg_loc_uncache_

firefox, avg_loc_cache_firefox)


colnames(location_comparison) <- c("Chrome
Uncached", "Chrome
Cached", "Firefox
Uncached",

"Firefox
Cached")
And finally, create a bar chart from this data frame:
barplot(as.matrix(location_comparison), main="Comparison of average benchmark time in

milliseconds")
The complete R code that you would need for this example looks like this:
ParseResultsbyTestID <- function(testname){

     return(perflogs[perflogs$TestID == testname,])

}


getDFByBrowser<-function(data, browsername){

     return(data[grep(browsername, data$UserAgent),])

}


avg_loc_uncache_chrome <- mean(getDFByBrowser(ParseResultsbyTestID("LocationUnCached_

benchmark"), "Chrome")$RunTime)


avg_loc_cache_chrome <- mean(getDFByBrowser(ParseResultsbyTestID("LocationCached_benchmark"),

"Chrome")$RunTime)


avg_loc_uncache_firefox <- mean(getDFByBrowser(ParseResultsbyTestID("LocationUnCached_

benchmark"), "Firefox")$RunTime)


avg_loc_cache_firefox <- mean(getDFByBrowser(ParseResultsbyTestID("LocationCached_benchmark"),

"Firefox")$RunTime)


location_comparison <- data.frame(avg_loc_uncache_chrome, avg_loc_cache_chrome, avg_loc_uncache_

firefox, avg_loc_cache_firefox)
colnames(location_comparison) <- c("Chrome
Uncached", "Chrome
Cached",

"Firefox
Uncached", "Firefox
Cached")


barplot(as.matrix(location_comparison), main="Comparison of average benchmark time in

milliseconds")
And from this R code you generate the bar chart shown in Figure 7-3.
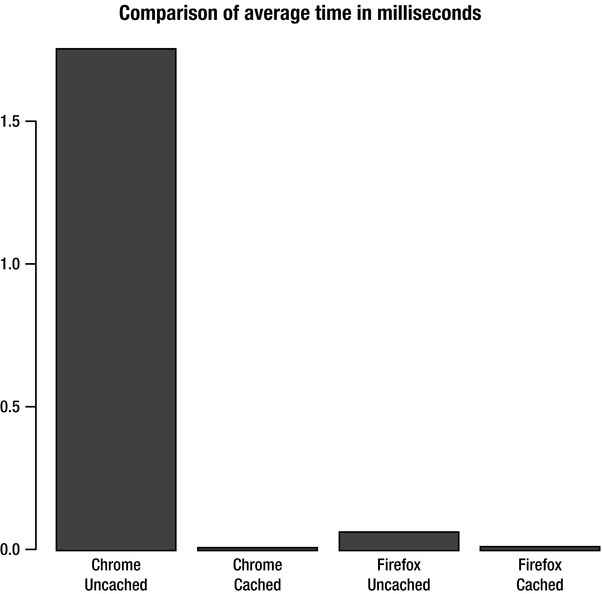
Figure 7-3. Comparison of benchmarking results for cached and uncached scope chain references, by browser
So from this example and our own sample data, we can see that for the client browsers used, both Chrome and Firefox saw performance improvements. Chrome saw the most significant improvement, averaging almost a 2 millisecond improvement. By itself this is insignificant, but at a larger scale we can begin to see value.
Property Reference Example
You've just looked at caching variables in different stacks, now let's look at caching property references. The way you can test this technique is to loop through an array, using the length of the array as the loop terminator. This will be your baseline. You can then loop through another array, store the array length in a local variable, and use this local variable as the loop terminator. If you compare the results for the two techniques, you should be able to quantify the performance benefit of caching the property reference.
<!DOCTYPE html>

<html>

<head>

<meta charset="UTF-8" />

<title>Loop Comparison</title>

<script src="/lab/perfLogger.js"></script>

<script>

function populateArray(len){

          var retArray = new Array(len)

          for(var i = 0; i < len; i++){

               retArray[i] = i;

          }

          return retArray

}

</script>

</head>

<body>

<script>

tempArray = populateArray(400);


// Capture ad hoc timing data for JavaScript for loop with uncached length variable


perfLogger.startTimeLogging("js_forloop_uncached", "Capture ad hoc timing data for JavaScript

for loop with uncached length variable", true,true, true)

for(var i = 0; i < tempArray.length; i++) {


}

perfLogger.stopTimeLogging("js_forloop_uncached");


// Capture ad hoc timing data for JavaScript for loop with cached length variable


perfLogger.startTimeLogging("js_forloop_cached", "Capture ad hoc timing data for JavaScript for

loop with cached length variable", true,true, true)

var l = tempArray.length

for(var i = 0; i < l; i++) {


}

perfLogger.stopTimeLogging("js_forloop_cached");


//benchmark timing data for uncached length variable


function uncachedLen(){

     for(var i = 0; i < tempArray.length; i++) {


     }

}
perfLogger.logBenchmark("JSForLoopUnCached_benchmark", 10, uncachedLen, true, true);


//benchmark timing data for cached length variable


function cachedLen(){

     for(var i = 0; i < l; i++) {


     }

}


perfLogger.logBenchmark("JSForLoopCached_benchmark", 10, cachedLen, true, true);


</script>

</body>

</html>
This produces the following results:
Capture ad hoc timing data for JavaScript for loop with uncached length variable

run time: 41.936000023270026ms

path: http://localhost:8888/lab/chapter7/loopcomparison.html

useragent: Mozilla/5.0 (Macintosh; Intel Mac OS X 10_5_8) AppleWebKit/536.11 (KHTML, like Gecko)

Chrome/20.0.1132.47 Safari/536.11


Capture ad hoc timing data for JavaScript for loop with cached length variable

run time: 14.304999989690259ms

path: http://localhost:8888/lab/chapter7/loopcomparison.html

useragent: Mozilla/5.0 (Macintosh; Intel Mac OS X 10_5_8) AppleWebKit/536.11 (KHTML, like Gecko)

Chrome/20.0.1132.47 Safari/536.11


benchmarking function uncachedLen(){ for(var i = 0; i < tempArray.length; i++) {  }      }

average run time: 29.685899993637577ms

path: http://localhost:8888/lab/chapter7/loopcomparison.html

useragent: Mozilla/5.0 (Macintosh; Intel Mac OS X 10_5_8) AppleWebKit/536.11 (KHTML, like Gecko)

Chrome/20.0.1132.47 Safari/536.11


benchmarking function cachedLen(){      for(var i = 0; i < l; i++) { }      }

average run time: 19.58730000187643ms

path: http://localhost:8888/lab/chapter7/loopcomparison.html

useragent: Mozilla/5.0 (Macintosh; Intel Mac OS X 10_5_8) AppleWebKit/536.11 (KHTML, like Gecko)

Chrome/20.0.1132.47 Safari/536.11
Once again this individual test shows significant performance improvements gained from caching the property reference. Now try it from multiple browsers and chart the results in R.
Create a variable for each test/browser combination. In each variable, store the averaged results of a call to your function getDFByBrowser:
avg_loop_uncache_chrome <- mean(getDFByBrowser(ParseResultsbyTestID("JSForLoopUnCached_

benchmark"), "Chrome")$RunTime)
avg_loop_uncache_firefox <- mean(getDFByBrowser(ParseResultsbyTestID("JSForLoopUnCached_

benchmark"), "Firefox")$RunTime)


avg_loop_cache_chrome <- mean(getDFByBrowser(ParseResultsbyTestID("JSForLoopCached_benchmark"),

"Chrome")$RunTime)


avg_loop_cache_firefox <- mean(getDFByBrowser(ParseResultsbyTestID("JSForLoopCached_benchmark"),

"Firefox")$RunTime)
Next create a data frame to aggregate the variables that you just created and generate a bar plot from this data frame:
loop_comparison <- data.frame(avg_loop_uncache_chrome, avg_loop_cache_chrome, avg_loop_uncache_

firefox, avg_loop_cache_firefox)


colnames(loop_comparison) <- c("Chrome
Uncached", "Chrome
Cached",

"Firefox
Uncached", "Firefox
Cached")


barplot(as.matrix(loop_comparison), main="Comparison of average benchmark time
for cache and

uncached properties
in milliseconds")
This produces the chart shown in Figure 7-4.

Figure 7-4. Comparison of benchmark results for cached and uncached property reference by browser
This is interesting—while you may see performance benefits at an individual test level for Firefox, when you scale the benchmark to many tests, you see that the benefit in Firefox is averaged out, but the benefit in Chrome is over five milliseconds for this test. We can generalize this to an observed 16.6% performance improvement in Chrome:
> (1 - (avg_loop_uncache_chrome / avg_loop_cache_chrome)) * 100

[1] 16.6
Comparison of Core JavaScript versus Frameworks
Something that I’ve noticed over the years both in the classroom with new students coming in, and in interviewees coming for open positions, is that both groups tend to know how to use a framework, usually JQuery, instead of knowing core JavaScript.
This is problematic because not everything should be done using frameworks. Frameworks are an author-time efficiency, meaning that they make coding tasks much simpler by abstracting the real work that goes into doing those tasks. The upside of this is that in addition to wrapping lots of functionality in a little API, they also usually wrap lots of error checking and cross-browser support. But all of this wrapped functionality is available in the core language, and sometimes it runs faster in the core language because we can do only what we need to do, not what is needed to support every user of the framework. If we only know the framework, we lose the ability to write our functionality, to fork existing projects and update them for our own purposes, and in general to create something new. We become consumers and aggregators of functionality instead of creators.
That raises a question: Is core JavaScript more performant— in terms of run time performance—than using a framework? Logically it would seem so, but let’s run through some examples to benchmark most common uses of frameworks, using JQuery as a point of comparison.
![]() Note JQuery is a JavaScript framework, created in 2006 by John Resig. Maintenance of JQuery was taken over by the JQuery Project in 2009. As of this writing JQuery is the most widely used JavaScript framework.
Note JQuery is a JavaScript framework, created in 2006 by John Resig. Maintenance of JQuery was taken over by the JQuery Project in 2009. As of this writing JQuery is the most widely used JavaScript framework.
JQuery vs JavaScript: Looping
Let’s start by comparing the timing of loops, for loops in JavaScript versus .each in JQuery. Create a new page called jquerycomparison.html. In jquerycomparison.html you’ll start with an empty skeletal HTML document and include jQuery and perfLogger. Also include our populateArray function:
<!DOCTYPE html>

<html>

<head>

<meta charset="UTF-8" />

<title>Framework Comparison</title>

<script src="jquery.js"></script>

<script src="/lab/perfLogger.js"></script>

<script>

function populateArray(len){

          var retArray = new Array(len)

          for(var i = 0; i < len; i++){

               retArray[i] = i;
          }

          return retArray

}

</script>


</head>

<body>

</body>

</html>
Next create a function called JQueryEach that loops through tempArray using JQuery.each. Then pass that function to perfLogger.logBenchmark to benchmark it.
function JQueryEach(){

     jQuery.each(tempArray, function(i, val) {

     });

}

perfLogger.logBenchmark("JQueryEach_benchmark", 10, JQueryEach, true, true);
Finally, create a function called JSForLoop to loop through a for loop using the prior optimization of caching the length property of the iteration, and pass that function into perfLogger.logBenchmark:
function JSForLoop(){

     var l = tempArray.length

     for(var i = 0; i < l; i++) {

     }

}

perfLogger.logBenchmark("JSForLoop_benchmark", 10, JSForLoop, true, true);
Your complete page should now look like this:
<!DOCTYPE html>

<html>

<head>

<meta charset="UTF-8" />

<title>Framework Comparison</title>

<script src="jquery.js"></script>

<script src="/lab/perfLogger.js"></script>

<script>

function populateArray(len){

          var retArray = new Array(len)

          for(var i = 0; i < len; i++){

               retArray[i] = i;

          }

          return retArray

}

</script>

</head>

<body>

<script>

tempArray = populateArray(400);


//benchmark timing data for JQuery .each loop
function JQueryEach(){

     jQuery.each(tempArray, function(i, val) {

     });

}

perfLogger.logBenchmark("JQueryEach_benchmark", 10, JQueryEach, true, true);


//benchmark timing data for JS for loop


function JSForLoop(){

     var l = tempArray.length

     for(var i = 0; i < l; i++) {

     }

}

perfLogger.logBenchmark("JSForLoop_benchmark", 10, JSForLoop, true, true);


</script>


</body>

</html>
When you look at the test page in a browser, you should see something like the following:
benchmarking function JQueryEach(){ jQuery.each(tempArray, function(i, val) { });      }

average run time: 0.10279999987687916ms

path: http://tom-barker.com/lab/jquerycomparison.html

useragent: Mozilla/5.0 (Macintosh; Intel Mac OS X 10_5_8) AppleWebKit/536.11 (KHTML, like Gecko)

Chrome/20.0.1132.47 Safari/536.11

benchmarking function JSForLoop(){ var l = tempArray.length for(var i = 0; i < l; i++) { } }

average run time: 0.0035999983083456755ms

path: http://tom-barker.com/lab/jquerycomparison.html

useragent: Mozilla/5.0 (Macintosh; Intel Mac OS X 10_5_8) AppleWebKit/536.11 (KHTML, like Gecko)

Chrome/20.0.1132.47 Safari/536.11
Wow! That’s orders of magnitude difference. Let’s chart this in R.
Just as in the previous tests, create variables to hold the average values for each test for each browser:
avg_jquery_loop_chrome <- mean(getDFByBrowser(ParseResultsbyTestID("JQueryEach_benchmark"),

"Chrome")$RunTime)


avg_for_loop_chrome <- mean(getDFByBrowser(ParseResultsbyTestID("JSForLoop_benchmark"),

"Chrome")$RunTime)


avg_jquery_loop_firefox <- mean(getDFByBrowser(ParseResultsbyTestID("JQueryEach_benchmark"),

"Firefox")$RunTime)


avg_for_loop_firefox <- mean(getDFByBrowser(ParseResultsbyTestID("JSForLoop_benchmark"),

"Firefox")$RunTime)
Once again, create a data frame to hold the average values, and assign column names to the data frame:
jquery_comparison <- data.frame(avg_jquery_loop_chrome, avg_for_loop_chrome, avg_jquery_loop_

firefox, avg_for_loop_firefox)


colnames(jquery_comparison) <- c("Chrome
JQuery", "Chrome
Javascript", "Firefox
JQuery",

"Firefox
JavaScript")
And finally, chart out the data frame:
barplot(as.matrix(jquery_comparison), main="Comparison of average benchmark time
for looping

in JQuery vs core JavaScript
in milliseconds")
The finished R code should look like this:
avg_jquery_loop_chrome <- mean(getDFByBrowser(ParseResultsbyTestID("JQueryEach_benchmark"),

"Chrome")$RunTime)


avg_for_loop_chrome <- mean(getDFByBrowser(ParseResultsbyTestID("JSForLoop_benchmark"),

"Chrome")$RunTime)


avg_jquery_loop_firefox <- mean(getDFByBrowser(ParseResultsbyTestID("JQueryEach_benchmark"),

"Firefox")$RunTime)


avg_for_loop_firefox <- mean(getDFByBrowser(ParseResultsbyTestID("JSForLoop_benchmark"),

"Firefox")$RunTime)


jquery_comparison <- data.frame(avg_jquery_loop_chrome, avg_for_loop_chrome, avg_jquery_loop_

firefox, avg_for_loop_firefox)


colnames(jquery_comparison) <- c("Chrome
JQuery", "Chrome
Javascript",

"Firefox
JQuery", "Firefox
JavaScript")


barplot(as.matrix(jquery_comparison), main="Comparison of average benchmark time
for looping

in JQuery vs core JavaScript
in milliseconds")
This creates the chart that we see in Figure 7-5.
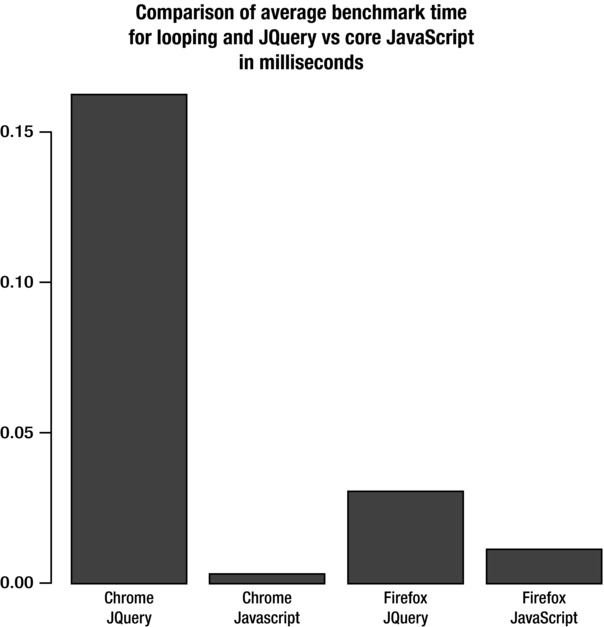
Figure 7-5. Comparison of benchmark results for looping with JQuery versus looping with core JavaScript, by browser
There is a 63.4% performance improvement for Firefox:
> (1 - (avg_for_loop_firefox / avg_jquery_loop_firefox)) * 100

[1] 63.4
But a 98.2% improvement in Chrome:
> (1 - (avg_for_loop_chrome / avg_jquery_loop_chrome)) * 100

[1] 98.2
RESPECTING THE DRY PRINCIPLE
JQuery vs JavaScript: DOM Access
Next let’s compare the cost of DOM interaction, with JQuery and with pure JavaScript. You’ll create a test that compares the time it takes to loop through an array and write the value from the array to a div on the page both using JQuery and using JavaScript.
First create the skeletal structure of the page, with JQuery, perfLogger, and our populateArray function included in the head:
<!DOCTYPE html>

<html>

<head>

<meta charset="UTF-8" />
<title>Framework Comparison</title>

<script src="jquery.js"></script>

<script src="/lab/perfLogger.js"></script>

<script>

function populateArray(len){

          var retArray = new Array(len)

          for(var i = 0; i < len; i++){

               retArray[i] = i;

          }

          return retArray

}

</script>

</head>

<body>

</body>

</html>
Next you’ll include two divs on the page, one with an id of DOMtest, where the JavaScript test will write to the JavaScript case, and the other with an id of JQueryDomtest, where the JQuery test will writeo.
<div id="DOMtest"><p>Dom Test</p></div>

<div id="JQueryDomtest"><p>JQuery Dom Test</p></div>
Then add in a script tag, and within the script tag create a tempArray of size 400. Also add a function called JQueryDOM that will loop through the array and append the index number to the JQueryDomtest div. Finally, benchmark this function using perfLogger.logBenchmark.
<script>

tempArray = populateArray(400);


function JQueryDOM(){

     var l = tempArray.length

     for(var i = 0; i < l; i++) {

          $("#JQueryDomtest").append(i);

     }

}

perfLogger.logBenchmark("JQueryDOM_benchmark", 10, JQueryDOM, true, true);
Next create a function called JSDOM, which iterates through tempArray, using document.getElementById to access the div and innerHTML to append the content to the div. And finally, use perfLogger.logBenchmark to benchmark this function:
function JSDOM(){

     var l = tempArray.length

     for(var i = 0; i < l; i++) {

          document.getElementById("DOMtest").innerHTML += i;

     }

}

perfLogger.logBenchmark("JSDOM_benchmark", 10, JSDOM, true, true);


</script>
The complete page looks like this:
<!DOCTYPE html>

<html>

<head>

<meta charset="UTF-8" />

<title>Framework Comparison</title>

<script src="jquery.js"></script>

<script src="/lab/perfLogger.js"></script>

<script>

function populateArray(len){

          var retArray = new Array(len)

          for(var i = 0; i < len; i++){

               retArray[i] = i;

          }

          return retArray

}

</script>

</head>

<body>

<div id="DOMtest"><p>Dom Test</p></div>

<div id="JQueryDomtest"><p>JQuery Dom Test</p></div>

<script>

tempArray = populateArray(400);


//benchmark timing data for JQuery DOM access


function JQueryDOM(){

     var l = tempArray.length

     for(var i = 0; i < l; i++) {

          $("#JQueryDomtest").append(i);

     }

}

perfLogger.logBenchmark("JQueryDOM_benchmark", 10, JQueryDOM, true, true);


//benchmark timing data for JS DOM access


function JSDOM(){

     var l = tempArray.length

     for(var i = 0; i < l; i++) {

          document.getElementById("DOMtest").innerHTML += i;

     }

}

perfLogger.logBenchmark("JSDOM_benchmark", 10, JSDOM, true, true);


</script>

</body>

</html>
When you view this in a browser, you see the following.
benchmarking function JQueryDOM(){ var l = tempArray.length for(var i = 0; i < l; i++) {

$("#JQueryDomtest").append(i); } }

average run time: 0.4493000014917925ms

path: http://tom-barker.com/lab/jquery_dom_compare.html

useragent: Mozilla/5.0 (Macintosh; Intel Mac OS X 10_5_8) AppleWebKit/536.11 (KHTML, like Gecko)

Chrome/20.0.1132.47 Safari/536.11


benchmarking function JSDOM(){ var l = tempArray.length for(var i = 0; i < l; i++) { document.

getElementById("DOMtest").innerHTML += i; } }

average run time: 0.19499999471008778ms

path: http://tom-barker.com/lab/jquery_dom_compare.html

useragent: Mozilla/5.0 (Macintosh; Intel Mac OS X 10_5_8) AppleWebKit/536.11 (KHTML, like Gecko)

Chrome/20.0.1132.47 Safari/536.11
Note that as for every test result, your individual results may vary, depending on the browser and system used.
Let’s plot this in R. With our new function, it takes only one line to do this, by passing in a list of the names of the tests we want, JQueryDOM_benchmark and JSDOM_benchmark.
PlotResultsofTestsByBrowser(c("JQueryDOM_benchmark", "JSDOM_benchmark"), c("Chrome","Firefox"),

"Comparison of average benchmark time
for using JQuery to access the DOM versus pure

JavaScript
in milliseconds")
This creates the bar chart shown in Figure 7-6.

Figure 7-6. Comparison of benchmark results for DOM interaction with JQuery and with JavaScript, by browser
That’s a 60% improvement for Chrome and a 93% improvement for Firefox, just by using core JavaScript instead of JQuery.
The True Cost of Eval
If you aren’t familiar with it, eval is a JavaScript native function that accepts a string and executes the string as JavaScript. It basically fires up the interpreter and allows the passed-in string to be parsed and interpreted at the time of invocation.
We’ve all heard that eval is evil and should be avoided at all cost1. The rationale is that it is potentially dangerous because it is essentially injecting code directly to the interpreter, and that because the interpreter is being accessed it causes a hit on performance. It’s become good practice over the years to avoid the use of eval. Even in the cases where it was accepted and commonplace, like to de-serialize JSON, we now have standard solutions that don’t use eval.
I would contend that code injection is a perfectly legitimate solution sometimes, with a history that dates back to inlining assembler in C code for performance boosts and low-level control. Having a console available in our browser that lets us execute ad hoc code client-side also negates this aspect of the argument against eval.
But let’s quantify the impact on performance of this long held belief for ourselves. Let’s run a test that compares the run time performance of passing a string that contains a function to eval versus invoking the function directly.
Just as in our previous tests, start with our basic HTML skeletal structure, with perfLogger:
<!DOCTYPE html>

<html>

<head>

<meta charset="UTF-8" />

<title>Cache Location Comparison</title>

<script src="/lab/perfLogger.js"></script>

</head>

<body>

</body>

</html>
Next create a script tag in the body and a function called getAvg. The getAvg function iterates from 0 to 200, adds each consecutive number, and then averages it.
<script>

function getAvg(){

     var avg = 0;

     for(var x = 0; x < 200; x++){

          avg += x;

     }

     return(avg/200);

}
Create two functions, one that will convert the getAvg function to a string and pass it to eval and store the return value in a variable, and the other function that will simply invoke the getAvg function and store the result:
__________
function evalAverage(){

     var average = eval(getAvg.toString());

}


function invokeAverage(){

     var average = getAvg()

}
And finally call perfLogger.logBenchmark for each test, having it run each test 1000 times:
perfLogger.logBenchmark("EvalTime", 1000, evalAverage, true, true);


perfLogger.logBenchmark("InvokeTime", 1000, invokeAverage, true, true);
The completed page follows:
<!DOCTYPE html>

<html>

<head>

<meta charset="UTF-8" />

<title>Cache Location Comparison</title>

<script src="/lab/perfLogger.js"></script>

</head>

<body>

<script>

function getAvg(){

     var avg = 0;

     for(var x = 0; x < 200; x++){

          avg += x;

     }

     return(avg/200);

}


function evalAverage(){

     var average = eval(getAvg.toString());

}


function invokeAverage(){

     var average = getAvg()

}


perfLogger.logBenchmark("EvalTime", 1000, evalAverage, true, true);


perfLogger.logBenchmark("InvokeTime", 1000, invokeAverage, true, true);

</script>

</body>

</html>
In the browser you see the following results:
benchmarking function evalAverage(){ var average = eval(getAvg.toString()); }

average run time: 0.03299599998717895ms

path: http://tom-barker.com/lab/eval_comparison.html
useragent: Mozilla/5.0 (Macintosh; Intel Mac OS X 10_5_8) AppleWebKit/536.11 (KHTML, like Gecko)

Chrome/20.0.1132.47 Safari/536.11


benchmarking function invokeAverage(){ var average = getAvg() }

average run time: 0.004606999973475467ms

path: http://tom-barker.com/lab/eval_comparison.html

useragent: Mozilla/5.0 (Macintosh; Intel Mac OS X 10_5_8) AppleWebKit/536.11 (KHTML, like Gecko)

Chrome/20.0.1132.47 Safari/536.11
Great! Let’s point some users at the page or run it through our test lab and chart the data in R (see Figure 7-7):
PlotResultsofTestsByBrowser(c("EvalTime", "InvokeTime"), c("Chrome","Firefox"), "Comparison of
average benchmark time
for using Eval compared to Function invocation
in milliseconds")

Figure 7.7. Comparison of benchmark results for using eval versus direct function invocation, by browser
DOM Access
The browser makers are constantly working to make DOM access more efficient2, but the fact remains that DOM access involves interfacing with an aspect of the browser outside the JavaScript interpreter, the render engine, which makes it inherently the slowest part of JavaScript development.
But there are ways to optimize interaction with the DOM. Let’s look at some.
Queue Changes to DOM Elements
When we are making multiple changes to the content of a DOM element, we can queue those changes and then append them to the element at once. Let’s take a look at an example of this.
Start with a skeletal HTML structure, our perfLogger library, and our populateArray function as in the previous tests. In the body of the page, add a div with an id of DOMtest and a script tag. In the script tag, create tempArray.
<div id="DOMtest"><p>Dom Test</p></div>

<script>

tempArray = populateArray(400);

</script>
So with all of the setup out of the way, you’ll create a function called sequentialWrites().This function will loop through tempArray and update the innerHTML of DOMtest each step in the iteration. You’ll then benchmark this function:
function sequentialWrites(){

     var l = tempArray.length

     for(var i = 0; i < l; i++) {

          document.getElementById("DOMtest").innerHTML += i;

     }

}

perfLogger.logBenchmark("SequentialWrites", 10, sequentialWrites, true, true);
Next create a function, called queueWrites, that will loop through tempArray, but at each step through the iteration will instead concatenate the changes to a string variable. After the loop is complete, the function will insert the updated string variable into the div. Finally, benchmark the queueWrites function:
function queueWrites(){

     var l = tempArray.length,

          writeVal = "";

     for(var i = 0; i < l; i++) {

          writeVal += i

     }

     document.getElementById("DOMtest").innerHTML += writeVal;

}

perfLogger.logBenchmark("QueueWrites", 10, queueWrites, true, true);
Your complete test script should look like the following.
<div id="DOMtest"><p>Dom Test</p></div>

<script>

tempArray = populateArray(400);
//benchmark timing data for JS DOM access

function sequentialWrites(){

     var l = tempArray.length

     for(var i = 0; i < l; i++) {

          document.getElementById("DOMtest").innerHTML += i;

     }

}

perfLogger.logBenchmark("SequentialWrites", 10, sequentialWrites, true, true);


//benchmark timing data for JS DOM access

function queueWrites(){

     var l = tempArray.length,

          writeVal = "";

     for(var i = 0; i < l; i++) {

          writeVal += i

     }

     document.getElementById("DOMtest").innerHTML += writeVal;

}

perfLogger.logBenchmark("QueueWrites", 10, queueWrites, true, true);


</script>
__________
In the browser you should see something like the following results:
benchmarking function sequentialWrites(){ var l = tempArray.length for(var i = 0; i < l; i++) {

document.getElementById("DOMtest").innerHTML += i; } }

average run time: 146.904400002677ms

path: http://tom-barker.com/lab/dom_interactions.html

useragent: Mozilla/5.0 (Macintosh; Intel Mac OS X 10_5_8) AppleWebKit/536.11 (KHTML, like Gecko)

Chrome/20.0.1132.47 Safari/536.11


benchmarking function queueWrites(){ var l = tempArray.length, writeVal = ""; for(var i = 0; i < l;

i++) { writeVal += i } document.getElementById("DOMtest").innerHTML += writeVal; }

average run time: 2.8286000015214086ms

path: http://tom-barker.com/lab/dom_interactions.html

useragent: Mozilla/5.0 (Macintosh; Intel Mac OS X 10_5_8) AppleWebKit/536.11 (KHTML, like Gecko)

Chrome/20.0.1132.47 Safari/536.11
That’s a significant difference between the sequential and queued write—146 milliseconds versus 2.8 milliseconds. But that’s for an individual test. Let’s chart these results at scale in R.
If you plug the following into our R console, you’ll get the chart shown in Figure 7-8. The difference in scale between the two tests is so significant that we lose almost all granular details of the smaller number when compared to the larger.
PlotResultsofTestsByBrowser(c("SequentialWrites", "QueueWrites"), c("Chrome","Firefox"),

"Comparison of average benchmark time
 Sequential DOM element updates versus Queued DOM

element updates
in milliseconds")
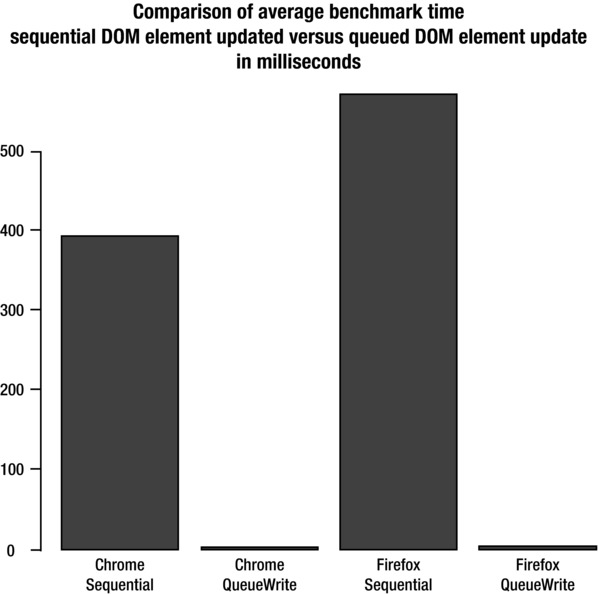
Figure 7-8. Results of individual writes to the DOM compared to a single queued write
Queue Adding New Node
Let’s apply the same principle when adding new nodes to the DOM. When we need to add multiple DOM elements to a page we can queue the creation of these elements, add them to a DocumentFragment and then append the DocumentFragment to the page. As described in the W3C page at http://www.w3.org/TR/DOM-Level-2-Core/core.html#ID-B63ED1A3, a DocumentFragment is a lightweight Document object. Its intended use is to be a staging environment for Document changes, and once all changes are staged in a DocumentFragment, we simply copy the nodes in the DocumentFragment to the Document. Let’s explore a test of this concept.
We’ll use the same page as our queued versus sequential DOM write test and just add some new tests to benchmark.
First create a function called useAppendChild. This function will loop through tempArray, at each step through creating a new script element and append it to the head of the document. Then benchmark the function:
function useAppendChild(){

     var l = tempArray.length,

          writeVal = "";

     for(var i = 0; i < l; i++) {

          window.document.getElementsByTagName('HEAD')[0].appendChild(window.document.

createElement('SCRIPT'));

     }

}

perfLogger.logBenchmark("AppendChildWrites", 10, useAppendChild, true, true);
Finally, create a function useDocFragments to do the same thing, except that instead of appending to the Document it should append to a DocumentFragment. Once the loop is complete, merge the changes from DocumentFragment to the Document:
<script>


//documentfragment vs append child for multiple updates

function useDocFragments(){

     var l = tempArray.length,

          writeVal = "",

          frag = document.createDocumentFragment();

     for(var i = 0; i < l; i++) {

               frag.appendChild(window.document.createElement('SCRIPT'));

          }

     window.document.getElementsByTagName('HEAD')[0].appendChild(frag.cloneNode(true));

}

perfLogger.logBenchmark("DocFragmentWrites", 10, useDocFragments, true, true);
The complete code from these tests is as follows:
<script>

function useAppendChild(){

     var l = tempArray.length,

          writeVal = "";

     for(var i = 0; i < l; i++) {

          window.document.getElementsByTagName('HEAD')[0].appendChild(window.document.
createElement('SCRIPT'));

     }

}

perfLogger.logBenchmark("AppendChildWrites", 10, useAppendChild, true, true);


</script>
When you view these tests in a browser, you should see something like the following:
benchmarking function useDocFragments(){ var l = tempArray.length, writeVal = "", frag =

document.createDocumentFragment(); for(var i = 0; i < l; i++) { frag.appendChild(window.

document.createElement('SCRIPT')); } window.document.getElementsByTagName('HEAD')[0].

appendChild(frag.cloneNode(true));      }

average run time: 2.3462999932235107ms

path: http://localhost:8888/lab/chapter7/dom_interactions.html

useragent: Mozilla/5.0 (Macintosh; Intel Mac OS X 10_5_8) AppleWebKit/536.11 (KHTML, like Gecko)

Chrome/20.0.1132.47 Safari/536.11


benchmarking function useAppendChild(){ var l = tempArray.length, writeVal = ""; for(var i = 0;

i < l; i++) { window.document.getElementsByTagName('HEAD')[0].appendChild(window.document.

createElement('SCRIPT')); }      }

average run time: 2.593400003388524ms

path: http://localhost:8888/lab/chapter7/dom_interactions.html

useragent: Mozilla/5.0 (Macintosh; Intel Mac OS X 10_5_8) AppleWebKit/536.11 (KHTML, like Gecko)

Chrome/20.0.1132.47 Safari/536.11
To chart this test run at scale, use the following call to PlotResultsofTestsByBrowser to generate the chart shown in Figure 7-9. You can see that using DocumentFragment gives a 9.6% performance increase in Chrome and a 10% increase in Firefox.
PlotResultsofTestsByBrowser(c("AppendChildWrites","DocFragmentWrites"), c("Chrome","Firefox"),

"Comparison of average benchmark time
 Individual append child calls vs document fragment
in
milliseconds")
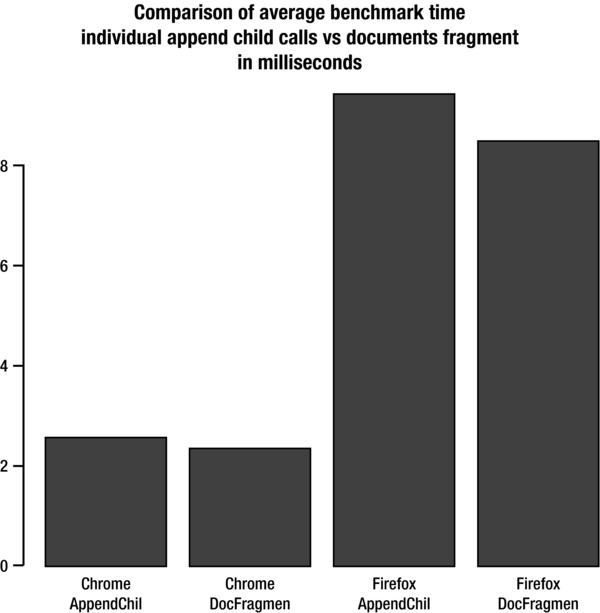
Figure 7-9. Comparison of benchmark results for multiple additions to DOM versus single DOM interaction via DocumentFragment, by browser
The Cost of Nested Loops
We know that loops in general cost more in performance than unfurling the code and executing it sequentially. This is because each loop is synchronous and blocks execution of the rest of the application until it is complete. As you saw in Chapter 2, that was one of Google’s Closure Compiler’s optimizations, and Chapter 8 explores that concept. But even more expensive than loops are nested loops.
There are ways to avoid nested loops, such as loop unwinding, as Closure Compiler does, or loop fusion, where we merge the execution of the sub-loops into a single loop. But to see why we would do that let’s explore the cost of nested loops.
Make a new page, starting out with the basic HTML skeletal structure, with the perfLogger library and populateArray function. In the body of the page, create a script tag and our tempArray variable.
Within the script tag you will create functions, each with increasing depth of nested loops. The twoLoopsDeep function has a nested loop, threeLoopsDeep has a loop with two nested loops, and so on until we get to fiveLoopsDeep.
Finally, you’ll benchmark each function. To be able to test these in a browser, you’ll need to keep the number of times we run the functions low; otherwise you’ll get slow script warnings or even crash the browser.
<script>

tempArray = populateArray(20);


function twoLoopsDeep(){

     var l = tempArray.length;

     for(var a = 0; a < l; a++){

          for(var b = 0; b < l; b++){

          }

     }

}


function threeLoopsDeep(){

     var l = tempArray.length;

     for(var a = 0; a < l; a++){

          for(var b = 0; b < l; b++){

               for(var c = 0; c < l; c++){

               }

          }

     }

}


function fourLoopsDeep(){

     var l = tempArray.length;

     for(var a = 0; a < l; a++){

          for(var b = 0; b < l; b++){

               for(var c = 0; c < l; c++){

                    for(var d = 0; d < l; d++){

                    }

               }

          }

     }

}


function fiveLoopsDeep(){

     var l = tempArray.length;

     for(var a = 0; a < l; a++){

          for(var b = 0; b < l; b++){

               for(var c = 0; c < l; c++){

                    for(var d = 0; d < l; d++){

                         for(var e = 0; e < l; e++){

                         }

                    }

               }
          }

     }

}


perfLogger.logBenchmark("TwoLoops", 10, twoLoopsDeep, true, true);

perfLogger.logBenchmark("ThreeLoops", 10, threeLoopsDeep, true, true);

perfLogger.logBenchmark("FourLoops", 10, fourLoopsDeep, true, true);

perfLogger.logBenchmark("FiveLoops", 10, fiveLoopsDeep, true, true);

</script>
When you view the page in a browser you should see the following:
benchmarking function oneLoop(){ var l = tempArray.length; for(var a = 0; a < l; a++){ } }

average run time: 0.008299996261484921ms

path: http://tom-barker.com/lab/cyclomaticcomplexity.html

useragent: Mozilla/5.0 (Macintosh; Intel Mac OS X 10_5_8) AppleWebKit/536.11 (KHTML, like Gecko)

Chrome/20.0.1132.47 Safari/536.11


benchmarking function twoLoopsDeep(){ var l = tempArray.length; for(var a = 0; a < l; a++){

for(var b = 0; b < l; b++){ } } }

average run time: 0.012399998377077281ms

path: http://tom-barker.com/lab/cyclomaticcomplexity.html

useragent: Mozilla/5.0 (Macintosh; Intel Mac OS X 10_5_8) AppleWebKit/536.11 (KHTML, like Gecko)

Chrome/20.0.1132.47 Safari/536.11


benchmarking function threeLoopsDeep(){ var l = tempArray.length; for(var a = 0; a < l; a++){

for(var b = 0; b < l; b++){ for(var c = 0; c < l; c++){ } } } }

average run time: 0.06290000164881349ms

path: http://tom-barker.com/lab/cyclomaticcomplexity.html

useragent: Mozilla/5.0 (Macintosh; Intel Mac OS X 10_5_8) AppleWebKit/536.11 (KHTML, like Gecko)

Chrome/20.0.1132.47 Safari/536.11


benchmarking function fourLoopsDeep(){ var l = tempArray.length; for(var a = 0; a < l; a++){

for(var b = 0; b < l; b++){ for(var c = 0; c < l; c++){ for(var d = 0; d < l; d++){ } } } } }

average run time: 1.022299993201159ms

path: http://tom-barker.com/lab/cyclomaticcomplexity.html

useragent: Mozilla/5.0 (Macintosh; Intel Mac OS X 10_5_8) AppleWebKit/536.11 (KHTML, like Gecko)

Chrome/20.0.1132.47 Safari/536.11


benchmarking function fiveLoopsDeep(){ var l = tempArray.length; for(var a = 0; a < l; a++){

for(var b = 0; b < l; b++){ for(var c = 0; c < l; c++){ for(var d = 0; d < l; d++){ for(var e =
0; e < l; e++){ } } } } } }

average run time: 6.273999999393709ms

path: http://tom-barker.com/lab/cyclomaticcomplexity.html

useragent: Mozilla/5.0 (Macintosh; Intel Mac OS X 10_5_8) AppleWebKit/536.11 (KHTML, like Gecko)

Chrome/20.0.1132.47 Safari/536.11
Now let’s chart the data in R! If we plot out two to five loops in a single chart, we lose the perspective between each incremental increase, so at first we’ll chart out two to three then four to five. Then finally we’ll look at the full scope of two to five loops in a single browser.
First look at the increase in latency between two and three loops:
PlotResultsofTestsByBrowser(c("TwoLoops","ThreeLoops"), c("Chrome","Firefox"), "Comparison of

average benchmark time
 For Increasing Depth of Nested Loops
in milliseconds")
This creates the chart we see in Figure 7-10.
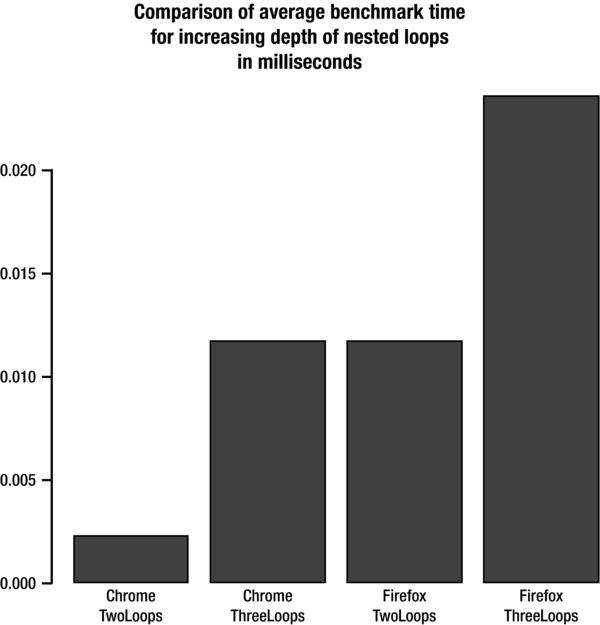
Figure 7-10. Comparison of performance impact for increasing nesting of loops from two to three, by browser
That’s a 420% increase in latency for Chrome and a 103% increase for Firefox.
Next plot the increase in latency between four and five nested loops:
PlotResultsofTestsByBrowser(c("FourLoops","FiveLoops"), c("Chrome","Firefox"), "Comparison of

average benchmark time
 For Increasing Depth of Nested Loops
in milliseconds")
This creates the chart that we see in Figure 7-11.
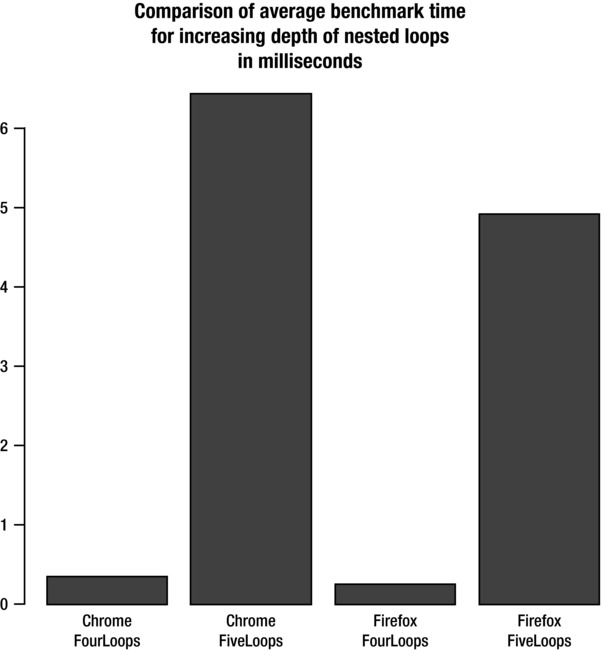
Figure 7-11. Comparison of performance impact for increasing nesting of loops from four to five, by browser
That’s a 1774% increase for Chrome and an 1868% increase for Firefox!
And finally, you can look at the larger picture, from two to five loops to appreciate the full scale of the impact on performance:
PlotResultsofTestsByBrowser(c("TwoLoops", "ThreeLoops", "FourLoops","FiveLoops"), c("Chrome"),

"Comparison of average benchmark time
 For Increasing Depth of Nested Loops
in milliseconds")
This creates the chart shown in Figure 7-12.
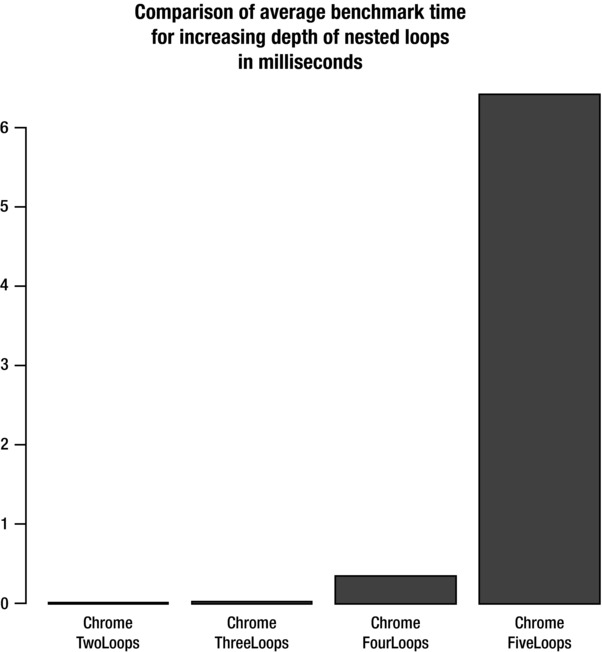
Figure 7-12. Comparison of benchmark results for nested for loops in Chrome
This is a 285677% increase in latency!
So we can see the true cost of incrementally increasing the number of loops deep that we nest. From our findings we see that as soon as we make the leap from two loops deep to three, the performance impact is dramatic and just increases exponentially as we nest deeper.
Summary
This chapter took a deep dive into runtime performance, exploring concepts like taking variables and properties in other scope chains and storing them locally to avoid the performance hit of retrieving across the scope stack.
you learned about the benefit of using pure JavaScript instead of frameworks for everything, and compared benchmark results from looping and DOM access using JQuery and JavaScript to prove the performance gain from doing so.
One example quantified the cost of using eval compared to directly invoking a function. This speaks to the performance benefit we gather from using functions as parameters instead of passing strings and passing them to eval. You also saw that eval might not be as evil as has been the long-standing belief.
You saw the performance benefits from queueing writes to the DOM, both updates to DOM elements and using DocumentFragment objects to queue adding new DOM elements.
And finally we quantified the increase in latency we get from increasing the depth of nested loops.
Chapter 8 talks about balancing performance with readability and modularity.