
CHAPTER 3
![]()
WPTRunner—Automated Performance Monitoring and Visualization with WebPagetest
The last chapter laid a good amount of ground work that we will be building upon throughout the rest of the book. We looked at how to generate waterfall charts with Firebug and YSlow, and use them as debugging tools. We explored some of the extensive features and functionality of WebPagetest. We talked about the concept of minifying JavaScript and ran a multivariate test to compare the results of several minifying tools. We closed the chapter by learning about R and writing a script to visualize the results of our multivariate test.
This chapter expands on those concepts. You will be hooking into the API provided by WebPagetest to automate monitoring of a number of URLs, and using R to visualize those results.
You will essentially create a framework that will allow you to monitor the web performance of your sites. By also plugging in specific URLs, you can run multivariate test across URLs, and compare the impact to performance that feature updates or ad choices may have on our sites.
Architecture
Let’s start by fleshing out an architecture. I usually start a project by standing in front of a whiteboard and working out high-level concepts and use cases using UML. Or I’ll open up Omnigraffle or Visio or some other flow-charting application and work on an architecture document. For this you will create a UML sequence diagram to show the interactions between the objects or processes in the system.
As you saw in the last chapter, WebPagetest is a robust web application that will provide detailed web performance information. It also exposes an API that you can invoke to fire off a test. With this in mind you know that you’ll need something to call the API, and get the response back.
You also know that you will need to parse the response that comes back from WebPagetest, so let’s create three processes in the architecture document: one to represent WebPagetest, one to call the API, and one to process the response.
Let’s call the process that calls the pagetest API run_wpt and the process that handles the result, process_wpt_response. So far our sequence diagram should look like Figure 3-1.

Figure 3-1. First iteration of sequence diagram
This is a great start. You know from our experience with WebPagetest last chapter that tests run in WPT are not usually run instantaneously. You have to get into a queue, and even when you are in the front of the queue the test itself takes a little while. This is to be expected because the test isn’t simulating the experience; it is really loading the site in the agent that you choose.
What this means tactically is that when you call the API, it returns a URL that you can poll that will indicate when the test is complete. This is important to note because you’ll want to save the returned URLs that you get and be able to reference them again and again, until the test is complete, so you’ll want to store them in a flat file. You’ll tail the values to the flat file; that is, you’ll append the newest values to the end of the file. To keep it simple you can use a flat file that you’ll call webpagetest_responses.txt.
You’ll also use a flat file to store the test results once the tests complete. You will call this flat file wpo_log.txt. The final piece you’ll need is an R script to read wpo_log.txt and generate the chart.
If you add these additional parts to the sequence diagram, your finished architecture document should look like Figure 3-2.

Figure 3-2. Finished WPTRunner sequence diagram
For this example you will create PHP files to automate the run_wpt and process_wpt_response processes, but realistically you could have used almost any language.
For this project create the following directory structure:
/data - to hold our flat files

/util - to hold our shared files and utilities

/charts - to hold the charts that we generate in R
Creating a Shared Configuration File
Before you begin, you need a key to access the WebPagetest API. Per the API documentation at https://sites.google.com/a/webpagetest.org/docs/advanced-features/webpagetest-restful-apis, you can obtain a key by emailing the site owner, Pat Meenan, at [email protected]. It may take a day or two or longer to receive your key. Once you have an API key you should create a separate file to hold all of the configuration information that you will need to share between processes.
The key you will store as a string:
$key = "[your key here]";
You know that you’ll want to store the API key in this shared file, but there are also some other things you’ll want to store.
Since the point of this framework is to programmatically test a series of URLs over time, you should create a mechanism for storing URLs. Be they URLs that hold experimental features or configurations, or just regular site monitoring, you will store all of the URLs in an array:
$urls_to_benchmark = array("tom-barker.com", "apress.com/", "amazon.com", "apple.com", "google.

com");
Finally you want to store paths to all of the flat files that you will need to reference:
You can call this shared file wpt_credentials_urls.php. It should live in the /util directory, and it should look like this:
<?php

$key = "xxxx"; // our API key

$urls_to_benchmark = array("tom-barker.com", "apress.com/", "amazon.com", "apple.com", "google.

com"); // our list of URLs to monitor

$csvFiles = "/WPTRunner/data/webpagetest_responses.txt";  // flat file to store response URLs

$wpologfile = "/WPTRunner/data/wpo_log.txt"; // flat file to store test results

?>
From the architecture document you also know that you will need to be writing to a couple of flat files. It may be a good idea to make another shared file to handle at a minimum, file writing. So let’s create a file called fileio.php, also in the /util directory.
In fileio.php you will make a function called appendToFile() that you pass a file path and data into. The function will check if the passed in file exists, if it does it will append the passed in data to the file, if it does not exist it will create the file and write the passed in data to it.
<?php

function appendToFile($data, $file){

     echo "writing to file $file
";

     $writeFlag = "w";

     if(file_exists($file)){

            $writeFlag = "a";

     }

     $fh = fopen($file, $writeFlag) or die("can't open file");

     fwrite($fh, $data . "
");

     fclose($fh);

}


?>
So far you’ve laid out the architecture of the system and created external files to hold configuration information and common functionality. Let’s start to flesh out the system itself.
Accessing the WebPagetest API
OK, let’s start out by coding the initial test request. The URL to access the WebPagetest is http://www.webpagetest.org/runtest.php. The API accepts a number of parameters, among them are:
url: The URL that you want to test.
location: This specifies the agent location, speed and browser to use for the test, formatted aslocation.browser:location. For example, the Dulles location with Chrome would beDulles.Chrome. IE is a little different, and IE 8, for instance, would be formattedDulles_IE8.
![]() Note The documentation is unclear on why Internet Explorer uses the underscore character, but this variation is good to keep in mind.
Note The documentation is unclear on why Internet Explorer uses the underscore character, but this variation is good to keep in mind.
runs: This specifies the number of tests to run.
fvonly: If you setfvonlyto 1, you get results only for the first view, and do not run the repeat view test.
private: Setting theprivateflag to 1 will make sure that the test is not displayed in the public list of tests.
block: This parameter allows you to set a comma separated list of block options. Remember from last chapter that you can specify URLs as well as types of files.
f: This specifies the format that the test result will be. It acceptsxmlandjson.
k: This is where you specify the public API key.
A sample call to the API would look like this:
http://www.webpagetest.org/runtest.php?f=xml&private=1&k=111 &url=tom-barker.com
You’ll create a new PHP file named run_wpt.php. The first thing you’ll do is to form the URL. You’ll import the shared configuration file to make sure you have access to the API key as well as the array of URLs:
require("util/wpt_credentials_urls.php");
Then you’ll create some variables to hold the API parameters. For this example you only care about the output format, which you’ll set to XML, and to make sure that our tests are kept private.
$outputformat = "xml";

$private = 1;
And finally you’ll create a new variable $wpt_url to store the API URL with the parameters concatenated to it, all except the URL parameter. You’ll get to the URL parameter next:
$wpt_url = "http://www.webpagetest.org/runtest.php?f=$outputformat&private=private&k=$key&url=";
To set the URL parameter you’ll need to iterate through the URL array that you set in wpt_credentials_urls.php.
for($x=0;$x<count($urls_to_benchmark); $x++){

}
As you step through this loop you’ll pull out each element one at a time, and concatenate it to $wpt_url. You’ll use PHP’s native function file_get_contents() to hit the URL and read the server’s response into a variable $wpt_response:
$wpt_response = file_get_contents($wpt_url . $urls_to_benchmark[$x]);
Remember, the API will return an XML structure that you will need to parse. The XML looks like this:
<response>

<statusCode>200</statusCode>

<statusText>Ok</statusText>

<data>

<testId></testId>

<ownerKey></ownerKey>

<xmlUrl></xmlUrl>

<userUrl></userUrl>

<summaryCSV></summaryCSV>

<detailCSV></detailCSV>

</data>

</response>
So you’ll convert the string that the API returns into an XML object using SimpleXMLElement() and store the result in $xml.
$wpt_response = file_get_contents($wpt_url . $urls_to_benchmark[$x]);

$xml = new SimpleXMLElement($wpt_response);
That will allow you to parse the result and pull out the necessary data. The first piece of data that you want to check is the statusCode node. That holds the HTTP status of the response. If that is a 200 to signify a good response you then pull get the xmlURL node value, which contains the URL of the test results once the test is complete, and write that to the flat file webpagetest_responses.txt.
if($xml->statusCode == 200){

    appendToFile($xml->data->xmlUrl, $csvFiles);

}
Your completed run_wpt.php file should look like this:
<?php

require("util/wpt_credentials_urls.php");

require("util/fileio.php");

$outputformat = "xml";

$private = 1;

$wpt_url = "http://www.webpagetest.org/runtest.php?f=$outputformat&private=private&k=$key&url=";


for($x=0;$x<count($urls_to_benchmark); $x++){

    $wpt_response = file_get_contents($wpt_url . $urls_to_benchmark[$x]);

    $xml = new SimpleXMLElement($wpt_response);

    if($xml->statusCode == 200){

        appendToFile($xml->data->xmlUrl, $csvFiles);

    }

}

?>
![]() Note Be sure to run run_
Note Be sure to run run_wpt.php from the command line, not from a browser. To run PHP files from the command line you simply invoke the PHP binary and specify the –f option along with the path to the file. The –f option tells the interpreter to read in the file, parse it and execute it. So to run run_wpt.php, type into the console:
And it should produce a flat file formatted like the following:
http://www.webpagetest.org/xmlResult/120528_SK_db5196c3143a1b81aacc30b2426cec71/

http://www.webpagetest.org/xmlResult/120528_TB_0ca4cfaa17613b0c2213b4e701c5a9dd/

http://www.webpagetest.org/xmlResult/120529_TN_8c20efe8c82a663917456f56aae7c235/

http://www.webpagetest.org/xmlResult/120529_6P_253e58b1cda284b9cf9a80becd19ef9f/
Parsing the Test Results
So far you have a flat file with a list of URLs that point to WebPagetest test results. These tests are not instantaneous, so you need to wait for them to complete before beginning to parse the results.
You can begin polling the test result URLs to see if they have completed. The test results are formatted as such:
<response>

<statusCode></statusCode>

<statusText></statusText>

<data>

<startTime></startTime>

</data>

</response>
To see if the test is complete, you check the statusCode node. A 100 status means that the test is pending, a 101 means that the test has started, and a 200 means the test is complete. Any 400 status code indicates an error.
With this in mind let’s start parsing the results!
First you’ll need to include the shared files so you have access to the fileio() function and the paths to the flat files:
require("util/wpt_credentials_urls.php");

require("util/fileio.php");
Next you’ll need to create a function to check the test results. Name the function readCSVurls() and have it accept two parameters: $csvFiles, which will reference the flat file webpagetest_responses.txt, which in turn holds the test result URLs, and $file, which will reference the flat file wpo_log.txt that will hold the values that you pull from the test results:
function readCSVurls($csvFiles, $file){

}
Within the function you’ll delete wpo_log if it exists. This is just for housekeeping purposes, since it is easier and less error-prone to simply rewrite your results than to check to see where you left off and insert there. Then check to make sure webpagetest_responses exists, and that it is readable. If it is, open the file and begin to loop through it:
unlink($file); //delete wpo_log

if (file_exists($csvFiles) && is_readable ($csvFiles)) { //if the file is there and readable

       $fh = fopen($csvFiles, "r") or die("
 can't open file $csvFiles");

       while (!feof($fh)) {}

}
So within this while loop, which is looping until it reaches the end of file, you will pull out each line of the file, which contains the test result URL. Take the URL and get the response from the server and store it in $tailEntry:
$line = fgets($fh);

$tailEntry = file_get_contents(trim($line));
If you get a response back, you convert it from a string value to an XML object named $xml:
if($tailEntry){

$xml = new SimpleXMLElement($tailEntry);
The response XML is structured like so:
<response>

     <statusCode></statusCode>

     <statusText></statusText>

     <requestId></requestId>

     <data>

          <runs></runs>

          <average>

               <firstView>

               </firstView>

               <repeatView>

               </repeatView>

          </average>

          <run>

               <id></id>

               <firstView>

                     <results>

                     </results>

                     <pages>

                     </pages>

                     <thumbnails>

                     </thumbnails>
                     <images>

                     </images>

                     <rawData>

                     </rawData>

               </firstView>

               <repeatView>

                    <results>

                    </results>

                    <pages>

                    </pages>

                    <thumbnails>

                    </thumbnails>

                    <images>

                    </images>

                    <rawData>

                    </rawData>

               </repeatView>

          </run>

     </data>

</response>
From this structure the first thing that concerns you is the statusCode node. If the statusCode is equal to 200, you know you have a good response and you can begin parsing up the XML. If it is not 200 you know the test is not complete and you should stop any further processing:
if($xml->statusCode == 200){


}else{

die("report not ready at webpagetest yet.
");

}
Out of this XML object you will pull the URL for the page that the test was run against, so you can use that as the row identifier. Then you will pull out the date the test was completed, the load time of the page, the total file size of the page, and the number of HTTP requests needed to form the page.
Then concatenate all these values into a single string, separated by commas, called $newline:
$url = $xml->data->run->firstView->results->URL;

$date = $xml->data->completed;

$loadtime = $xml->data->run->firstView->results->loadTime;

$bytes = $xml->data->run->firstView->results->bytesInDoc;

$httprequests = $xml->data->run->firstView->results->requests;

$newline = "$url, $date, $loadtime, $bytes, $httprequests";
![]() Note You are pulling the result data out of the
Note You are pulling the result data out of the firstView node. This is so that you can test the page uncached. If you want to test the cache version of the page, pull the data out of the repeatView node.
You then check to see if wpo_log exists. If it doesn’t exist—and the first time through the loop it won’t exist, because you delete it at the beginning of the function—you’ll need to format the flat file to have the necessary headers.
Let’s abstract that out to a function. For now you can put a stub function call in there called formatWPOLog(). After you finish the current function you’ll go back and define the implementation.
You then pass the $newline variable and the path to wpo_log to the shared function appendToFile:
if(!file_exists($file)){

formatWPOLog($file);

}

appendToFile($newline, $file);
Finally, once you are done pulling each line from webpagetest_responses, close the file:
There is only one thing left to do — define the implementation for the formatWPOLog() function. It should accept a path to a file, and append as the first line the text “url,day,date,loadtime,bytes,httprequests.” This first line will be the column headers:
function formatWPOLog($file){

   $headerline = "url, day, date, loadtime, bytes, httprequests";

   appendToFile($headerline, $file);

}
Complete Example
Your completed process_wpt_response file should look like this:
<?php


require("util/wpt_credentials_urls.php");

require("util/fileio.php");


function readCSVurls($csvFiles, $file){

   unlink($file);

   if (file_exists($csvFiles) && is_readable ($csvFiles)) {

       $fh = fopen($csvFiles, "r") or die("
 can't open file $csvFiles");

       while (!feof($fh)) {

           $line = fgets($fh);

           $tailEntry = file_get_contents(trim($line));

           if($tailEntry){

              $xml = new SimpleXMLElement($tailEntry);

              if($xml->statusCode == 200){

                 $url = $xml->data->run->firstView->results->URL;

                 $date = $xml->data->completed;

                 $loadtime = $xml->data->run->firstView->results->loadTime;

                 $bytes = $xml->data->run->firstView->results->bytesInDoc;

                 $httprequests = $xml->data->run->firstView->results->requests;

                 $newline = "$url, $date, $loadtime, $bytes, $httprequests";

                 if(!file_exists($file)){

                     formatWPOLog($file);

                 }

                 appendToFile($newline, $file);
              }else{

                  die("report not ready at webpagetest yet.
");

              }

          }

       }

     }

     fclose($fh);

}


function formatWPOLog($file){
  $headerline = "url, day, date, loadtime, bytes, httprequests";

  appendToFile($headerline, $file);

}


readCSVurls($csvFiles, $wpologfile);


?>
The output of process_wpt_response is the flat file wpo_log, which should now look something like this:
url, day, date, loadtime, bytes, httprequests

http://tom-barker.com, Tue, 29 May 2012 20:12:21 +0000, 10786, 255329, 42

http://apress.com/, Tue, 29 May 2012 20:12:47 +0000, 4761, 714655, 57

http://amazon.com, Tue, 29 May 2012 20:13:07 +0000, 2504, 268549, 94

http://apple.com, Tue, 29 May 2012 20:12:41 +0000, 3436, 473678, 38

http://google.com, Tue, 29 May 2012 20:12:50 +0000, 763, 182802, 13
Charting with R
Running run_wpt daily gives you a daily log, a comma-separated list of the load time, total payload, and number of HTTP requests for each URL that you want to track. That’s great, but it’s only part of the story. You can’t distribute that data and expect your audience to get the full story. It is up to you to represent that data visually.
So let’s use R to build a time series chart to show the change in performance. First let’s create a new R file. From the architecture diagram, you can see that it should be called wpo.R.
First create variables to hold the path to the data and chart directories:
dataDirectory <- "/Users/tbarke000/WPTRunner/data/"

chartDirectory <- "/Users/tbarke000/WPTRunner/charts/"
Then read in the contents of wpo_log and store it as a data frame named wpologs:
wpologs <- read.table(paste(dataDirectory, "wpo_log.txt", sep=""), header=TRUE, sep=",")
![]() Note This code uses the
Note This code uses the paste() function to concatenate the stored data directory to the file name to construct the full path to the file. In R there is no string concatenation operator as in most other languages. You must use the paste() function instead. This function accepts N number of strings to concatenate and a sep parameter that specifies a string to paste between the strings—for example, if you wanted to insert commas between each string, or some other sort of separator. In the example you specify an empty string.
In much the same way, you should create a variable to hold the path to the file that you will create for our chart. Call this variable wpochart, and also convert the data in the bytes column from bytes to kilobytes.
wpochart <- paste(chartDirectory, "WPO_timeseries.pdf", sep="")

wpologs$bytes <- wpologs$bytes / 1000 #convert bytes to KB
Parsing the Data
At this point you have the data loaded in, and you have paths set up to the chart you want to draw. Let’s take a look at the structure of the data. Type wpologs into the console and the data should be structured like so:
> wpologs

                    url  day                        date loadtime   bytes httprequests

1  http://tom-barker.com  Tue  29 May 2012 20:12:21 +0000    10786 255.329           42

2     http://apress.com/  Tue  29 May 2012 20:12:47 +0000     4761 714.655           57

3      http://amazon.com  Tue  29 May 2012 20:13:07 +0000     2504 268.549           94

4       http://apple.com  Tue  29 May 2012 20:12:41 +0000     3436 473.678           38

5      http://google.com  Tue  29 May 2012 20:12:50 +0000      763 182.802           13

6  http://tom-barker.com  Wed  30 May 2012 16:28:09 +0000     5890 256.169           42

7     http://apress.com/  Wed  30 May 2012 16:27:56 +0000     4854 708.577           57

8      http://amazon.com  Wed  30 May 2012 16:28:14 +0000     3045 338.276          112

9       http://apple.com  Wed  30 May 2012 16:27:58 +0000     3810 472.700           38

10     http://google.com  Wed  30 May 2012 16:28:09 +0000     1524 253.984           15
Think about what a time series chart is—you want to draw the performance metrics for each URL as a line over time. That means you will need to isolate the data for each URL. To do this, create a function called createDataFrameByURL(). You can pass in the wpologs data and the URL that you want to isolate:
createDataFrameByURL <- function(wpologs, url){

}
In this function you’ll create an empty data frame; this will be the data frame that you populate and return from the function:
df <- data.frame()
Next you will loop through the passed in wpologs data:
for (i in 1:nrow(wpologs)){}
Within the loop you will check the url column to see if it matches the passed-in URL value. If it does, add it to the new data frame that you made at the beginning of the function:
if(wpologs$url[i] == url){

    df <- rbind(df , wpologs[i,])

}
Then set the row name of the new data frame and return it from the function:
row.names(df) <- df$date

return(df)
Now that you have the function to isolate the WebPagetest results by URL, you will create new data frames for each unique URL that you want to chart.
tbdotcom <- createDataFrameByURL(wpologs, "http://tom-barker.com")

apr <- createDataFrameByURL(wpologs, "http://apress.com/")

amz <- createDataFrameByURL(wpologs, "http://amazon.com")

aapl <- createDataFrameByURL(wpologs, "http://apple.com")

ggl <- createDataFrameByURL(wpologs, "http://google.com")
If you inspect one of these new data frames in the console, you should see:
> tbdotcom

                                             url  day         date  loadtime    bytes

httprequests

29 May 2012 20:12:21 +0000 http://tom-barker.com  Tue  29 May 2012     10786  255.329

42

30 May 2012 16:28:09 +0000 http://tom-barker.com  Wed  30 May 2012      5890  256.169

42

31 May 2012 12:33:52 +0000 http://tom-barker.com  Thu  31 May 2012      5877  249.528

42

01 Jun 2012 17:58:19 +0000 http://tom-barker.com  Fri  01 Jun 2012      3671  255.337

42

03 Jun 2012 14:41:38 +0000 http://tom-barker.com  Sun  03 Jun 2012      5729  249.590

42
Plotting Load Time
Excellent! Let’s plot one of those columns now. The most important column is the page load time, so let’s do that one first. You’ll use the plot() function and pass in tbdotcom$loadtime. You’ll set the following options for plot():
type="l" so that we are drawing lines

xaxt="n" to not draw an x-axis

col="#ff0000" to make the line color red

ylab = "Load Time in Milliseconds" to set that as the label displayed on the y axis.
The call to the plot() function should look like this:
plot(tbdotcom$loadtime, ylim=c(2000,10000), type="l", xaxt="n", xlab="", col="#ff0000",

ylab="Load Time in Milliseconds")
If you hadn’t hidden the x axis, it would have appeared as a series of numbers since R defaults to displaying x-axis names as incrementing integers when it identifies the values as nominal ordinal factors. To get the dates to show up in the x axis, you need to draw a custom axis. Use the axis() function to do this. The first parameter that the axis function accepts is a number that indicates which axis to draw: 1 for the bottom, 2 for the left, 3 for the top, and 4 for the right side. The rest of the parameters are named values, including these:
at: The points where tick marks should be drawn
lab: The values to show as the axis labels, either a boolean or a vector of strings
tick: A boolean value to show or hide checkmarks
lty: The line type
lwd: The line width
You can also pass in graphical parameters. For more details, type ?axis or ?par at the console.
So you’ll use the axis() function to draw an x axis to show all of the dates, like so:
axis(1, at=1: length(row.names(tbdotcom)), lab= rownames(tbdotcom), cex.axis=0.3)
See Figure 3-3 for what the chart looks like so far.

Figure 3-3. Load time over time for tom-barker.com
This is excellent! Now let’s layer in the load time for the other URLs. You can draw lines using the line() function. It works very similar to the plot() function; you pass in an R object to plot, and choose the line type and color.
Let’s draw lines for the load time for each additional URL that you have been tracking.
lines(apr$loadtime, type="l", lty = 2, col="#0000ff")

lines(amz$loadtime, type="l", col="#00ff00")

lines(aapl$loadtime, type="l", col="#ffff00")

lines(ggl$loadtime, type="l", col="#ff6600")
Putting this together, the load time plot should now look like Figure 3-4.
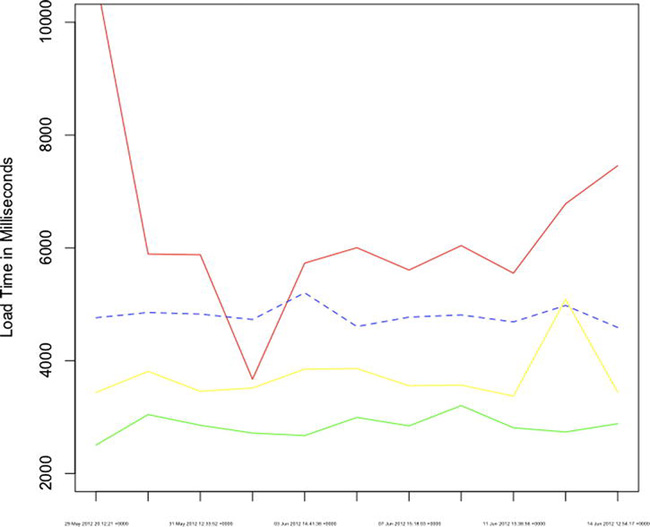
Figure 3-4. Load time time series chart
This is exciting, and ultimately the most important part of the data that you get from WebPagetest. But you want to also chart the other aspects of performance that you pulled from the test result, because they are contributors to the ultimate page load time. If you chart out the page size and the number of HTTP requests, you will paint a larger picture that shows indicators of page speed.
Plotting Payload and Number of HTTP Requests
The next chart adds those elements. The scales are different between each metric — page speed is in the thousands of milliseconds, the number of HTTP requests is in the tens, and file size is in the hundreds of bytes. You could normalize all of this data and show it in terms of standard deviations, but that would abstract the data from the actual numbers, and you need those numbers to debug any issues.
Instead, you’ll create a time series chart for each aspect of quality. BUT you’ll include these time series charts on one single graphic. The reason for this is to adhere to one of Edward Tufte’s principals of good data design—to make our graphic as dense with data as possible.
This code charts the remaining columns in our data frames, the bytes and httprequests columns, much the same way you charted the loadtime column:
plot(tbdotcom$bytes, ylim=c(0, 1000), type ="l", col="#ff0000", ylab="Page Size in KB", xlab="",

xaxt="n")

axis(1, at=1: length(row.names(tbdotcom)), lab= rownames(tbdotcom), cex.axis=0.3)
lines(apr$bytes, type="l", lty = 2, col="#0000ff")

lines(amz$bytes, type="l", col="#00ff00")

lines(aapl$bytes, type="l", col="#ffff00")

lines(ggl$bytes, type="l", col="#ff6600")


plot(tbdotcom$httprequests, ylim=c(10, 150), type ="l", col="#ff0000", ylab="HTTP Requests",

xlab="", xaxt="n")

axis(1, at=1: length(row.names(tbdotcom)), lab= rownames(tbdotcom), cex.axis=0.3)

lines(apr$httprequests, type="l", lty = 2, col="#0000ff")

lines(amz$httprequests, type="l", col="#00ff00")

lines(aapl$httprequests, type="l", col="#ffff00")

lines(ggl$httprequests, type="l", col="#ff6600")
Now add a legend so that you know what colors correspond to what URLS. First you’ll create vectors to hold the labels that you’ll use for each URL, and the corresponding colors.
WebSites <- c("tom-barker.com", "apress.com/", "amazon.com", "apple.com", "google.com")

WebSiteColors <- c("#ff0000", "#0000ff", "#00ff00", "#ffff00", "#ff6600")
Then create a new chart using plot, but pass “n” to the type parameter so that no line is drawn to the chart, and xaxt and yaxt to “n” so that no axes are drawn. But to this plot you’ll add a legend using the legend() function and pass in the label and color vectors just created:
plot(tbdotcom$httprequests, type ="n", xlab="", ylab="", xaxt="n", yaxt="n", frame=FALSE)

legend("topright", inset=.05, title="Legend", WebSites, lty=c(1,2,1,1,1,1,1,1,1,1,1,1,1,1,1,2),

col= WebSiteColors)
To draw all of these charts to the same graphic, wrap all of these calls to the plot() function in a call to par() that you pass in the named parameter mfrow. The mfrow parameter accepts a vector that specifies how many rows and columns should be drawn, so pass in c(2,2) to indicate two rows and two columns:
par(mfrow=c(2,2))
This should produce the graphic shown in Figure 3-5.
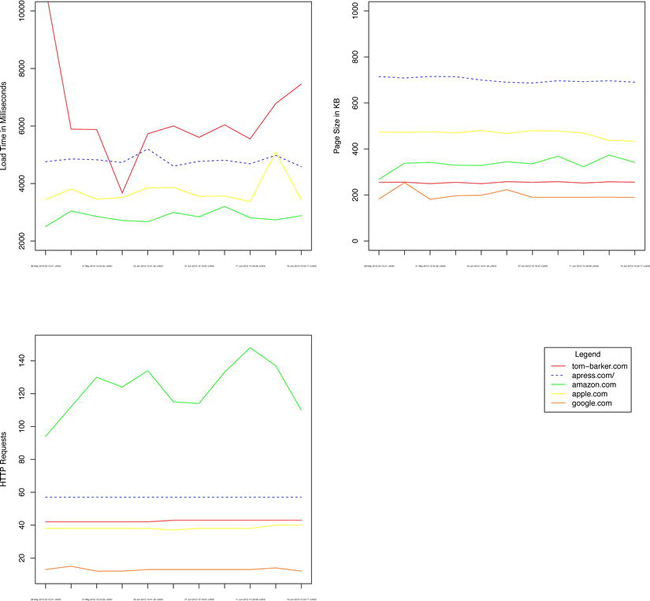
Figure 3-5. Completed time series graphic
Your completed R code should look like this:
dataDirectory <- "/Users/tbarke000/WPTRunner/data/"

chartDirectory <- "/Users/tbarke000/WPTRunner/charts/"

wpologs <- read.table(paste(dataDirectory, "wpo_log.txt", sep=""), header=TRUE, sep=",")

wpochart <- paste(chartDirectory, "WPO_timeseries.pdf", sep="")


createDataFrameByURL <- function(wpologs, url){

df <- data.frame()

for (i in 1:nrow(wpologs)){

   if(wpologs$url[i] == url){

       df <- rbind(df , wpologs[i,])

   }
}

row.names(df) <- df$date

return(df)

}


wpologs$bytes <- wpologs$bytes / 1000 #convert bytes to KB


tbdotcom <- createDataFrameByURL(wpologs, "http://tom-barker.com")

apr <- createDataFrameByURL(wpologs, "http://apress.com/")

amz <- createDataFrameByURL(wpologs, "http://amazon.com")

aapl <- createDataFrameByURL(wpologs, "http://apple.com")

ggl <- createDataFrameByURL(wpologs, "http://google.com")


WebSites <- c("tom-barker.com", "apress.com/", "amazon.com", "apple.com", "google.com")

WebSiteColors <- c("#ff0000", "#0000ff", "#00ff00", "#ffff00", "#ff6600")


pdf(wpochart, height=12, width=12)

par(mfrow=c(2,2))

plot(tbdotcom$loadtime, ylim=c(2000,10000), type="l", xaxt="n", xlab="", col="#ff0000", ylab="Load Time in Milliseconds")

axis(1, at=1: length(row.names(tbdotcom)), lab= rownames(tbdotcom), cex.axis=0.3)

lines(apr$loadtime, type="l", lty = 2, col="#0000ff")

lines(amz$loadtime, type="l", col="#00ff00")

lines(aapl$loadtime, type="l", col="#ffff00")

lines(ggl$loadtime, type="l", col="#ff6600")


plot(tbdotcom$bytes, ylim=c(0, 1000), type ="l", col="#ff0000", ylab="Page Size in KB", xlab="",

xaxt="n")

axis(1, at=1: length(row.names(tbdotcom)), lab= rownames(tbdotcom), cex.axis=0.3)

lines(apr$bytes, type="l", lty = 2, col="#0000ff")

lines(amz$bytes, type="l", col="#00ff00")

lines(aapl$bytes, type="l", col="#ffff00")

lines(ggl$bytes, type="l", col="#ff6600")


plot(tbdotcom$httprequests, ylim=c(10, 150), type ="l", col="#ff0000", ylab="HTTP Requests",

xlab="", xaxt="n")

axis(1, at=1: length(row.names(tbdotcom)), lab= rownames(tbdotcom), cex.axis=0.3)

lines(apr$httprequests, type="l", lty = 2, col="#0000ff")

lines(amz$httprequests, type="l", col="#00ff00")

lines(aapl$httprequests, type="l", col="#ffff00")

lines(ggl$httprequests, type="l", col="#ff6600")


plot(tbdotcom$httprequests, type ="n", xlab="", ylab="", xaxt="n", yaxt="n", frame=FALSE)

legend("topright", inset=.05, title="Legend", WebSites, lty=c(1,2,1,1,1,1,1,1,1,1,1,1,1,1,1,2),

col= WebSiteColors)

dev.off()
As always, there are numerous ways to refactor and refine this code. You could abstract the plotting of the time series data into a single function to reduce the amount of duplicate code. I left them as is to reinforce what you are doing to create the time series. You could use R’s native apply() function instead of looping through the data in the createDataFrameByURL() function. I left it as is to be as descriptive as possible about what the code was doing with the data.
Open Source
I’ve named this project WPTRunner and put the source code for it in its own open source project up on Github, the URL is https://github.com/tomjbarker/WPTRunner and I welcome you to grab it and use it for your own purposes, fork it to start your own projects, or contribute back to make it a better project for everyone’s benefit.
Summary
This chapter explored an automated way to track the web performance of a set of URLs using WebPagetest, PHP, and R. There are so many things you could use this for. Of course you could track the performance of your sites over time, but you could also track the performance of experimental features that you want to add to your sites, or even track the performance of pages while they are in development before they go to production.
You could use the results of this report to form a standard of what you expect your performance to be and create process to make sure new features don’t impact that performance. You can generate internal, external and executive level reports where you tie this data with other data, like release dates, user visits, or any other number of related and pertinent data.
Next chapter you will create a JavaScript library to benchmark the run time performance of your JavaScript, and chart that data as well to extract useful metrics that you can use to form not only your own code standards, but to influence product decisions and browser support matrices. As an added bonus, we'll close this chapter with an interview with Patrick Meenan, creator of WebPagetest, about the tool and its future.
Interview with Patrick Meenan of WebPagetest
Patrick Meenan was kind enough to answer a wide range of questions about WebPagetest for Pro JavaScript Performance readers.
What was the original inspiration for creating WebPagetest?
There were a couple of situations that we were having difficulty with back in 2006–2007 when it was created:
- Most of our developers were using Firefox (because of Firebug).
- Our office was across the street from the data center, so developers had high-bandwidth/low-latency connections to the server.
As a result, pages always felt fast to the developers, and it was very difficult to start a conversation about speeding things up. Our monitoring services were all testing from backbone locations, so those weren't much better. So we had a need for a tool that would let developers see what the performance looked like for our users (on more representative browsers with more realistic connections).
Was it tough getting the project open sourced?
Not at all. AOL was very supportive and really understood the benefit of opening the tool to the community, particularly since it wasn't specifically strategic to the business.
What were some of the challenges that you ran into while working on the project?
Getting access to the interfaces in the browsers to get useful information has been the biggest challenge. Some of the newer browsers (now) make the information a lot more accessible but there were no extension or browser APIs for getting access to the request chain inside of IE. I tried a lot of different techniques and API interception points before getting to a useful place (and it's still evolving, as even the current injection points still have caveats, particularly around HTTPS).
The other big challenge was just finding the time to work on it. It wasn't actually part of my day job at AOL to develop it so it was largely built as I got cycles to work on it. I'm extremely grateful to Google for letting me work on it full-time now (though the work always seems to outstrip available time).
What is the goal of WebPagetest LLC?
It was originally created as a shell to hold on to the WebPagetest assets and give it a place to live. In early 2012 I worked with several other web performance developers and formed the WPO Foundation. We're still in the process of filing for nonprofit status, but the goal is to have a foundation that will invest in open source web performance efforts and freely available data research. WebPagetest is being moved into the WPO Foundation and will help fund some of the efforts.
How long are test results stored?
Theoretically forever. I still have the test data on the server from when it initially launched in 2008. It's somewhere around 2TB right now, but with how storage systems are growing I don't see a problem for the foreseeable future. WebPagetest has some auto-archiving support built-in where it can archive test data to external storage or to the cloud after a period of time and it knows how to automatically restore the archive when a test is accessed so long-term storage isn't much of a problem. That said, I don’t currently maintain offsite backups so if there is a disaster at the site then the data will be gone (I do maintain redundant copies on-site).
How long do tests take to run on average?
I’m not sure that there IS an average time— it really depends on how many runs and if a test will include first and repeat view data. Each run has a forced time limit of 60 seconds (on the public instance), so worst-case with 10 runs it could take 20 minutes to complete a single test. Since only one test can run at a time on a given test machine, it makes it really expensive to scale (which is why there isn’t broad support for a lot of testing through the API).
Do you recommend a different approach than polling for test complete when using the API?
The API supports a callback method where the server will make a request to a beacon URL that you provide (see the pingback test parameter) but you’re still going to want to poll anyway in case the callback gets missed for some reason so you can do it for efficiency but it won’t make the code any easier.
What is the process for tests going through your queue?
Each location has a separate queue, so they are independent, but here is the basic flow:
runtest.phpwrites a job file to the queue directory for the given location and adds it to an in-memory queue (to make sure tests are done in order). There are actually 10 different priority queues for a given location, so tests are dropped into the appropriate queue (user-initiated tests get top priority, API tests get medium priority, and there are a few other explicit classes).- The test agents poll the server for work, specifying their location as part of the request (
work/getwork.php).- The server picks goes through the priority queues in order and returns the first job it finds for the given location.
- The test agent parses the test request and runs the tests specified (all of the runs, first and repeat view).
- As each run completes, the test agent uploads the results for that run to
work/workdone.php.- When the test is fully complete the test agent sends a "done" flag along with the test data.
What are some of the most interesting things you have heard that people are doing with WebPagetest?
I’m excited to see the systems that people built on top of it. The HTTP Archive (httparchive.org) is a great public example, but a lot of companies have integrated it into their internal systems using the API.
Could you talk a little bit about the agent architecture?
These days there are actually several different agents. There is the legacy IE agent, the newer Windows agent that supports Chrome and Firefox, and there are the iOS and Android agents that Akamai open-sourced. There is also an experimental WebDriver/NodeJS agent that we are working with that provides cross-platform support for testing in Chrome. WebPagetest has a standard API for test agents, which makes it easy to roll a new agent and plug it in.
The Windows agents are probably some of the more interesting ones architecturally because they do some crazy things to get access to the data they need. The new Windows agent, for example:
- Launches the given browser process (Chrome, Firefox or IE).
- Uses code injection techniques to inject and run code in the context of the browser.
- The injected code installs API intercepts for the winsock, wininet, and SSL API functions and intercepts all of the API calls to record the waterfall data.
- The injected code also runs a web server on localhost (inside of the browser) for our browser extensions to communicate with.
- Our browser extensions (one for each supported browser) poll localhost over Ajax for any commands they need to execute (navigating the browser for example).
- The browser extensions also post events as they happen to the injected browser code (onload for example).
It’s quite a bizarre setup to think that all of that is going on inside of the browser just to control the browser and record the network activity.
How do you use WebPagetest with the applications that you develop?
WebPagetest IS the application that I develop ;-). I use it a lot when working with developers on website issues, though, so I get to see it from both a user and developer perspective. The main thing I do is look at waterfalls. I can’t stress strongly enough that I feel all web developers should know how to interpret a waterfall and not to rely on checklists or scores. Seeing how a website actually loads is critical.
What features are in the near and longer term for WebPagetest? Personally I’d love a memory profiler.
Mobile is probably the biggest focus area right now. The tooling there is really primitive and it’s a lot harder to get access to the kind of data we can get on the desktop, but we’re getting there. Getting more information from browsers is always high on the list as well. We recently added support for capturing the Chrome dev tools timeline data from Chrome agents, and we’re looking at what other options are available.