
CHAPTER 4
![]()
perfLogger—JavaScript Benchmarking and Logging
Last chapter we coded an automated solution to track and visualize the web performance of URLs over time. We used WebPagetest to generate our metrics, PHP to aggregate and scrub the numbers, and R to create data visualizations from those numbers. We called this project WPTRunner, and we can use it to test the efficacy of future optimizations that we would want to implement and the performance of new features that we will develop.
WPTRunner covered the tracking of web performance; in this chapter we’ll create a tool to track runtime performance.
We are going to create a JavaScript library to benchmark the runtime performance of almost anything—from ad hoc pieces of code, to functions, to the render time of modules. Following our running theme, we will then visualize the results of these tests.
We’ll be using these tools to analyze the results of some performance best practices that we will be going over in later chapters, but more than anything I hope that you take these tools and the thirst to quantify results with empirical data with you in everything that you do.
Architecture
Once again we start out with the architecture phase. Before starting any endeavor, think about all of the pieces involved, and how they should interact.
There are a couple of ways to benchmark code—either by timing it or by calculating the number of operations performed during execution. For our example, and to be sure that we minimize the observer effect as much as possible,1 we’ll calculate the time in milliseconds during code execution. To do this we’ll capture a time stamp right before we begin to run the code and a time stamp right after we run the code, and call the difference our run time results.
[end time] - [start time] = [run time]
This is a great starting point. A flowchart of what we have so far looks like the diagram in Figure 4-1.
__________
1 The observer effect says that simply observing an act influences its outcome. For our tests, performing additional operations during the operation that we are timing could add latency in the code that we are benchmarking.

Figure 4-1. Workflow to calculate run time
Results can vary for a number of different reasons, among them client machine resources available, JavaScript engine, and browser render engine, and so what we’ll want to do is benchmark by averaging multiple executions at scale across our entire user base. To do this we’ll put our benchmarking code out in production and log all of our results where we can analyze and chart it out.
So the next step is to expose our data. We have fleshed out a workflow that has us calculating running time; let’s expand that by either displaying that runtime information to the end user, or logging it to a server.
Let’s assume there will be times that we don’t want to expose the data so we should have this hinge on a decision tree. The addition of this logic is reflected in the flowchart in Figure 4-2.
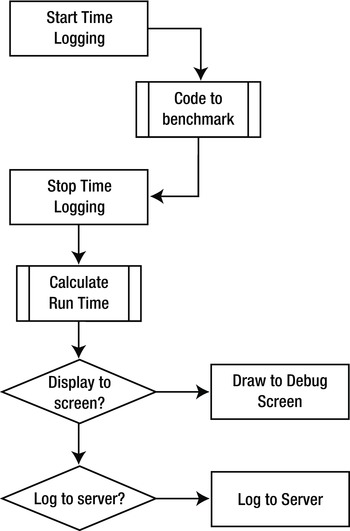
Figure 4-2. Flowchart of runtime logging
At this pointwe have a high level description of how our benchmarking engine will work. Let’s call this functionality perfLogger. We still need to interact with other processes in order to save our data and visualize it, so let’s create a sequence diagram to flesh out the interactions of these processes.
Our benchmarking process, perfLogger, will call an external process, savePerfData. We’ll use the XHR object to post the data to savePerfData. The process savePerfData should in turn save the results of the test in a flat file. We’ll call the flat file runtimeperf_results.
It is this flat file that we will read in from R and generate our chart or charts with. The diagram of this work flow can be seen in Figure 4-3.
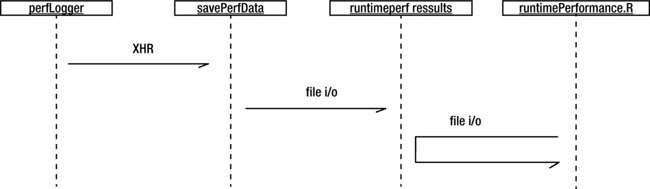
Figure 4-3. High-level sequence diagram
So far you’ve seen how we are going to generate the runtime numbers for the code that we want to benchmark, as well as the flow for how we will save the data. Let’s now think about the API for our library.
Ultimately perfLogger is meant to be used by external code, so make sure you give thought to what the public signature will be, what methods and attributes it will have, and which of them to expose publicly.
Based on Figure 4-2, we know that we want startTimeLogging() and stopTimeLogging() functions. These we will invoke before ad hoc code and after to get the start and stop times. Figure 4-2 also demonstrates a need for a drawToDebugScreen() function to draw the test results to the page and a logToServer() function to send the test results to savePerfData.
But as I’ve said, this logic just captures the running time of ad hoc code. Benchmarking is more than just capturing runtime, it’s getting the mean of multiple executions since system variance can introduce deviations in a resultset. So let’s create a logBenchmark() function that will average the results of multiple calls to startTimeLogging() and stopTimeLogging().
We should also expose a property that will hold the URL to the savePerfData, which we’ll call serverLogURL.
And finally we need a way to be able to run multiple tests on a single page. To do that we’ll create an associative array that will hold a collection of tests with a string as the identifier. We’ll call this associative array loggerPool.
Out of all these methods and properties, which ones will we want to expose publicly? We don’t want to expose any of the properties publicly; if we do that, there is a possibility of external code altering them. If we do want to allow them to be set externally we should make a setter function, but for our purposes right now we won’t.
The functions drawToDebugScreen(), logToServer(), and calculateResults() also shouldn’t be exposed publicly. Based on the flowchart we will pass in boolean values to determine if a test should be displayed or saved, so most likely we’ll have our stopTimeLogging() function call these based on properties of our test result object.
So the only functions that we will expose as our API will be startTimeLogging(), stopTimeLogging(), and logBenchmark(). Using startTimeLogging() and stopTimeLogging() will allow users to get the runtime for ad hoc code, and using logBenchmark() will allow for real benchmarking—averaging of multiple executions of passed in functions.
The object diagram from this architecture can be seen in Figure 4-4. We’ll list all properties and methods, but bold only the public ones.

Figure 4-4. perfLogger object diagram
Speaking of using loggerPool to keep a dictionary or list of tests, we’ll need to spec out a test object, to hold all of the information related to a test. It should have a startTime, endTime, and boolean values for drawToPage and logtoserver. We should also give it an identifier so we can retrieve it from the dictionary, a variable to hold the runtime so that we don’t need to calculate it each time we want to reference it.
For our own tracking purposes we’ll include the URL for the page that the test was run on and a user agent string. This metadata will be useful for running reports on our collected data. Think about it—with this structure we’ll be able to report performance for each test by user agent, or any other metadata we may want to add later.
With this in mind we should refactor our perfLogger diagram to include another private function, setResultsMetaData().
The object diagram for our test result object can be seen in Figure 4-5.
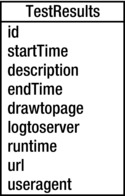
Figure 4-5. TestResults object diagram
Let’s Code!
Start by creating the perfLogger object. Since we’ll be keeping certain properties and methods private, we’ll return the perfLogger object as an object literal from a self-executing function, and declare our private variables within the self-executing function:
Next let’s begin coding the private functions. Since we sketched out the functions we would need, and the structure of the object that we will be using for test results, we can start to code against those. Let’s start with calculateResults().
Calculating Test Results
We know that we will be referencing test result objects by their IDs, so we’ll have calculateResults() accept an ID:
function calculateResults(id){

}
Within calculateResults() we’ll reference the test result in loggerPool by the passed-in ID and perform the calculation that we discussed in the architecture phase, end time minus start time:
function calculateResults(id){

loggerPool[id].runtime = loggerPool[id].stopTime - loggerPool[id].startTime;

}
Setting Test Result Metadata
While you’re at it, do the same for setResultsMetaData(). Pass in an ID and reference that test in loggerPool. Set the url property to the current window location and the useragent property to the navigator object’s userAgent property. These will give us interesting metrics to compare results against, specifically comparing to see how each rendering engine and JavaScript interpreter differs in its handling of certain functionality.
function setResultsMetaData(id){

loggerPool[id].url = window.location.href;

   loggerPool[id].useragent = navigator.userAgent;

}
Displaying Test Results
Next add the drawToDebugScreen() private function. To draw to a debug screen you will need to have a named div on the page to write to. So first create a reference to an element on the page with the ID of “debug” and store that reference in a variable named debug.
Then format the debug information—but to keep the format modular, let’s abstract that to its own function and just stub in a function call for now. Store the formatted output in a variable named output:
function drawToDebugScreen(id){

var debug = document.getElementById("debug")

   var output = formatDebugInfo(id)

}
Now it gets a little interesting. You’ll test whether the debug variable has any value; this tells you if you already have a named element on the page to write to. If debug has no value, create a new div, give it an ID of “debug”, set its innerHTML to our formatted output, and append it to the page.
But if debug already exists, simply append the current formatted output information to its innerHTML.
function drawToDebugScreen(id){

var debug = document.getElementById("debug")

   var output = formatDebugInfo(id)

   if(!debug){

      var divTag = document.createElement("div");

      divTag.id = "debug";

      divTag.innerHTML = output

      document.body.appendChild(divTag);

   }else{

      debug.innerHTML += output

   }

}
Now flesh out the formatDebugInfo() function. For our purposes, keep it simple. Simply format a string in a paragraph, with the description in bold, and runtime and useragent on their own lines below it. The only complication— benchmarks will have average runtimes, but ad hoc tests will simply have runtimes, so you need to check to see if the test result object has an avgRunTime property and use that; if it doesn’t, you’ll default to using the runtime property:
function formatDebugInfo(id){

var debuginfo = "<p><strong>" + loggerPool[id].description + "</strong><br/>";

   if(loggerPool[id].avgRunTime){

      debuginfo += "average run time: " + loggerPool[id].avgRunTime + "ms<br/>";

   }else{

      debuginfo += "run time: " + loggerPool[id].runtime + "ms<br/>";

   }

   debuginfo += "path: " + loggerPool[id].url + "<br/>";

   debuginfo += "useragent: " +  loggerPool[id].useragent + "<br/>";

   debuginfo += "</p>";

   return debuginfo

}
Saving the Data
The final private function is logToServer(). Once again you’ll pass in an ID to reference the results object in our loggerPool array. But this time use the native function JSON.stringify() to serialize the object literal to a string value. Prefix that string value with “data=” to encapsulate the data in a name that you can pull out of the POST variables on the server side:
function logToServer(id){

   var params = "data=" + (JSON.stringify(loggerPool[id]));

}
Next the function creates a new XHR object, sets the delivery method to POST and points to our saved serverLogURL variable (which points to savePerfData). Since this data isn’t mission critical, logToServer() doesn’t process the readystatechange event, and simply POSTs our data to our script waiting for it:
function logToServer(id){
   var params = "data=" + (JSON.stringify(loggerPool[id]));

   var xhr = new XMLHttpRequest();

   xhr.open("POST", serverLogURL, true);

   xhr.setRequestHeader("Content-type", "application/x-www-form-urlencoded");

   xhr.setRequestHeader("Content-length", params.length);

   xhr.setRequestHeader("Connection", "close");

   xhr.onreadystatechange = function(){};

   xhr.send(params);

}
Crafting the Public API
Now you’ll start creating the public functions in the returned object literal. First tackle startTimeLogging(). We’ll have it accept an ID that we’ll use as the ID for the test results, a description of the test, and a boolean value for drawToPage and logToServer. Within the function you’ll create a new object in loggerPool and set the passed-in properties, as well as the startTime value, which is just a new Date object.
startTimeLogging: function(id, descr,drawToPage,logToServer){

   loggerPool[id] = {};

   loggerPool[id].id = id;

   loggerPool[id].startTime = new Date;

   loggerPool[id].description = descr;

   loggerPool[id].drawtopage = drawToPage;

   loggerPool[id].logtoserver = logToServer

}
If you wanted to refine that further, you could create a constructor and simply invoke the constructor here. That would encapsulate the functionality already here and allow you to reuse it in other places without having to rewrite it.
Next code the implementation for the stopTimeLogging() function. Once again you can rely on the architecture outlined above, so stopTimeLogging() simply sets the stop time, and then calls the private functions to calculate the runtime and set the metadata for the test results:
loggerPool[id].stopTime = new Date;

calculateResults(id);

setResultsMetaData(id);
Finally stopTimeLogging() checks the boolean values to see if the test should be drawn to the screen and if it should be logged to the server:
if(loggerPool[id].drawtopage){

   drawToDebugScreen(id);

}

if(loggerPool[id].logtoserver){

   logToServer(id);

}
The complete function should look like this:
stopTimeLogging: function(id){

   loggerPool[id].stopTime = new Date;

   calculateResults(id);

   setResultsMetaData(id);
   if(loggerPool[id].drawtopage){

      drawToDebugScreen(id);

   }

   if(loggerPool[id].logtoserver){

      logToServer(id);

   }

}
The last function you will need to implement is logBenchmark(). This is the most complicated function in the library so far. At a high level, this function will use startTimeLogging() and stopTimeLogging() a set number of times on a function that is passed in, and then get the average of the results.
Let’s take this one step at a time. First you’ll need to pass in an ID to use, the number of times to run the test, the function to test, and whether to draw the results to the page and log them to the server:
logBenchmark: function(id, timestoIterate, func, debug, log){

}
Next create a variable to hold the sum of each test run and begin iterating based on the timestoIterate variable:
var timeSum = 0;

for(var x = 0; x < timestoIterate; x++){

}
Within that loop call startTimeLogging(),invoke the passed-in function , call stopTimeLogging(), and finally add the running time of each iteration to the timeSum variable:
for(var x = 0; x < timestoIterate; x++){

   perfLogger.startTimeLogging(id, "benchmarking "+ func, false, false);

   func();

   perfLogger.stopTimeLogging(id)

   timeSum += loggerPool[id].runtime

}
Notice that each iteration in the loop uses the same ID for the test that it is running; you are just overwriting the test results each time. Also notice that the code passes in false to avoid drawing to the debug screen or logging each individual test.
After looping is done you calculate the average runtime by dividing the summed runtimes by the number:
loggerPool[id].avgRunTime = timeSum/timestoIterate

if(debug){

   drawToDebugScreen(id)

}

if(log){

   logToServer(id)

}
The finished function should now look like this:
logBenchmark: function(id, timestoIterate, func, debug, log){

   var timeSum = 0;

   for(var x = 0; x < timestoIterate; x++){

      perfLogger.startTimeLogging(id, "benchmarking "+ func, false, false);

      func();
      perfLogger.stopTimeLogging(id)

      timeSum += loggerPool[id].runtime

   }

   loggerPool[id].avgRunTime = timeSum/timestoIterate

   if(debug){

         drawToDebugScreen(id)

   }

   if(log){

         logToServer(id)

   }

}
Your finished library should look like this:
var perfLogger = function(){

   var serverLogURL = "savePerfData.php",

      loggerPool = [];


      function calculateResults(id){

         loggerPool[id].runtime = loggerPool[id].stopTime - loggerPool[id].startTime;

      }


      function setResultsMetaData(id){

         loggerPool[id].url = window.location.href;

         loggerPool[id].useragent = navigator.userAgent;

      }


      function drawToDebugScreen(id){

         var debug = document.getElementById("debug")

         var output = formatDebugInfo(id)

         if(!debug){

            var divTag = document.createElement("div");

            divTag.id = "debug";

            divTag.innerHTML = output

            document.body.appendChild(divTag);

         }else{

            debug.innerHTML += output

         }

      }

      function logToServer(id){

         var params = "data=" + (JSON.stringify(loggerPool[id]));

         var xhr = new XMLHttpRequest();

         xhr.open("POST", serverLogURL, true);

         xhr.setRequestHeader("Content-type", "application/x-www-form-urlencoded");

         xhr.setRequestHeader("Content-length", params.length);

         xhr.setRequestHeader("Connection", "close");

         xhr.onreadystatechange = function(){};

         xhr.send(params);

      }
      function formatDebugInfo(id){

         var debuginfo = "<p><strong>" + loggerPool[id].description + "</strong><br/>";

         if(loggerPool[id].avgRunTime){

            debuginfo += "average run time: " + loggerPool[id].avgRunTime + "ms<br/>";

         }else{

            debuginfo += "run time: " + loggerPool[id].runtime + "ms<br/>";

         }

         debuginfo += "path: " + loggerPool[id].url + "<br/>";

         debuginfo += "useragent: " +  loggerPool[id].useragent + "<br/>";

         debuginfo += "</p>";

         return debuginfo

      }


   return {

   startTimeLogging: function(id, descr,drawToPage,logToServer){

      loggerPool[id] = {};

      loggerPool[id].id = id;

      loggerPool[id].startTime = new Date;

      loggerPool[id].description = descr;

      loggerPool[id].drawtopage = drawToPage;

      loggerPool[id].logtoserver = logToServer

   },


   stopTimeLogging: function(id){

      loggerPool[id].stopTime = new Date;

      calculateResults(id);

      setResultsMetaData(id);

      if(loggerPool[id].drawtopage){

         drawToDebugScreen(id);

      }

      if(loggerPool[id].logtoserver){

         logToServer(id);

      }

   },


   logBenchmark: function(id, timestoIterate, func, debug, log){

      var timeSum = 0;

      for(var x = 0; x < timestoIterate; x++){

         perfLogger.startTimeLogging(id, "benchmarking "+ func, false, false);

         func();

         perfLogger.stopTimeLogging(id)

         timeSum += loggerPool[id].runtime

      }

      loggerPool[id].avgRunTime = timeSum/timestoIterate

      if(debug){

            drawToDebugScreen(id)

      }

      if(log){

            logToServer(id)
      }

   }

}

}()
![]() Note: Because of the speed of modern interpreters and systems, smaller ad hoc tests may yield a 0 millisecond result. When benchmarking, make sure you are testing a large enough block of functionality to yield results. This means that if you want to benchmark looping over an array, you’ll need to make the array large enough that it takes more than a millisecond to step through it. I’ll talk more about this in later chapters when we are benchmarking small snippets of ad hoc code; we’ll run tests at large enough scales to see what the implied benefit actually is. We’ll also explore the concept of High Resolution Time in next chapter, a feature that gives us access to time measurements in sub-milliseconds.
Note: Because of the speed of modern interpreters and systems, smaller ad hoc tests may yield a 0 millisecond result. When benchmarking, make sure you are testing a large enough block of functionality to yield results. This means that if you want to benchmark looping over an array, you’ll need to make the array large enough that it takes more than a millisecond to step through it. I’ll talk more about this in later chapters when we are benchmarking small snippets of ad hoc code; we’ll run tests at large enough scales to see what the implied benefit actually is. We’ll also explore the concept of High Resolution Time in next chapter, a feature that gives us access to time measurements in sub-milliseconds.
Remote Logging
OK, so perfLogger.js is calling savePerfData with the test results serialized to string form. Let’s flesh out what we do with savePerfData.
You can reuse the fileio.php shared file from last chapter’s WPTRunner example, and create two variables, $logfile to hold the path to the flat file, and $benchmarkResults to hold the test results. Pull the results out of the $_POST array; remember that you prefixed the serialized object with “data=”, so now refer to it with the string “data”. Stub out a function call to formatResults, pass in a reference to $_POST, and return that to $benchmarkResults. Finally, pass $benchmarkResults and $logfile to a stubbed out function saveLog():
<?php

require("util/fileio.php");


$logfile = "log/runtimeperf_results.txt";

$benchmarkResults = formatResults($_POST["data"]);


saveLog($benchmarkResults, $logfile);

?>
Now let’s flesh out formatResults().It should accept an object, in the parameter $r:
function formatResults($r){}
Keep in mind that because it was serialized and encoded to pass over HTTP, the data will look something like this:
{"id":"fi","startTime":59,"description":"benchmarking function useForInLoop() {\n var

stepTest = populateArray(4);\n for (ind in stepTest) {\n

}\n}","drawtopage":false,"logtoserver":false,"stopTime":59,"runtime":0,"url":"ht

tp://localhost:8888/lab/perfLogger_example.html","useragent":"Mozilla/5.0 (Macintosh; Intel

Mac OS X 10.5; rv:13.0) Gecko/20100101 Firefox/13.0.1","avgRunTime":0}
So within the function you need to strip out all preceding slashes and use the native json_decode() to take the serialized data and convert it to a native JSON object:
$r = stripcslashes($r);

$r = json_decode($r);
To make sure that the value was properly converted, check the value of json_last_error(). From the PHP manual, at http://php.net/manual/en/function.json-last-error.php, you can see that the potential values in json_last_error are :
0 - JSON_ERROR_NONE

1 - JSON_ERROR_DEPTH

2 - JSON_ERROR_STATE_MISMATCH

3 - JSON_ERROR_CTRL_CHAR

4 - JSON_ERROR_SYNTAX

5 - JSON_ERROR_UTF8
![]() Note:
Note: json_last_error is supported in PHP versions 5.3 and above. If you are running an older version of PHP, remove the check to json_last_error or you will get an error.
If any errors are found, you should exit the application completely. And finally, the function returns $r:
f(json_last_error() > 0){

   die("invalid json");

}

return($r);
Your completed function should look like this:
function formatResults($r){

   $r = stripcslashes($r);

   $r = json_decode($r);

   if(json_last_error() > 0){

      die("invalid json");

   }

   return($r);

}
Saving the Test Results
Next let's flesh out the saveLog() function. It, of course, accepts a string that is the path to our log file. As in the previous chapter, it should check whether the file exists, and if it doesn’t, create and format a new log file. Stub out a function called formatNewLog() for this for now.
function saveLog($obj, $file){

   if(!file_exists($file)){

      formatNewLog($file);

   }

}
Some user agent strings contain commas. Since the delimiter that you will use to separate fields in our flat file will be a comma, you’ll need to strip commas out of the user agent. Abstract that functionality into its own function called cleanCommas() and stub out a call to it for now:
$obj->useragent = cleanCommas($obj->useragent);
Next, you’ll construct a comma-separated string from all of the property values and pass that to the appendToFile() function from the shared file, fileio.php. For an extra dimension of data, also prepend an IP address to that file. Adding this data will allow you to extrapolate information and categorize the results in all sorts of interesting ways; for example, converting IP address to geographical information and sorting the results by region, or by ISP.
$newLine = $_SERVER["REMOTE_ADDR"] . "," . $obj->id .",". $obj->startTime

. "," . $obj->stopTime . "," . $obj->runtime . "," . $obj->url . "," . $obj->useragent;

appendToFile($newLine, $file);
Your complete function should look like this:
function saveLog($obj, $file){

   if(!file_exists($file)){

      formatNewLog($file);

   }

   $obj->useragent = cleanCommas($obj->useragent);

   $newLine = $_SERVER["REMOTE_ADDR"] . "," . $obj->id .",". $obj->startTime . "," . $obj-

>stopTime . "," . $obj->runtime . "," . $obj->url . "," . $obj->useragent;

   appendToFile($newLine, $file);

}
Let’s quickly flesh out the stubbed out cleanCommas() function. The function will accept a parameter $data. You’ll use a little trick, calling the explode() function—PHP’s equivalent to the split() function, which splits a string at a defined delimiter (in this case a comma)and returns an array with each string part as a separate element. Pass that array to the implode() function; it is PHP’s equivalent to the join() function, which accepts an array and concatenates all elements into a single string. By using the two functions in conjunction you create a single-line find-and-replace function.
function cleanCommas($data){

   return implode("", explode(",", $data));

}
![]() Note: Let’s linger on this find-and-replace trick for a minute. Think about how it’s working. Exploding on the delimiter splits the string at each instance of the delimiter. So if we take the string “the quick brown fox jumps over the lazy dog” and explode it on the delimiter “the,” it becomes the array
Note: Let’s linger on this find-and-replace trick for a minute. Think about how it’s working. Exploding on the delimiter splits the string at each instance of the delimiter. So if we take the string “the quick brown fox jumps over the lazy dog” and explode it on the delimiter “the,” it becomes the array
["quick", "brown", "fox", "jumps", "over", "lazy", "dog"]
If we then implode that array and pass in the string “a” to use to glue the array together, we get the following result:
"a quick brown fox jumps over a lazy dog"
And finally let’s quickly flesh out our formatNewLog() function. This function will add the first line to a new log file, containing all of the headers for the file:
function formatNewLog($file){

   $headerline = "IP, TestID, StartTime, StopTime, RunTime, URL, UserAgent";

   appendToFile($headerline, $file);

}
The completed savePerfData.php file should look like the following.
<?php

require("util/fileio.php");


$logfile = "log/runtimeperf_results.txt";

$benchmarkResults = formatResults($_POST["data"]);


saveLog($benchmarkResults, $logfile);


function formatResults($r){

   $r = stripcslashes($r);

   $r = json_decode($r);

   if(json_last_error() > 0){

      die("invalid json");

   }

   return($r);

}


function formatNewLog($file){

   $headerline = "IP, TestID, StartTime, StopTime, RunTime, URL, UserAgent";

   appendToFile($headerline, $file);

}


function saveLog($obj, $file){

   if(!file_exists($file)){

      formatNewLog($file);

   }

$obj->useragent = cleanCommas($obj->useragent);

$newLine = $_SERVER["REMOTE_ADDR"] . "," . $obj->id .",". $obj->startTime . "," . $obj->stopTime

. "," . $obj->runtime . "," . $obj->url . "," . $obj->useragent;

   appendToFile($newLine, $file);

}


function cleanCommas($data){

   return implode("", explode(",", $data));

}


?>
An Example Page
Excellent! Now you can make a quick page that uses the library to get some data. Create the skeletal structure of an HTML page, give it a title of perfLogger Example, and link to perfLogger.js in the head section of the page. Then, also in the head of the page, put another script tag invoking perfLogger.startTimeLogging(). Pass in an ID of "page_render", a description of “timing page render”, and true so that the results are displayed to the page, and true so that the results are also logged server side:
<!DOCTYPE html>

<html>

<head>

   <title>perfLogger Example</title>

   <script src="perfLogger.js"></script>

   <script>

   perfLogger.startTimeLogging("page_render", "timing page render", true, true)

   </script>

</head>

<body>

<script>

perfLogger.stopTimeLogging("page_render")

</script>

</body>

</html>
You’re putting this function invocation in the head section so that it begins counting before the visible section of the page starts rendering. In the body section, we will put a new script tag with a call to perfLogger.stopTimeLogging("page_render").
Save this file as perfLogger_example.html. If you view it in a browser, it should look like Figure 4-6.
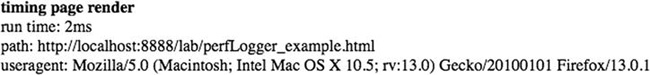
Figure 4-6. Screen shot of perfLogger_example.html
And the runtimeperf_results.txt file should look like the following:
IP, TestID, StartTime, StopTime, RunTime, URL, UserAgent

71.225.152.145,page_render,2012-06-19T23:52:52.448Z,2012-06-19T23:52:52.448Z,0,http://tom-

barker.com/lab/perfLogger_example.html,Mozilla/5.0 (Macintosh; Intel Mac OS X 10_5_8)

AppleWebKit/536.5 (KHTML like Gecko) Chrome/19.0.1084.52 Safari/536.5

71.225.152.145,page_render,2012-06-19T23:52:52.452Z,2012-06-19T23:52:52.452Z,0,http://tom-

barker.com/lab/perfLogger_example.html,Mozilla/5.0 (Macintosh; Intel Mac OS X 10_5_8)

AppleWebKit/536.5 (KHTML like Gecko) Chrome/19.0.1084.52 Safari/536.5
![]() Note: Depending on the browser, you may get 0 millisecond results for this test, because there is nothing on the page. Real tests will have content. Or you could build your own test suite to benchmark, much like SunSpider, at
Note: Depending on the browser, you may get 0 millisecond results for this test, because there is nothing on the page. Real tests will have content. Or you could build your own test suite to benchmark, much like SunSpider, at http://www.webkit.org/perf/sunspider/sunspider.html.
We’ll put this page in production to gather metrics for all of our users that hit it. You can see this page at http://tom-barker.com/lab/perfLogger_example.html.
Charting the Results
Now that we’ve got some data, let’s take a stab at visualizing it. We’ll look at the page_render test results runtime by user agent. Create a new R document called runtimePerformance.R and create the following variables: dataDirectory to hold the path to the log directory, chartDirectory to hold the path to the directory where you will write the charts, and testname to hold the name of the test that you will be charting:
dataDirectory <- "/Applications/MAMP/htdocs/lab/log/"

chartDirectory <- "/Applications/MAMP/htdocs/lab/charts/"

testname = "page_render"
Read in the log file and store it as a data frame in the variable perflogs, and create a path to the chart that you want to draw in the variable perfchart:
perflogs <- read.table(paste(dataDirectory, "runtimeperf_results.txt", sep=""), header=TRUE,

sep=",")

perfchart <- paste(chartDirectory, "runtime_",testname, ".pdf", sep="")
Next you’ll do a bit of analysis. Right now you only have results for the page_render test in the log, but eventually as you run different tests you’ll have differently named results, so pull only the results that have a column TestID whose value is “page_render”:
pagerender <- perflogs[perflogs$TestID == "page_render",]
Then create a new data frame made up only of the columns that we want to chart the UserAgent column and the RunTime column.
df <- data.frame(pagerender$UserAgent, pagerender$RunTime)
Next you’ll use the by() function of R. This function applies another function to a data frame and groups by a passed-in factor. For our example we’ll group by the UserAgent column and apply the mean() function to each element.
df <- by(df$pagerender.RunTime, df$pagerender.UserAgent, mean)
If you type df at the console again, you’ll see this:
> df

df$pagerender.UserAgent

Mozilla/5.0 (Macintosh; U; Intel Mac OS X 10_5_8; en-us) AppleWebKit/533.21.1 (KHTML like Gecko)

Version/5.0.5 Safari/533.21.1


6.00000

Mozilla/5.0 (Macintosh; Intel Mac OS X 10_5_8) AppleWebKit/536.5 (KHTML like Gecko)

Chrome/19.0.1084.52 Safari/536.5


20.75000

Mozilla/5.0 (Macintosh; Intel Mac OS X 10.5; rv:13.0) Gecko/20100101 Firefox/13.0.1


55.63158
Mozilla/5.0 (Macintosh; Intel Mac OS X 10.5; rv:13.0) Gecko/20100101 Firefox/13.0


144.00000

Mozilla/4.0 (compatible; MSIE 8.0; Windows NT 5.1; Trident/4.0; .NET CLR 2.0.50727; .NET CLR

3.0.4506.2152; .NET CLR 3.5.30729)


511.00000
This data frame now holds the average run time grouped by raw user agent. It is the mathematical mean of the run time result of each test, by user agent.
And finally we’ll order the data frame and generate the chart as a bar chart.
df <- df[order(df)]

pdf(perfchart, width=10, height=10)

opar <- par(no.readonly=TRUE)

   par(las=1, mar=c(10,10,10,10))

   barplot(df, horiz=TRUE, main=”Page Render Runtime Performance in Milliseconds
By User Agent”)

par(opar)

dev.off()
See Figure 4-7 for the resulting chart.
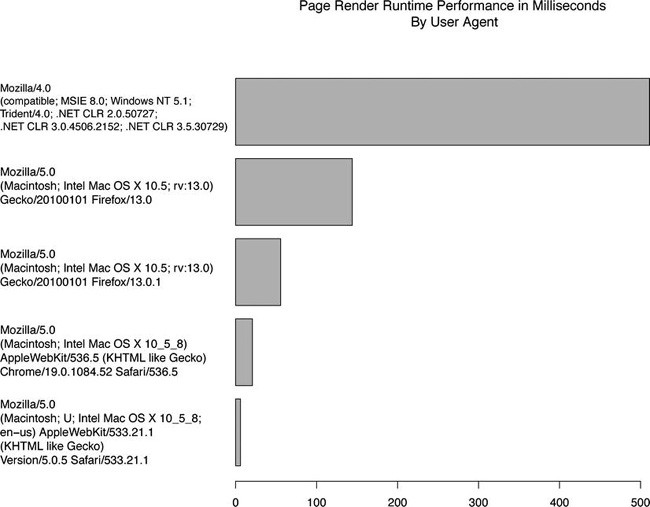
Figure 4-7. Page render test in milliseconds by user agent
The complete R script should look like this:
dataDirectory <- "/Applications/MAMP/htdocs/lab/log/"

chartDirectory <- "/Applications/MAMP/htdocs/lab/charts/"

testname = "page_render"


perflogs <- read.table(paste(dataDirectory, "runtimeperf_results.txt", sep=""), header=TRUE,

sep=",")

perfchart <- paste(chartDirectory, "runtime_",testname, ".pdf", sep="")


pagerender <- perflogs[perflogs$TestID == "page_render",]

df <- data.frame(pagerender$UserAgent, pagerender$RunTime)

df <- by(df$pagerender.RunTime, df$pagerender.UserAgent, mean)

df <- df[order(df)]


pdf(perfchart, width=10, height=10)

opar <- par(no.readonly=TRUE)

   par(las=1, mar=c(10,10,10,10))

   barplot(df, horiz=TRUE)

par(opar)

dev.off()
Open Source
Just as I did with WPTRunner, I’ve put the source code for perfLogger up on Github, available here: https://github.com/tomjbarker/perfLogger.
Summary
In this chapter you created a tool to gather the running time of ad hoc blocks of code, or benchmark passed-in functions through aggregating the running time of multiple iterations of that code. You created a server-side script in PHP to which our library can send the results of these tests. Finally, you created an R script to pull out and chart our test results.
In the coming chapters we will be exploring a number of performance best practices. To demonstrate why these practices are more performant, we will be using these tools that you just developed to back these claims up with empirical data, and visualize our results for mass consumption.
But first Chapter 5 will look at the future of performance in the browser, the coming of Web Performance Standards.