6 China’s transition toward a low-carbon economy
Introduction
China’s economic reform dates back to 1978 when the central government decided to turn the focus of the nation from political campaigns to economic development. From 1978 to 2000, China’s gross domestic product (GDP) was quadrupled, and the energy consumption was doubled. Thus the energy intensity was cut by half. As the nation entered the new century, the accelerated industrialization posed new challenges in energy use, the share of energy-intensive heavy industry increased quickly (Figure 6.1), and the overall energy intensity reversed from a decreasing trend to a sharp increase. The energy intensity (measured by energy consumption per unit GDP) increased by 4.8 percent in 2003 and by 5.5 percent in 2004. In 2005 the energy intensity was back to the 1999 level. The two consecutive years of increase canceled out the achievement in energy intensity reduction from 1999 to 2005. GDP in 2005 increased by 70 percent compared to that of 1999. Should such a high growth rate continue into the future, energy consumption and carbon emissions would increase dramatically without an effective control, posing a severe challenge to energy supply, environmental quality, and greenhouse gas emissions for China as well as for the world.
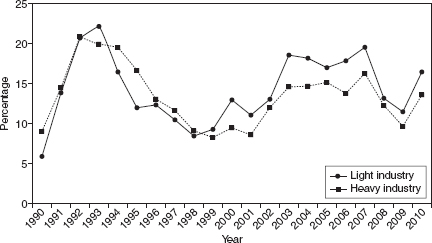
Figure 6.1 Growth rate of light industry and heavy industry (1990–2010) (source: NBS 1990–2010).
The 11th Five Year Plan (FYP) for the period from 2006–2010 set an explicit target of reducing the energy intensity by 20 percent. In addition, a few major industrial sectors were identified as priority areas under the energy saving policy. The 11th FYP defined the target as “mandatory” and required that all government departments and local governments ensure the delivery of the target with the maximum effort and the maximum resources they could allocate.
According to data from the National Development and Reform Commission (NDRC and NBS, 2011), by the end of 2010, the energy intensity of China had decreased by 19.1 percent compared to the 2005 level, virtually achieving the target set by the 11th Five Year Plan. On a year-to-year basis, the reduction was 2.72 percent in 2006, 5.01 percent in 2007, 5.23 percent in 2008, 3.62 percent in 2009, and 4.10 percent in 2010. By 2008, energy intensity had dropped to the 2002 level (see Figure 6.2). The rapidly increasing trend of the energy intensity during the 10th FYP period (2000–2005) was replaced with a sharp decrease of an annual rate of 4.3 percent. As a comparison, the energy intensity in the United States decreased by 1.2 percent annually on average (BEA, 2011; EIA, 2010). In 2011, the first year of the 12th FYP, the energy intensity of the Chinese economy was further cut by 2.01 percent toward an overall five-year target of 16 percent.

Figure 6.2 Change of energy intensity in China (1980–2010) (source: NBS, 2011a). Energy intensity is calculated at 2005 constant price)
The key to low-carbon development is to decarbonize the production and consumption of the economy. Decarbonization is achieved by the decrease in fossil fuel consumption per unit of production and consumption. During the 11th FYP, China successfully curbed its increasing energy intensity, and achieved its transition toward a low-carbon development path. This helped alleviate the pressure of energy supply shortage and greenhouse gas emissions in China as well as in the world.
Decarbonization in the major sectors
China’s transition toward a low-carbon economy was seen in major sectors of the economy. Among the key industries, electric power generation and manufacturing industries achieved significant progress. Buildings and transportation sectors showed a series of encouraging achievements and trends. The fossil fuel consumption in agriculture was stabilized, and the forest carbon sequestration increased. Moreover, the development of low-carbon energies became a new hotspot for economic growth and attracted both domestic and international investment.
The efficiency of both electricity generation and transmission witnessed significant improvement, and the carbon intensity of the whole sector experienced a steady decrease. China heavily relies on fossil fuel for power generation: approximately 80 percent of the generation is from coal. As a result, the priority for decarbonization of the electricity sector is to increase generation efficiency in fossil fuel-fired power plants and the share of non-fossil energy in the generation mix. China achieved success in both aspects during the 11th FYP. Coal consumption per kilowatt hour (kWh) generated and per kWh supplied decreased by 31 grams and 37 grams, respectively, in the 11th FYP, as opposed to 20 grams and 22 grams in the 10th FYP.
In terms of the coal consumption of power plant, China was quickly catching up the advanced countries. For example, the net coal consumption of power plants of capacity higher than 6,000 kW in China was 392 gce/kWh in 2000, and the average net coal consumption of the top nine electricity companies in Japan was 316 gce/kWh. The gap between China and Japan was 76 gce/kWh in 2000, 56.3 gce/kWh in 2005 and 23 gce/kWh in 2010. The improvement of coal generation efficiency led to a decrease in carbon emissions intensity. Carbon emissions intensity decreased by 7.48 percent from 936.4 gCO2/kWh in 2005 to 866.3 gCO2/kWh in 2009 (see Figure 6.3).

Figure 6.3 Comparisons between China and Japan of gross coal consumption rate and net coal consumption for fossil-fired power plant (2005–2010) (sources: NBS, 2011b; CEC, 2010, 2011).
Note
1 China’s data is from more than 6,000 kW fossil-fired power plants, and Japan’s data is the average of top nine electricity companies.
Power generation from non-fossil energy sources experienced rapid development during the 11th FYP (Figure 6.4). In 2010, total electricity generation from non-fossil energy sources reached 813.2 billion kWh (CEC, 2011), 80 percent higher than in 2005. The growth rate of power generation from non-fossil energy sources is 67 percent higher than that from fossil energy sources. The share of non-fossil electricity generation in total electricity generation was 19.2 percent (CEC, 2011), as compared to 18.1 percent in 2005. Among all non-fossil energy sources, hydropower generation capacity expansion was the most significant in absolute terms. With additional capacity of 20 GW per year, hydropower generation capacity increased 2.5 times as fast as it did during previous FYP. The total installed capacity of hydropower reached 210 GW (CEC, 2011) in 2010. Meanwhile, wind power generation capacity experienced the most rapid increase. With an annual increase of 105 percent for five consecutive years, the total installed wind capacity reached 44.73 GW in 2010 (Li et al. 2011), accounting for 22.4 percent of the world’s total installed capacity (BP, 2011). The growth of photovoltaic (PV) power generation was exponential. The installed PV capacity reached 860,000 kW in 2010, 12.29 times of that of 2005. The development of nuclear power also drew extensive attention. By the end of 2010, a total of 13 nuclear plants were commercial use, 28 nuclear plants were under construction (Han, 2011).

Figure 6.4 Change of non-fossil energy generating capacity (1995–2010).
The efficiency improvement of coal-fired power generation and the expanding share of non-fossil fuels in the generation mix resulted in a rapid decrease in the power sector’s carbon emission intensity from 766.7 gCO2/kWh in 2005 to 695.6 gCO2/kWh in 2009, a decrease of 9.27 percent. Emissions from fossil energy were avoided due to the increase of non-fossil power. The emission reduction of the sector reached 146 million tons of CO2.
Manufacturing industry
In 2010, energy consumption by the manufacturing industry was about 1.37 Gtce, accounting for 66.5 percent of end-use energy consumption or 42.1 percent of total national energy consumption; CO2 emissions were 4.30 Gt, accounting for 62 percent of national total energy-related emissions. During the 11th FYP, total energy consumption and CO2 emissions increased in the manufacturing industry, but the energy intensity and carbon emissions intensity experienced a rapid decrease.
Energy efficiency in the manufacturing industry can be measured by two indicators—the energy consumption per unit of value added which reflects the overall energy intensity in one industry, and energy consumption per unit of an industrial product. From 2005 to 2010, energy consumption per unit of value added in the manufacturing industry decreased by 23.2 percent, an annual decrease of 5.14 percent on average, 20 percent faster than the national average of 4.15 percent. This translated into total energy savings of 329 Mtce, accounting for 52.5 percent of national total. CO2 emissions per 10,000 yuan value added decreased from 4.37 t in 2005 to 3.28 t in 2010, a decrease of 25.1 percent or an annual decrease of 5.6 percent on average (Figure 6.5). Cumulative CO2 emission reductions were 1.16 Gt, accounting for 74.8 percent of national total reductions.

Figure 6.5 Energy intensity and CO2 emission intensity of the manufacturing industry sector (2005–2010).
Energy consumption per unit of product decreased for all 16 major products in six energy-intensive industries. The manufacturing industry achieved total energy savings of 311 Mtce through unit product energy efficiency improvement, accounting for 94.6 percent of the total savings achieved by the manufacturing industry or 49.6 percent of total national energy savings.
Such a success was largely due to technology improvement and structural optimization. Technology improvement included technology innovation, phasing out inefficient technologies and scaling-up the deployment of advanced technologies, adopting energy efficient equipment, and expanding R&D investment. From 2006–2010, the “Top 1,000 Enterprises Energy-Saving Program”1 yielded energy savings of 150 Mtce (NDRC, 2011a), the “Ten Key Energy-Saving Projects”2 340 Mtce (NDRC, 2011b), and the “Phasing-out Obsolete Capacity Program” over 110 Mtce. These three programs successfully met and even surpassed energy savings targets. With the deployment of more efficient technologies, overall energy consumption per ton of steel dropped by 12.1 percent in 2006–2010 (NBS, 2011c). At the same time, the deployment rates of all major new technologies went up. The medium and large steel companies achieved better performance than their Japanese peers who were considered world leaders in terms of many indicators. Comprehensive energy consumption intensity in cement industry achieved a decrease of 28.6 percent through large scale deployment of new dry process and residue heat to electricity technologies, and through increasing bulk cement rate (NBS, 2011c). Success in energy efficiency was also witnessed by the non-ferrous metal industry in China. With the scale-up of the pre-baked cell production, the AC electricity consumption in aluminum ingot production has dropped by 12 percent (NBS, 2011c). The overall electricity consumption intensity in copper smelting dropped by 35.9 percent (NBS, 2011c), the largest decrease achieved among all industries during 2006–2010.
In terms of structural changes, the heavy-industry-oriented industrialization trend in the first three years during 2006–2010 continued but slowed down. Meanwhile, the structure of the manufacturing industry started to transition to a more energy-efficient mode with a decreasing share of high energy-intensive industries and an increasing share of less energy-intensive products.
Efficiency improvement in buildings
Energy consumption and CO2 emissions in the building sector continuously increased in the 11th FYP, but the annual growth rate decreased notably compared to that in the 10th FYP. From 2005 to 2010, energy consumption per unit area increased by 19.7 percent, or an annual rate of 3.7 percent on average. At the same time, CO2 emissions per unit area increased by 17.9 percent overall or 3.3 percent annually on average. At present, China’s CO2 emissions per unit of building area are far lower than that in the developed countries and less than a third of the US level.
Four categories can be identified in building energy consumption. Centralized district heating systems in northern cities achieved the greatest progress in energy efficiency. Energy consumption per unit area in central heating systems in northern cities continuously dropped from 17.78 kgce/m2 in 2005 to 16.28 kgce/m2 in 2010, a decrease of 8.41 percent. At the same time, the associated CO2 emissions per unit area also decreased from 47.48 kgCO2/m2 in 2005 to 43.87 kg CO2/m2 in 2010, a decrease of 7.6 percent. As a result, the growth rate of total energy consumption and CO2 emissions related to northern cities’ central heating systems was slowed down, which accounted for about 25 percent of total building energy consumption in the whole country in 2010.
Through the transformation of the envelope structure of buildings, the institutional reform of centralized district heating systems, and the scale-up of energy-saving lighting and energy standards of home appliances, the building sector achieved an energy-saving capability of 67.50 Mtce, equivalent to an accumulative emissions reduction capability of 185 MtCO2 from 2006 to 2010.
Transportation
China’s transportation sector has experienced rapid growth in roads, vehicles, and traffic, all leading to growth in energy consumption. Energy consumption in the transportation sector amounted to 230 Mtce in 2005 and 3,000 Mtce in 2009, an increase of more than 30 percent over four years, higher than the average growth rate in other sectors, although it was lower than that in the previous FYP. Energy efficiency improved significantly in the sector. Energy consumption per ton-kilometer in railway transportation decreased from 6.48 tce/Mton/km equivalent in 2005 to 4.94 tce/Mton/km equivalent in 2010, a decrease of 23.8 percent (MOR, 2011). Fuel oil consumption per unit of ton-kilometer in aviation transportation decreased from 0.336 kg/ton/km in 2005 to 0.298 kg/ton/km in 2010, a decrease of 11.3 percent (CAA, 2011).
The Chinese government encouraged the development of mass transportation. There was a continued increase in the share of public transportation in residential trips. Taking Beijing as an example, the share of public transportation reached 39.3 percent in the first half of 2010 (Beijing Daily, 2010), an increase of nearly 7 percent compared to the 2005 level.
In response to the booming of private vehicles, the government increased fuel economy standards to encourage the production of more efficient cars and imposed a gas tax in 2008 with a progressive tax schedule on cars with higher fuel consumption and to incentivize the purchase of more efficient cars. In 2005, small-displacement cars of 1.6 liters or less accounted for two-thirds of the total ordinary passenger cars in China (CATRC, 2009). The ratio increased to 68.77 percent in 2010 (CAMA, 2011).
In 2009, the Ministry of Finance and the Ministry of Science and Technologies jointly launched a pilot program of 1,000 new energy cars in ten cities to promote the mass production of new energy cars and to reduce cost for the consumers (MOF and MOST, 2009). In railway transportation, the government developed an overall plan and implemented an express railway network with priorities. It is expected that the express railway network will provide alternatives for carbon-intensive rides in airplanes and cars in the long run.
A key sector of the economy, agriculture is of strategic importance in the nation’s low-carbon development. Thirty-seven Mtce fossil fuel, accounting for about 1.14 percent of the total end-use energy consumption was consumed in agriculture and forestry in 2010, while contributing 9.4 percent of the national GDP. Among all industries, agriculture was the only one that has stabilized its energy consumption in the 11th FYP, at about 35–37 Mtc per year. Energy intensity showed a sharp decrease of 17.4 percent from 2005 to 2010.
It is notable that the embedded carbon emissions associated with agricultural production increased. In 2009 the embedded carbon emissions in agriculture production materials were 325 MtCO2-eq, or 2.6 times as much as the direct emissions in agriculture. Fertilizer was a major source of embedded carbon emissions, accounting for about 86 percent of all sources. Need-based fertilization was an effective measure to reduce the total fertilizer use and thus to reduce the embedded carbon emissions in agriculture.
China’s agriculture shows strong low-carbon features compared to many other countries. Compared to the agricultural energy consumption in some OECD countries in 2006 by the purchase power parity (PPP) method (IEA, 2009), China’s agricultural energy consumption was as low as 0.31 tce/10,000 international dollars, only 19 percent of the average level of the OECD countries. It was 24.4 percent of that in Australia, 22.1 percent of that in the US, and 36.5 percent of that in Japan.
The large scale of reforestation in China contributed to forest carbon sequestration. In 2009 forest coverage rate reached 20.4 percent, achieving the 11th FYP target for forest coverage. A nationwide general survey of forest stock from 2004 to 2009 showed that China’s forestry carbon sink amounted to 22,290 MtCO2, a total increase of 10.4 percent compared to the previous survey period (1998–2003), an annual increase of 420 MtCO2 on average. Ifo Institute–Center for Economic Studies, a think tank of the German government, reported that China developed 73 percent of total new forest in the world (Xinhua News Agency, 2010), and despite that forested areas globally reduce by 20,000 hectares per day on average, China’s continuous effort in reforestation ensured a steady increase in forestland, which greatly contributed to China’s low-carbon development and global CO2 emission reductions.
Factors contributing to low-carbon development
A key factor for the progress of low-carbon development in China during the 11th FYP was the making and effective implementation of a number of important policies. These policies have helped to lay an institutional foundation for low-carbon development in the long run.
Technical and infrastructure foundation
During 2006–2010, driven by mandatory energy conservation targets, policy incentives, market competition, and desire for profit, many companies, especially medium and large companies in energy-intensive industries, have upgraded their technologies and devoted efforts to developing and adopting energy efficiency and renewable energy technologies, laying a critical technical foundation for their low-carbon development in the future. They phased out backward technologies and equipment, adopted new technologies and facilities, and expanded production capacity and R&D capacity in energy efficiency and new energy equipment and technologies. In terms of adoption and dissemination of low-carbon technologies, many sectors including building, transportation, and other consumption sectors have achieved significant success.
A study conducted by McKinsey showed that four quarters of technological innovation and adoption had negative costs, meaning that a financial gain can be achieved through energy-saving and carbon abatement measures (McKinsey & Company, 2009). However, it must be noted that the concept of “cost” here only refers to the direct cost of deployment of the related technology. Removing barriers to applying the related technology could be quite costly, as McKinsey pointed out.
Technology innovation is usually achieved through a combination of several factors—technology transfer from other countries, scaling up the adoption of energy efficient technologies through investment, and enhanced R&D. During the 11th FYP, technology innovation was achieved in many sectors in China, including the iron and steel, non-ferrous, chemical, cement, textile, and pulp and paper industries. Technology innovation showed several features. First, it was driven by explicit goals to adopt the best available technologies to achieve energy conservation and to develop new energies. Second, it was an overall upgrade covering large enterprises and involving large projects. For example, technology innovation was the focus of the “Ten Key Energy-Saving Projects.” Third, innovation of technologies covered not only production but also consumption sectors such as the building and the transportation sectors.
Infrastructure was an important carrier for technologies and its construction required technology inputs. Urban planning was treated as a tool for low-carbon development, and urban planners started to integrated the low-carbon concept into their planning and development of urban infrastructure, especially transportation routes and facilities. The Transport Oriented Design (TOD) and public transport became popular concepts among the planners and policy makers in many cities, especially those in medium and large cities. In terms of building facilities, the new building efficiency standards put forward new norms for building energy conservation, including raising the standard for the insulation coefficient for external walls. By the end of 2009, 99 percent of building design and engineering and 90 percent of constructions in new urban building followed mandatory energy efficiency standards in China. Nationwide, the area of energy-saving buildings reached 4.08 billion m2, accounting for 21.7 percent of total urban building area (NDRC, 2010). The development of communication infrastructure and facilities also contributed to energy conservation and low carbon development.
Policy innovation
During the 11th FYP, China developed a series of laws, regulations, norms, and policies which constitute a legal and policy framework for its low-carbon development. The Renewable Energy Law that came into effect in 2006 and the Energy Conservation Law amended in 2007 together provided a legal framework for low-carbon development. With the implementation of the Renewable Energy Law, wind and solar power generation experienced dramatic growth. In December 2009, the standing committee of the National People’s Commission amended the Renewable Energy Law to increase national support for grid connection for wind and solar power plants. The new Energy Conservation Law defined energy conservation as a foundational national strategy.
Low-carbon development became a consensus among the top leaders in the central government and a commitment for the future. President Hu declared that China would actively develop toward a low-carbon economy in the APEC summit in 2007 and in the United Nations Conference on Climate Change in 2009. Premier Wen also expressed China’s commitment to develop its low-carbon economy in the Copenhagen meeting in 2009. Such strong political commitment was reflected at different levels of policy, from the 11th FYP to a series of specific sectoral policies aiming at promoting energy conservation and efficiency. There were “command and control” policies such as phasing out backward technologies and capacity, replacing them with more energy-efficient ones, and regulating market access for enterprises in energy-intensive industries, as well as incentives such as tax breaks, financial support, and economic instruments such as tiered pricing for electricity. The central government also helped build capacity in local governments and to support the development of the energy-efficiency market by providing incentives and assistance to energy service companies.
Institutional development
China established in 2007 the Leading Group on Climate Change and the Leading Group on Energy Conservation and Pollution Reduction; both are led by Premier Wen Jiabao. In addition, the National Energy Expert Council and the National Climate Change Expert Council were established. Local governments at provincial and municipal levels also established similar institutions. These institutions have proved to be critical in strengthening the leadership on low-carbon development in the country.
Policy implementation was greatly improved due to the establishment of the energy-saving target responsibility system (TRS) which disaggregates the energy-saving target among all levels of local government and major energy users. The energy-saving performance of local governments and major enterprises were closely monitored and assessed. Leaders of the local governments were held accountable for implementing energy-conservation policies and achieving the targets. Three schemes for data collection, supervision, and evaluation were developed accordingly to support the TRS. This system put the emphasis on local governments, which was distinctly different from the previous system under central planning before 1998. The old system relied on various ministries for implementing the energy-saving policies.
An energy-conservation market was newly established with the support of the government’s legal and policy framework, covering the full purchase of renewable energy generation by law, and the electricity wholesale rate-setting process. Enterprises were motivated to participate in Clean Development Mechanism projects, investing in renewable energy projects and implementing energy efficiency upgrades via public tender.
Industrial associations, NGOs and other related organizations started to play a more active role in low-carbon development. Both international and domestic NGOs are quite active in the field, reshaping the landscape of governance. Healthy interaction among the government, the enterprises, the market, and the society is gradually evolving.
International cooperation
Energy conservation, clean energy, and climate change were the focal areas for international cooperation. China and the US set forth to collaborate on climate change and clean energy, which was the centerpiece of the bilateral cooperation and played an important role in their strategic and economic dialogue. Such cooperation included expanding R&D for building efficiency, clean coal, and electric vehicles. It is notable that besides cooperation with developed countries, China also conducts extensive cooperation with developing countries on low-carbon technologies, which constitutes an important part of south–south cooperation.
Characteristics of China’s low carbon development
Total emissions increased rapidly while emission intensity was decreasing
China’s CO2 emissions intensity dramatically decreased; however, total CO2 emissions still rapidly increased during the 11th FYP. The X-shaped curve with decreasing intensity and increasing total emissions was the primary feature of China’s low-carbon development in this period.
China’s total energy consumption increased by 178 Mtce annually on average, which translated into a total increase from 2,360 Mtce in 2005 to 3,250 Mtce in 2010, an increase of 37.7 percent in five years. China’s energy-related CO2 emissions increased from 5.147 Gt in 2005 to 6.93 Gt in 2010, an increase of 34.64 percent in total or by about 7 percent annually on average, a rate 3.38 times as high as the world average (BP, 2011).
The energy and manufacturing industries accounted for over 70 percent of China’s total CO2 emissions. As a result, these two were also the priority of China’s implementation of energy-saving policies. These two industries witnessed both significantly decreasing energy and carbon intensity and notably increasing total energy consumption and emission, which exemplifies China’s story of energy and carbon as a whole (see Figure 6.6). As industrialization, urbanization, and export-oriented GDP growth continue, the “X-shaped” curve with decreasing intensity and increasing total emissions will be the primary feature of China’s low-carbon development in long time.
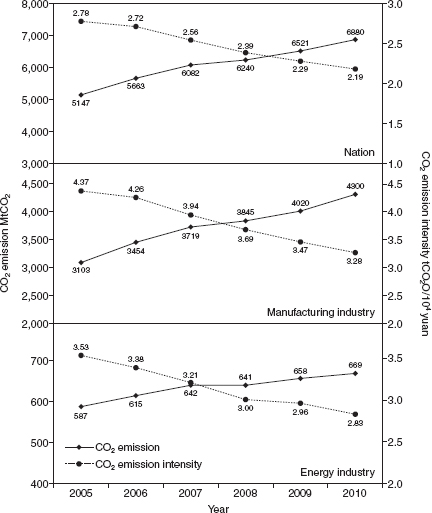
Figure 6.6 CO2 emission and CO2 emission intensity in the energy industry sector, the manufacturing industry sector, and the nation (2005–2010).
Large scale and high effectiveness
China was able to avoid a total of CO2 emission of 1.55 billion tons, about five times of the EU greenhouse gas emission reduction target under Kyoto Protocol. Such a large scale and a sharp transition are unprecedented in the world. The successful transition manifested the high effectiveness of central government’s policies. These policies have two prominent characteristics. First, administrative power was fully deployed, including performance evaluation of the local governments and state-owned enterprises by the higher-level government, and administrative approval. Second, the government invested a tremendous amount including financial transfer and subsidy, incentives, interest discount, and favorable loans. The administrative power motivated local governments and state-owned enterprises to expand their inputs, improve their management practices, optimize their structures, and develop new policy measures, while the economic incentives enabled enterprises to better implement the energy conservation policies. These two policy instruments have proved highly effective over a short period of time, even though they require a large amount of input in terms of funding and administrative resources.
High cost
In terms of direct investment, the central government arranged an 89.4 billion yuan budget, and 133.8 billion yuan in special funds for energy saving and emission reduction, adding a 22.32 billion yuan investment to energy saving and environmental protection projects (Xinhua News Agency, 2011). Such an amount only accounts for 10–15 percent of the total national investment (State Council Information Office, 2010). Hence the estimated total investment for energy conservation, environmental protection, and low-carbon development nationwide would be 2–3 trillion yuan. According to McKinsey, China committed about US$100 billion during the first three years and at least the same amount during the last two years of the 11th FYP period to energy conservation and carbon-emission reductions, resulting in a total of at least US$200 billion during 2006–2010. China became the largest investor in renewable energy during the 11th FYP.
To achieve the energy conservation goal of a 20 percent reduction, besides direct investment, China also phased out much backward capacity, including 76.83 GW of small coal-fired power plants (NDRC et al., 2011), 110 million tons of iron production plants (NBS, 2011c), 66.83 million tons of steel production plants, 330 million tons of cement production plants (NBS, 2011c), and 110 million tons of coke production plants (NBS, 2011c). It is worth mentioning that the small coal-fired power generation capacity that China phased out during 2006–2010 exceeded the total installed capacity in the UK. Phasing out such a large amount of backward capacity served the purpose of energy conservation and carbon-emission reductions. However, such a phase-out of obsolete power capacity came at the tremendous economic and social cost of many enterprises, though the government provided some subsidies to compensate their losses.
Third, there was alternative cost involved. As China’s market is yet to be fully developed, administrative measures were the major instrument to implement energy-conservation and carbon-emission reduction policies. However, in many cases the market displays higher efficiency than the government. For example, the EU adopted carbon trade to achieve its carbon-emission reduction goals. China, on the contrary, largely allocated the targets evenly among different provinces. Among the 30 provinces that participated in this program, 20 of them were assigned a target of 20 percent reduction in energy consumption. In reality these provinces vary greatly by their energy consumption and economic development, and their energy conservation potential and cost were also different. In theory, if some provinces want to purchase emission reduction certificates from others, it can be mutually beneficial, thus achieving the so-called efficiency improvement. High energy-consuming enterprises were also assigned a target of 20 percent reduction. Such a clear-cut policy led to losses in efficiency as it cost some enterprises more to achieve emission reductions than others. The trading mechanism would be a market mechanism that helps to improve efficiency.
Finally, energy conservation and emissions reduction involves opportunity cost. If we look into other services the government could provide, the opportunity cost for energy conservation was rather high. A large amount of funding and other resources from the government, enterprises, and society were deployed to energy conservation and carbon-emissions reduction, while this could possibly lead to less resources for other fields, hence an overall loss in social welfare.
Achievements and challenges
China made tremendous progress in energy saving and emissions reduction. For such an enormous economy to shift to a low-carbon economy from high energy consumption and carbon emissions was like changing the tracks for large high-speed train. In addition to internal challenges of balancing economic growth and changing economic growth path, the global financial crisis that occurred in 2008 challenged all efforts on energy saving and carbon reduction.
The first challenge came from the effort to maintain a high rate of economic growth. The central government put forward four trillion yuan investment and ten trillion loans and local governments launched 18 trillion programs. This stimulus package implied that a huge amount of energy was to be consumed and carbon emitted. As a result, a further decrease in energy intensity in 2009 became very difficult. The impact continued in the first half of 2010 and energy intensity of the economy went up (WWF and DRC 2011).
The second challenge had to do with balancing energy saving with poverty alleviation. As a relatively underdeveloped economy, China’s per capita GDP was about 3,700 dollars in 2009, less than one-twelfth of America’s. China now has a population of 150 million under the poverty line defined by the World Bank. Thus, further economic development and increased energy consumption were inevitable. Energy savings and carbon reductions required additional investment and the costs of economic development affected national welfare in the near future. The dilemma still remains as a big challenge for China’s development.
Third, transitioning to a low-carbon economy in the middle of the industrialization and urbanization processes is particularly challenging. Industrialization of most developed countries was supported by rapid increase in fossil-fuel consumption and energy intensity. The link between industrial development and energy consumption was embedded in the growth model of the economy. Therefore, the reverse of energy intensity during the 11th FYP was an unusual success for China considering the current stage of the economy. Low-carbon development in the long run requires change in the economic development model.
China’s economic development has been driven largely by the growth in export and urbanization in recent decades. Although exports have been impacted by the global financial crisis, they have remain at a high level as a major driver of the economy. China’s urban population grew by 45 million, reaching 50 percent of the overall population during the period. Since an urban resident consumes three times more energy than a rural resident, and also because the construction of urban infrastructure consumes much energy, rapid and large-scale urbanization has been and continues to be a main driver of energy consumption and carbon emission in China’s economy.
The 12th Five-Year-Plan period (2011–2015) is a critical period for achieving the 40–45 percent decrease in carbon emission intensity until 2020. China set the target of a “16% decrease in energy intensity and 17% decrease in carbon emission intensity.” With many of the low-hanging fruits picked, further energy saving and emission reduction will involve even greater costs, posing a serious challenge for a developing nation. China’s efforts on low-carbon transition during 11th FYP provided valuable experiences and lessons for the current period. It has been shown that the vision and resolve of the central government on the issue was critically important. Leadership matters. Despite the great difficulties and challenges encountered in the transition process, the goal was virtually completed in the end. Second, policy making and implementation were the basis for the achievement. In particular, the establishment and implementation of energy conservation target responsibility system was the key to the low-carbon transition. Third, adequate funding ensured the implementation of the policies. Implementation of the energy-saving policy was effective, but highly costly due to the undiversified policy measures employed, which remain a key issue in formulating and implementing low-carbon development policies. China has started piloting a market instrument in energy saving and carbon-emission reduction in the 12th FYP and the effect of that will soon be seen.
Acknowledgment
This paper was adapted partly based on Chapter 1 of Annual Review of Low-Carbon Development in China: 2010 (Qi 2011), and the calculation results come from the team of Climate Policy Initiative at Tsinghua. Part of the research funding comes from Climate Policy Initiative funded by the Soros Foundation. We are deeply indebted for their support.
Note
1 Approximately 1,000 of the largest energy consuming enterprises were selected as the primary focus of the industrial energy saving program. This program was called the “Top 1,000 Enterprises Energy-Saving Program,” a key program in the 11th FYP. This program has been scaled up in the 12th FYP to a “Top 10,000 Program,” to cover a much wider range of enterprises.
2 The “Ten Key Energy-Saving Projects” identified ten major areas of industry for national support for energy saving.
References
BEA (Bureau of Economic Analysis, US Department of Commerce) (2011) U.S. Economic Accounts 2010, August 2, online, available at: www.bea.gov/national/[accessed August 16, 2011].
Beijing Daily (2010) “The Proportion of Public Transport Trip Reach 39.3%,” Beijing Daily, July 21, online, available at: http://jtcx.beijing.cn/jtxx/jtxw/n214098639.shtml [accessed July 8, 2011].
BP (2011) BP Statistical Review of World Energy 2011, June, online, available at:www.bp.com/statisticalreview [accessed August 16, 2011].
CAA (Civil Aviation Administration of China) (2011) The 12th Five-Year Plan on China Civil Aviation Development (2011–2015), May 9, online, available at: www.caac.gov.cn/I1/I2/201105/t20110509_39615.html [accessed June 20, 2011].
CAMA (China Automobile Manufacturers Association) (2011) The Information Release of Automobile Sales and Economic Operation of Automobile Manufacturers, January 10, online, available at: www.auto-stats.org.cn/ReadArticle.asp?NewsID=6839 [accessed July 7, 2011].
CATRC (China Automotive Technology and Research Center) (2009) China Automobile Manufacturers Yearbook 2009, China Automobile Manufacturers Association.
CEC (China Electricity Council) (2010) National Electric Power Industry Statistical Yearbook Data 2009, online, available at: http://tj.cec.org.cn/tongji/niandushuju/2010-11-17/160.html [accessed August 16, 2011].
CEC (China Electricity Council) (2011) Review on Development of Electric Power Industry 2010, June 27, online, available at: http://tj.cec.org.cn/niandufazhanbaogao/2011-06-27/58873.html [accessed August 16, 2011].
EIA (US Energy Information Administration) (2010) Annual Energy Review 2010, August 19, online, available at: www.eia.gov/totalenergy/data/annual/, [accessed August 16, 2011].
Han Wei (2011) “What can China support the ‘nuclear’ confidence: Visit Member Yu Zusheng of the Nuclear Safety and Environment Committee of Experts State Environmental Protection Department,” Energy Review, 31 (7): 100–105.
IEA (2009) Energy Balances of OECD Countries, Paris: IEA.
Li Junfeng, Cai Fengbo, Tang Wenqian, Xie Hongwen, Gao Hu, Ma Lingjuan, Chang Yu, and Dong Luying (2011) China Wind Power Report 2011, Beijing: China Environmental Science Press.
McKinsey & Company (2009) China’s Green Revolution: Prioritizing Technologies to Achieve Energy and Environmental Sustainability, February, online, available at: www.mckinsey.com/locations/chinasimplified/mckonchina/reports/china_green_revolution_report_cn.pdf [accessed August 18, 2010].
MOF and MOST (2009) Notice on demonstrating and pilot energy-saving and new energy vehicle, online, available at: www.gov.cn/zwgk/2009-02/05/content_1222338.htm, February 5 [accessed June 20, 2011].
MOR (Ministry of Railways of the People Republic of China) (2011) Railway Statistics Bulletin 2010, May 11, online, available at: www.china-mor.gov.cn/zwzc/tjxx/tjgb/201105/t20110511_23696.html [accessed August 20, 2011].
NBS (National Bureau of Statistics) (1990–2010) The Statistics Bulletin of the National Economic and Social Development of the People’s Republic of China for each year, online, available at: www.stats.gov.cn/tjgb.
NBS (National Bureau of Statistics) (2011a) China Statistics Yearbook 2011, Beijing: China Statistics Press.
NBS (National Bureau of Statistics) (2011b) China Energy Statistics Yearbook 2010, [M] Beijing: China Statistics Press.
(National Bureau of Statistics) (2011c) Series of Reports on Achievements in Economic and Social Development in 11th Five-Year for 16: China’s Economic Restructuring Made Important Progress, March 11, online, available at: www.stats.gov.cn/tjfx/ztfx/sywcj/t20110311_402709772.htm [accessed May 20, 2011].
NDRC (National Development and Reform Commission) (2010) China’s Climate Change Policies and Actions: Annual Report 2010, November 26, online, available at: http://qhs.ndrc.gov.cn/gzdt/t20101126_382695.htm [accessed March 20, 2011].
NDRC (National Development and Reform Commission) (2011a) Thousand Enterprises Exceeded Energy-Saving Target in 11th Five-Year: Review on Energy Conservation and Emission Reduction in 11th Five-Year Plan, March 14, online, available at: www.sdpc.gov.cn/xwfb/t20110314_399363.htm [accessed May 20, 2011]
NDRC (National Development and Reform Commission) (2011b) Ten Key Energy-Saving Projects Have Made Positive Progress: Review on Energy Conservation and Emission Reduction in 11th Five-Year Plan, March 11, online, available at: www.sdpc.gov.cn/xwfb/t20110311_399214.htm [accessed May 20, 2011].
NDRC (National Development and Reform Commission) and NBS (National Bureau of Statistics) (2011) Notice on Performance of Regional Energy-saving Target during the “11th Five-Year,” June 10, online, available at: www.stats.gov.cn/tjdt/zygg/gjtjjgg/t20110610_402731394.htm [accessed June 20, 2011].
NDRC (National Development and Reform Commission), NEA (National Energy Administration), MEP (Ministry of Environmental Protection), and SERC (State Electricity Regulatory Commission) (2011) Announcement of National Development and Reform Commission, National Energy Administration, Ministry of Environmental Protection and State Electricity Regulatory Commission, No. 6, April 22, online, available at: www.sdpc.gov.cn/zcfb/zcfbgg/2011gg/t20110422_407267.htm [accessed May 20, 2011].
Qi Ye (2011) Annual Review of Low-Carbon Development in China: 2010, Beijing: Science Press.
State Council Information Office (2010) The Central Government Fiscal and Budget Invested 128.5 Billion Yuan in the First Four Years of 11th Five-Year Plan, September 29, online, available at: www.scio.gov.cn/xwfbh/xwbfbh/wqfbh/2010/0929/zy/201009/t773380.htm [accessed March 20, 2011].
WWF and DRC (Development Research Center) (2011) Impacts of China’s Economic Stimulus Plan on Climate and Energy Consumption, Beijing: WWF China Program.
Xinhua News Agency (2010) “German think tank issued a communique: China’s plantation area accounted for 73% of the world,” January 20, www.gov.cn/jrzg/2010–01/20/content_1515227.htm [accessed May 20, 2011].
Xinhua News Agency (2011) “Energy consumption of unit GDP is expected to decrease 19.06 during 11th Five-Year Plan,” February 10, online, available at: http://energy.people.com.cn/GB/13888788.html [accessed March 20, 2011].