4 Post-Durban prospects for low-carbon green growth
Introduction
The point of departure of this chapter is the Climate Summit which took place in Durban, South Africa, in December 2011. The chapter starts by placing this Summit in the context of international action, and action at other levels, to mitigate climate change.
While the Durban Summit had a number of positive outcomes, it remains the fact that developing countries will not embrace the emissions reduction necessary to mitigate climate change if they perceive this likely to have a negative effect on their economic growth. The chapter explores the relationship between economic growth and environmental damage. While it is clear that there has been a trade-off between growth and the environment in the past, there is no necessity for this to be so in the future, and the paper presents some evidence that shows how already for some issues this negative link has been broken.
However, for emissions of greenhouse gases, and carbon dioxide in particular, this “decoupling” has yet to be widely achieved. To do so will require stringent policies to transform the energy sector and to direct innovation toward low-carbon development. For environmental sustainability more generally, these policies will need to encompass the whole range of environmental and resource issues.
The chapter then explores the possible cost of such a fundamental change in economic activity and direction. It emerges from the evidence that, despite the transformative nature of the measures required, the macroeconomic costs that they incur are likely to be modest at worst, and there are some conditions under which they may even be negative.
The final section of the chapter explores why, if this is so, governments everywhere find it so difficult to introduce policies that will substantially reduce greenhouse gas emissions and take decisive steps toward environmental sustainability more generally.
The framework for climate policy is a classic case of seeking to address a problem of global dimensions through multi-level governance. At the global level the UN Framework Convention on Climate Change (UNFCCC), with its annual Conferences of the Parties (COPs), Kyoto Protocol (1997) and its annual Meetings of the Parties (MOPs), seeks to set the global direction of both mitigation of and adaptation to climate change, supplemented by G20 processes and discussions. Supranationally there is the European Union (EU)’s 20/20/20 by 2020 Program and associated policies. Most countries now have national policies and programs related to climate change, sometimes supplemented in federal countries (for example, the United States), by State-level policies and programs, and/or implemented at that level or at regional/city/local level, again sometimes augmented by additional ambitions or obligations.
Globally, the search for an agreement to follow the Kyoto Protocol, which was to expire at the end of 2012, began at COP 2007 in Bali, with a view to reaching a new agreement at the Copenhagen COP in 2009, which those countries most concerned about climate change hoped would have a number of elements, reflecting or being associated with significant developments in the negotiating positions of major parties to the UNFCCC.
Most important among these hopes was probably the taking on of new binding emission targets for 2020 by Kyoto developed country signatories (e.g., 20–40 percent below 1990 levels), together with commitments from major emerging economies to energy intensity targets, to be converted into absolute targets in due course. The taking of new target and energy intensity commitments would be facilitated by full US engagement and leadership in the process, on the basis of having passed some climate legislation through Congress, while China, as the other most important emitting party, would also make some extra gesture of commitment (e.g., carbon tax). Beyond Copenhagen, it was hoped that there would be a clear joint leadership commitment by the US and China to lead and work through a detailed deal, an important part of which would involve a substantial financing package for developing countries in relation to mitigation and adaptation.
In the event, very little of this materialized. Instead there was last-minute agreement by a number of countries to the Copenhagen Accord, the most significant elements of which were recognition and acceptance of the need to limit the average global temperature rise to 2°C; acceptance by major developing countries that they must be part of any post-Kyoto solution; and agreement by developed countries to contribute to funds for climate mitigation and adaptation in developing countries of at least US$30 billion by 2013 and US$100 billion by 2020.
At the Cancun COP in 2010, the Copenhagen Accord was incorporated into the UNFCCC Treaty, with the emission reduction commitments that had by then been received from all industrial countries and major developing countries, which together accounted for over 90 percent of global energy-related emissions. There was also progress on funding, and on reducing greenhouse gas emissions from deforestation and forest degradation (REDD+) in developing countries. But there was no agreement on the continuation of Kyoto Protocol, such that industrial countries had further bindings targets, but developing countries did not; in fact there were no post-2012 binding international commitments from anyone except EU countries, and the voluntary emission reduction commitments that had been made were nowhere near adequate to fulfill the aspiration to keep average global warming below 2°C, which would require emissions reductions of a scale to move to an emissions trajectory such as the shaded reduction trajectories shown in Figure 4.1.

Figure 4.1 The temporal relationship between emissions and atmospheric concentrations of greenhouse gases (source: Malte Meinshausen, Potsdam Institute for Climate Impact Research, 2007, a version of which was published in WBGU (2007, Figure 8.2.1, p. 165), based on Meinshausen, 2006).
Note
1 Emissions reductions required in order to avoid global warming of more than 2°C: The lighter and darker gray curves showing emissions reductions are the emissions pathways along which there is a 50 and 75 per cent probability respectively of achieving this target. The various SRES scenarios developed by the IPCC are shown for the purpose of comparison. These do not allow for any explicit climate change mitigation policies.
The 2011 COP in Durban sought to build on the Cancun Agreement, and agreed a second commitment period for the Kyoto Protocol for some states from 2013 to 2017 and some of the details for the operationalization of the green climate fund. But undoubtedly its main achievement was to win agreement on the Platform for Enhanced Action, which requires the 194 parties to UNFCCC to develop by 2015 some instrument, to come into force by 2020, to be applicable to all parties and have legal force, and to reduce global greenhouse gas emissions, limit temperature rise and help developing countries make the transition to a cleaner energy economy. This is the first time that both developed and developing countries have agreed to put in place such an instrument with no explicit prior distinction between them, so that all countries are now committed to the prospect of legally binding emissions reduction.
The situation in international climate policy in the years to 2015 therefore recognizes that curbing global warming requires international cooperation between and commitments from all countries to reduce emissions of greenhouse gases, but the fact remains that developing countries will not accept emission control if they think it will impede their development. Committed industrial countries (like the UK and South Korea) will need to show that deep emissions control is compatible with continued economic growth and development, so that the best hope for emission control is the emergence of a “green race” for low-carbon technologies, leading to the development of a “green economy.” “Green growth” is now the strategic economic imperative if meaningful greenhouse gas emission reduction is to be achieved.
Economic growth, green growth and environmental sustainability
Any aspiration for a “green” or sustainable economy, or for sustainable, or “green,” economic growth, must start from the recognition of the need for the sustainable use of resources and ecosystems, and be rooted in basic laws of physical science, which hold that indefinite physical expansion of the human economy on a finite planet is impossible; and that all use of non-solar forms of energy creates disorder, and potential disruption, in the natural world. The laws of thermodynamics mean that, at a certain physical scale, further physical growth becomes counterproductive, and there is now substantial evidence that, except from a very short-term perspective, there is little doubt that this scale has now been exceeded. Work by Rockström et al. (2009) suggests that this is already the case for biodiversity loss, climate change, and the nitrogen cycle, with the phosphorus cycle also fast approaching the limit.
The Rockström analysis is entirely consistent with the more detailed assessments of climate science of IPCC (2007) and the Millennium Ecosystem Assessment (MEA 2005), which make clear that without a radical reform of the human–nature relation—in favor of nature—human civilization is at grave threat. Specifically, the evidence strongly suggests that 9 billion humans cannot live current Western lifestyles and maintain a habitable planet: the first thing to go will be climate stability, the whole biosphere may then start to unravel.
Bizarre as it may seem in the light of these physical challenges, representations of the economy from which the ecological dimension is completely absent are by no means unusual. As Daly (1991, p. 33) has observed, all too often the economy is conceived as an abstract flow of exchange value between households and firms, and, through taxes and transfers, between these and governments. Social and ethical issues may be considered in such a framework, through such questions as: Who should get what? Or, through what institutions should production and consumption be mediated? But issues of resources and environmental quality often do not arise.
The global challenge of mitigating climate change
This omission is rectified in the formulation of the relationship between the human economy and natural world shown in Figure 4.2, which emphasizes the ecological scale of the economy compared to the planetary ecosystem, or biosphere, of which it is a subsystem. It shows that human populations and economic activities extract high-grade energy, materials, and ecosystem services from the natural environment, and discharge low-grade energy and wastes back into it, with consequent degradation of ecosystems that produce the services. Initially (before the industrial revolution, say) the economy was relatively small compared to the global ecosystem, of which it is a subsystem, as already noted. Such an economy would be likely to experience at most local environmental constraints. However, as economic activity has expanded, so has the throughput of energy and materials. The physical requirements of, and consequent wastes from, a much bigger economy are more likely to cause global environmental disruption. Clearly such expansion cannot continue indefinitely in a biosphere of finite size. A relevant question in such circumstances is how much the human economy can expand physically, or, as Herman Daly (1991, p. 34) asks: “How big should the subsystem be relative to the total ecosystem? Certainly this, the question of optimal scale, is the big question for environmental macroeconomics.”

Figure 4.2 The economy as a subsystem of the biosphere (source: adapted from Goodland 1992, p. 5).
As already noted, physical growth is growth in the amount of matter/energy mobilized by the economy. Indefinite growth of this kind is impossible in a finite physical system subject to the laws of thermodynamics. Economic (GDP) growth is growth in money flows/incomes/value added/expenditure. There is no theoretical limit to this kind of growth. To most economists, the physical size of the economy is not a matter of much interest and has received very little study relative to the study of financial measures. What is considered important is its size in terms of Gross Domestic Product (GDP), and the growth of GDP from year to year. What economists actually should focus on is not even growth in GDP, but growth in human welfare. All these different issues—the physical size of the economy, its monetary size, and the human welfare it produces—have a complex relation to each other (Ekins 2000).
Since the industrial revolution, growth in money has been positively linked to growth in physical flows, but there is no theoretical reason why this has to be the case. Indeed, for many environmental issues in a number of countries there has been “absolute decoupling” between economic growth and activity, such that the economy has grown but environmental impacts have decreased. Thus, in Table 4.1 absolute decoupling has occurred in those environmental columns where the number is less than 100, from which it is clear that this is the case for most local air pollutants, especially in the richer countries shown in the table.
Table 4.1 GDP and domestically produced emissions indices, selected OECD countries, 2005 (1990 = 100)
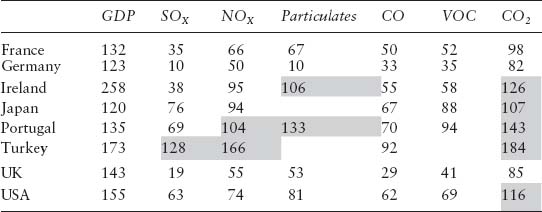
Source: Everett et al. 2010, p. 22.
Notes
1 International aviation and shipping emissions are excluded from the ‘territorial’ emissions figures, but the economic benefits from aviation and shipping are included in GDP.
2 Shading = no absolute decoupling
However, Table 4.1 also shows that policy attempts to date to break the link between GDP growth and carbon dioxide have not been particularly successful so far, and will need to be far more successful if serious environmental disruption from climate change is to be averted. Such absolute decoupling of economic growth from global systemic environmental impacts such as greenhouse gas emissions and biodiversity loss is probably the greatest challenge facing aspirations to move toward environmental sustainability. Examples of policy approaches deriving from Stern (2007) that could meet the low-carbon part of this challenge are given in the next section.
Economic growth arises from applied knowledge and innovation that turn non-resources into resources or find better ways of doing things. Fossil fuels existed for millennia before they became resources for human activity, because of lack of knowledge about how to use them. Investment in knowledge and innovation is now at an all-time high globally. Moreover, there is no shortage of renewable energy if humans knew how to harness it (cost-)effectively for their purposes, just as there is no shortage of materials if humans knew how to manipulate and use them.
However, the key insight from environmental sustainability thinking is that, to be sustainable, economic growth must be consistent with biophysical reality, and, as the Rockström et al. (2009) evidence above shows, is currently not so. In respect of climate change, achieving the levels of emission reduction required to keep global warming below 2°C, as shown in Figure 4.1, would require carbon and energy intensity (where this is defined as carbon emissions or energy use divided by GDP) to decrease at an unprecedented rate. To illustrate, Jackson (2009, pp. 79–80) notes that global carbon intensity over 1990–2008 decreased by 0.7 percent per annum on average, but this was overwhelmed by population and economic growth over the same period, so that global emissions grew by 2 percent per annum. To reach greenhouse gas atmospheric concentrations of 450 ppm (which broadly corresponds to a 50 percent chance of keeping the global temperature increase to below 2°C [Stern 2007, p. 220]) by 2050, emissions would need to fall by about 5 percent per annum. With continuing economic growth of 2.1 percent per annum, carbon intensity would have to fall by around 7 percent per annum, or about ten times faster than it has since 1990. The policy challenge to achieve these kinds of changes in energy use is enormous.
Policies for environmental sustainability
The Stern Review (Stern 2007) recommended the simultaneous application of three kinds of policies to mitigate climate change. Most important was carbon pricing, which could be implemented through carbon taxes or emission trading. This needed to be supplemented with policies in two other areas.
The first area was technology policy, to accelerate the development and deployment of low-carbon energy sources and high-efficiency end-use appliances/buildings, to incentivize a huge investment program and to remove other barriers to technology deployment; the second area was the promotion of behavior change, to facilitate the take-up by consumers of new technologies and high-efficiency end-use options, and the adoption of low-(carbon) energy behaviors (including less driving, flying, meat-eating, and lower building temperatures in winter and higher in summer).
For full environmental sustainability beyond climate change, the basic insights from the Stern Review need to be applied to the use of other environmental resources (water, materials, biodiversity [space]). As with carbon, in a market economy, pricing is the key to resource efficiency, investment, and behavior change, which emphasizes the importance of environmental tax reform (ETR), to be discussed in more detail below.
Over the last fifteen years the UK has shown enormous policy innovation in relation to climate change and introduced many different policies, including the Climate Change Act in 2008, which set a greenhouse gas reduction target of 80 percent below 1990’s level by 2050, and put in place a mechanism for five-yearly carbon budgets in the years until then, to ensure that progress toward the target was adequately monitored. As a result of such in the UK and other countries, it is now clear what policies are required to reduce greenhouse gas emissions significantly, but so far their application has had only limited effect, because they have not been applied stringently enough—the main contributions to UK emission reduction since 1990 have been the shift from coal to gas in power generation in the 1990s, and the recession in 2008–09, neither of which were the result of climate policy. Moreover, although many national policies need local implementation/enforcement, there is no evidence of effective autonomous local policy action.
This is not the place to set out UK climate policy in any detail,1 so suffice it here to note that it includes numerous examples of all four of the main types of policy instrument: economic instruments, regulation, voluntary (sometimes called negotiated) agreements, and information/education instruments.
The economic instruments include energy taxes on business and transport fuels, the EU Emissions Trading System (ETS), Feed-in Tariffs for small-scale renewable electricity generation, a Renewable Heat Incentive, the Green Deal to improve energy efficiency in buildings, a Green Investment Bank, capital grants, and subsidies for demonstration projects (for example, in relation to carbon capture and storage, CCS).
Regulatory instruments include the EU-driven target for renewables (15 percent of final demand by 2020), the Renewables Obligation, the Renewable Transport Fuel Obligation, the Carbon Emissions Reduction Target to improve household energy efficiency, and the Energy Company Obligation, which replaces it, Integrated Pollution Prevention and Control (now applied at the EU level), and Building Regulations, which are due to deliver “zero-carbon” new homes by 2016.
The most important of the voluntary agreements at the UK level are the Climate Change Agreements. At EU level they include the EU fuel efficiency agreements, now extended to 2020.
Information/education instruments include energy efficiency labels for appliances and vehicles, and the projected roll-out of smart meters to all households in the UK by 2019. There has also been an increase in government funding for energy research and development.
Over the last ten years it has also become clear that the current liberalized electricity market will not deliver the large quantity of low-carbon new power capacity that will be required to meet the UK’s emissions targets, leading to proposals for a far-reaching electricity market reform (DECC 2010). There are four proposed elements to this:
• carbon price support (a carbon tax on the fossil fuel inputs to electricity production);
• feed-in tariffs for low-carbon generation, to replace the Renewables Obligation;
• capacity payments (per Mw of reserve), to ensure that there is adequate back-up capacity for the higher proportion of intermittent renewables that is expected, and an
• Emissions Performance Standard, to ensure that no new coal-fired stations are built without carbon capture and storage (CCS).
There are also new arrangements for charging for transmission and distribution, to ensure that the requisite infrastructure is built to transmit and distribute the new sources of low-carbon power.
Figure 4.3 shows the form of the feed-in tariff (FIT) that is being proposed, a Contract-for-Difference that will guarantee low-carbon generators a price for their power (here shown as around £70/MWh), and paying them the difference between this and wholesale price of electricity when the wholesale price is below the contract price (the shaded area above the black line in Figure 4.3), but claiming back the difference when it is above it (in Figure 4.3 only for a short period in 2008). The shaded area below the black line in Figure 4.3 shows the part of the price that is recovered through the wholesale market.
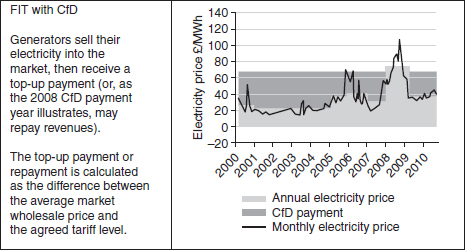
Figure 4.3 Proposed model of UK feed-in tariff, contract-for-difference (source: DECC 2010, p. 50).
Figure 4.4 shows a second element of the proposed Electricity Market Reform, the carbon price support. This is intended to guarantee a carbon price on the inputs to power generation. Electricity is included in the EU ETS and the lighter part of the bars in Figure 4.4 (which comprises the whole bar for 2010, 2011, and 2012) show the projected price of the emission allowances in the EU ETS, which is thought likely to be too low to give adequate incentive for low-carbon generation. It is therefore proposed to top-up the EU ETS allowance price with a carbon tax on the inputs to power generation, shown by the darker part of the bars from 2013 in Figure 4.4, that will put the carbon price in electricity on a fixed rising trajectory, to give certainty to low-carbon generators about the carbon price which their fossil-fuel competitors will face. In Budget 2011 the carbon price was set to rise from £16/tCO2 in 2013 to £30/tCO2 in 2020 (HMT 2011, p. 32), with a further projected increase to £70/tCO2 in 2030. To achieve this price, the carbon tax was set at £4.94/tCO2 for 2013–14 (i.e., the EU ETS price was thought likely to be around £11/tCO2 at that date).
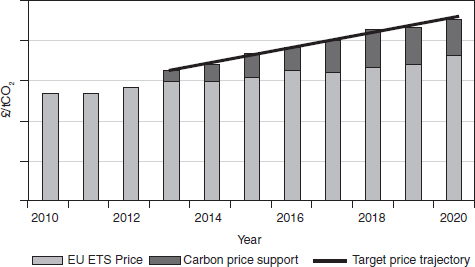
Figure 4.4 Carbon price support proposed in the UK (source: HMT 2010, p. 17).
The question now arises as to the likely costs of these extensive policies for carbon mitigation and, by implication, of moving toward environmental sustainability more generally. This is the subject of the next section.
The costs of moving toward environmental sustainability
There is little agreement among economists as to the costs likely to be incurred by moving toward environmental sustainability.
Optimists tend to stress that the “costs” are really investments, which can contribute to GDP growth; that there are considerable opportunities for zero—or even negative—cost mitigation; that a number of resource-efficient technologies are (nearly) available at low incremental cost over the huge investments in the economic system that need to be made anyway; that “learning curve” experience suggests that the costs of new technologies will fall dramatically; and that resource efficiency policies can spur innovation, new industries, exports, and growth. Pessimists tend to counter that constraining resource use is bound to constrain growth, and that cheap, abundant energy and other resources have been and continue to be fundamental to industrial development.
Which of these views is right, and to what extent, is an empirical matter. For the issue of climate change (but not so much other global environmental issues considered by Rockström et al. 2009), there is now a considerable body of evidence available on the basis of which a judgment between these positions can be made.
The hope for affordable economic cost in the mitigation of climate change essentially rests on three hypotheses: that carbon emissions can be reduced substantially by changes in human behavior that have essentially nil cost (for example, cycling short distances instead of driving; turning down the thermostat and wearing more clothes indoors, etc.); that further significant emission reduction can come for improved energy efficiency in households, companies, and transport that is also available at low or nil cost; and that renewable and low-carbon energy sources are available at low cost as a percentage of GDP.
An oft-cited example of the relatively low costs of substantial initial tranches of carbon abatement is the so-called McKinsey marginal abatement cost curve (McKinsey 2007). This arranges various carbon-reduction technologies by their marginal abatement cost (on the y-axis) and the amount of carbon abatement which they can deliver at that cost (the x-axis). The McKinsey curve shows that, globally, about 5 GtCO2e can be abated at negative net cost, and a further 21 GtCO2e can be abated at a marginal cost of less than €40/tonCO2e. The GDP cost of such abatement would not be high.
Another way of looking at the same issue is through the technological potential identified by the so-called Socolow Wedges. Figure 4.5 illustrates this. With no abatement it is projected that global greenhouse gas emissions will increase from their 2000 level of around 8 GtCO2e to 16 GtCO2e. Socolow identified a number of technologies that he considered had the potential, if extensively deployed, to reduce these additional emissions by 1 GtCO2e. The technologies, and their required deployment, included:
• efficient vehicles: increase fuel economy for two billion autos from 30 to 60 mpg
• nuclear: tripling of capacity to 1,050 GW
• gas for coal substitution: 1,400 GW of electricity generation switched from coal to gas
• carbon capture and storage: introduce CCS at 800 1 GW coal stations
• wind power: fifty times as much wind power as at present.
• solar photovoltaics: 700 times 2004 capacity
• hydrogen: additional 4,000 GW of wind capacity or additional CCS capacity
• biomass fuel: 100 times the current Brazilian ethanol production

Figure 4.5 Potential of different low-carbon technologies (source: adapted from Socolow 2005).
The required deployments are therefore very considerable, and would require huge investments. However, the argument is that the technologies are now available, or very close to being so, and what is now required are the incentives to cause them to be deployed at scale.
These technologies currently cost more, and in some cases significantly more, than their fossil alternatives. However, it is expected that their large-scale deployment would cause their cost to be reduced. Some of the evidence on which such an expectation is based is cited in Stern 2007 (p. 254), which shows that a number of new low-carbon technologies for power generation, including wind power and solar photovoltaics, have indeed experienced significant cost reduction as they are progressively deployed.
In order to make calculations of the macroeconomic cost of carbon abatement from the essentially microeconomic costs of individual technologies of energy efficiency or supply, it is necessary to make use of energy and economic models, with which, again, there is now a lot of experience in respect of modeling the costs of mitigating climate change (though much less in respect of other environmental issues). Two examples of the use of such models are given here.
The first is of a hybrid model, consisting of a MARKAL energy system model linked to a small macroeconomic model of the UK (Strachan and Kannan 2008). MARKAL stands for MARKet ALlocation, and the MARKAL model is a dynamic optimization model with 100+ users in more than thirty countries coordinated by the Energy Technology Systems Analysis Program (ETSAP) network of the International Energy Agency (IEA). It is a least-cost optimization model based on the life-cycle costs of competing technologies (to meet energy service demands). It is technology rich, depicting in detail end-use technologies, energy conversion technologies, refineries, resource supplies, infrastructure, etc. and combining these into an integrated energy system including energy carriers, resources, processes, electricity/CHP, industry, services, residential, transport, and agriculture, and a range of physical, economic, and policy constraints to represent the UK energy system. The linkage to a macroeconomic model enables the GDP cost of energy system changes to be calculated.
Figure 4.6 shows an example of such a calculation. The model was used to simulate a number of scenarios all of which entailed a 60 percent reduction in UK CO2 emissions from 1990’s level. Different scenarios incorporated central, high, and low fuel prices (the former showed the lowest reduction in GDP, about 0.3 percent, by 2050); a straight-line trajectory (SLT) of emission reduction, which reduced GDP by about 0.8 percent by 2050; two scenarios that constrained the introduction of nuclear power and carbon capture and storage (CCS), which reduced GDP by 0.7 percent and 0.9 percent respectively by 2050; and two scenarios that constrained innovation (represented in the model by cost reduction). Figure 4.6 shows that the GDP cost by 2050 of the most expensive scenarios of carbon reduction (when no innovation was permitted) was 1.2 percent for the 2020 date limit and 1.5 percent for the 2010 limit, which is very much below the estimate in the Stern Review, for example, of the costs of unabated climate change.

Figure 4.6 GDP percentage changes – UK MARKAL MACRO (source: Strachan and Kannan 2008, p. 2960).
The second example comes from three linked projects that investigated the economic and environmental implications of a policy instrument called environmental (or ecological) tax reform (ETR), which is the shifting of taxation from “goods” (like income, profits) to “bads” (like resource use and pollution). The basic hypothesis of ETR is illustrated in Figure 4.7, which suggests that ETR can lead to higher human well-being (or welfare) both by improving the environment, and by increasing output and employment, and potentially also by stimulating green innovation.

Figure 4.7 The potential contribution of environmental tax reform to human well-being.
The first project, called COMETR, investigated the competitiveness effects of environmental tax reforms.2
In the COMETR project, the environmental and economic effects of the ETRs that had been implemented in six EU countries (Denmark, Finland, Germany, Netherlands, Sweden, UK) were modeled. As would be expected, and as shown in Figure 4.8, environmental impacts in those countries were reduced by the policy measure.

Figure 4.8 The effects of environmental tax reform (ETR) on greenhouse gas (GHG) emissions in ETR countries (source: Barker et al. 2007, Chart 7.4, p. 46).
Perhaps more significantly, the modeling showed, as in Figure 4.9, that the ETR countries experienced slightly faster economic growth than they had without the ETR, and the non-ETR countries in the EU showed practically no change. This suggests that, far from damaging the competitiveness of ETR countries compared to the non-ETR countries, the ETR countries benefited economically, as well as environmentally, from the policy.

Figure 4.9 The effects of environmental tax reform (ETR) on GDP in ETR and non-ETR countries (source: Barker et al. 2007, Chart 7.32, p. 67).
The second project, called PETRE, was one of four final projects of the Anglo-German Foundation under the collective title “Creating Sustainable Growth in Europe.” PETRE explored the subject of “Resource productivity, environmental tax reform (ETR) and sustainable growth in Europe.”3
A major objective of the project was to investigate through modeling the implications of a large-scale ETR in Europe. The project used two European macroeconometric models, E3ME and GINFORS, and explored six scenarios.
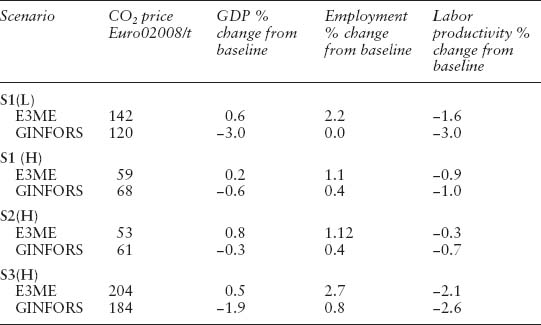
The first scenario was a Baseline with a low energy price (LEP); to assess the sensitivity to energy prices, a second Baseline was created with a high energy price (HEP), and this was adopted as the Reference case. Scenario 1 (S1(L)) simulated an ETR with revenue recycling designed to meet the EU 2020 greenhouse gas (GHG) reduction target (a 20 percent reduction from 1990 levels), compared with the LEP Baseline. Scenario 2 (S1(H)) simulated an ETR with revenue recycling to meet the same GHG reduction target, but with high energy prices and therefore compared with the HEP Baseline). Scenario 3 (S2(H)) was as S1(H), but with a proportion of revenues spent on eco-innovation measures. Scenario 4 (S3(H)) was S1(H) but the ETR with revenue recycling was designed to meet the EU’s 30 percent “international cooperation” GHG emission reduction target by 2020.
The taxes in the ETR were a carbon tax on all non-EU ETS sectors equal to the carbon price in the EU ETS that delivers an overall 20 percent reduction in GHG emissions by 2020 (as noted above, in the “international cooperation” scenario (S3(H)) this is extended to a 30 percent GHG reduction). Aviation is included in the EU ETS at the end of its Phase 2 in 2012. In the power generation sector EU ETS permits are 100 percent auctioned in Phase 3 of the EU ETS (from 2013) (this does not change carbon prices or emissions). All other EU ETS permits are 50 percent auctioned in 2013 increasing to 100 percent in 2020. In addition, taxes on materials are introduced at 5 percent of their total price in 2010, increasing to 15 percent by 2020. In S3(H), the “international cooperation” is implemented by imposing a carbon tax in major non-EU OECD countries at the same rate as in the EU, and at 25 percent of that rate in emerging economies.
The increased taxes are offset by reductions in income tax rates (for households) and social security contributions (for businesses) in each of the member states, such that there is no direct change in tax revenues. In S2(H) 10 percent of the environmental tax revenues are recycled through spending on eco-innovation measures.
Table 4.2 shows the results of the modeling. It shows that E3ME projects a small GDP gain from the ETR policy, while GINFORS projects a slightly larger loss. Even the 30 percent EU CO2 reduction target is reached in GINFORS with the loss of less than 2 percent of GDP. Both models suggest that ETR will increase employment.
Table 4.2 Results from the environmental tax reform (ETR) in the PETRE project
Source: Ekins 2009a, p. 31.
Environmentally the S3(H) scenario has the effect of stabilizing global GHG emissions over 2010–20, as shown in Figure 4.10, while S1(H), the unilateral EU scenario with low energy prices, has a negligible effect on global emissions.

Figure 4.10 The effect of environmental tax reform (ETR) on global CO2 emissions, GINFORS (source: Ekins 2009a, p. 48).
The third recent body of work on ETR to shed light on the effects of this policy instrument was that of the UK Green Fiscal Commission.4 This was set up in 2007, with its major objective being to investigate the economic, social, and environmental implications of major green fiscal reform (GFR), such that the share of environmental taxes in total revenues might rise from 5 percent to 15–20 percent in 2020. A further objective was to explore public attitudes to ETR.
As with the PETRE project, the environmental and economic effects of ETR were explored through scenarios, which were defined as follows:
• Three baselines (B1, B2, B3)—medium, low, high world-market fossil fuel prices, where the high price, B3, resulted in the same end-user prices of energy as the two ETR scenarios, S1, S2.
• Two ETR scenarios (S1, S2)—increase in transport, household, and industrial energy taxes, and taxes on water and materials, reductions in income taxes (households) and social security contributions (business). The taxes in S2 were scaled to give the same end-user energy prices as in S1 (i.e., the taxes were higher because the underlying fossil fuel prices were lower).
• Two “eco-innovation” scenarios (E1, E2)—spending 10 percent of green tax revenues on energy-efficient buildings, renewable energy and hybrid vehicles, with the rest of the revenues being recycled as in S1, S2.
Figure 4.11 shows the results of the modeling, normalized to an index such that the results of the baseline B1 are 100 for both GHG emissions and GDP. It can be seen that the lower fossil fuel prices in B2 result, not surprisingly, in higher GHG emissions and higher GDP. The high world-market fossil fuel prices result in lower GHG emissions, but at a cost of about 6 percent of GDP.

Figure 4.11 Results for GDP and greenhouse gas emissions (GHG) for different environmental tax reform (ETR) scenarios (source: Ekins 2009b, p. 66).
The ETR scenarios (S1, S2), on the other hand, result in substantial reductions in GHG emissions, but very little change to GDP. The reason for the large difference in the results of B3 and S1 and S2, which have the same high end-user energy prices, is that with B3 the payments for the high prices go to energy exporting countries and companies, whereas in the ETR scenarios they are used to reduce other taxes. The “eco-innovation” scenarios produce useful further reductions in GHG emissions and slightly higher GDP because of the investment effect of the extra innovation spending.
Such results suggest that ETR is a very cost-effective way of reducing GHG emissions and stimulating new eco-industries which could contribute to future competitiveness. It would also result in a different trajectory for economic development. It would rule out a resource-intensive growth path, and this would constrain growth unless it led to innovation in low-resource and resource-saving technologies. ETR would stimulate such innovation, but the implementation of complementary policies would probably be desirable to enhance its effect.
With regard to macroeconomic modeling more broadly, Barker et al. 2006 carried out a meta-analysis of a large number of macroeconomic modeling exercises, using different kinds, but mainly computable general equilibrium (CGE) models, that have sought to estimate the GDP costs of decarbonization.
As shown in Figure 4.12, the majority of the runs estimated that an 80 percent reduction in carbon emissions would cost between 1 and 4 percent of GDP. This was one of the pieces of evidence that caused Stern (2007, p. 267) to come to the conclusion that
Overall, the expected annual cost of achieving emissions reductions, consistent with an emissions trajectory leading to stabilization at around 500–550 ppm CO2e, is likely to be around 1 percent GDP by 2050, with a range of +/-3%, reflecting uncertainties over the scale of mitigation required, the pace of technological innovation and the degree of policy flexibility.

Figure 4.12 Scatter plot of model cost projections (source: Barker et al. 2006, cited in Stern 2007, p. 270).
Returning to the discussion earlier in this paper about economic growth, the question arises as to whether ETR and complementary supporting policies to reduce the environmental impact of economic activity would lead to “sustainable growth” in Europe, and how that rate of growth would compare to those of environment-degrading growth. Clearly there are doubts as to how long environment-degrading growth can continue before it undermines the environmental conditions necessary for growth and slows down or comes to a halt (that, after all, is the meaning of the word “unsustainable”). Modeling by UNEP (UNEP 2011, Figure 13, p. 519) suggests that “green growth” would become faster than that in two “business-as-usual (BAU)” scenarios by about 2017, once the environmental damage associated with the BAU scenarios was taken into account.
These results suggest that “sustainable” growth will be resource-efficient. In the short term it may turn out to be slower economic growth than unsustainable (“brown”) growth, unless:
• there are widespread negative net cost resource efficiency opportunities (as shown in the McKinsey (2007) marginal abatement cost curve);
• enhanced ecosystem services contribute more to monetary output than alternative investment of the policy costs;
• disruption to ecosystem services that would have resulted in greater monetary costs than the policy implementation cost is prevented;
• currently higher-cost technologies to protect ecosystems become cheaper than the currently cheaper technologies that damage them;
• international demand develops for technologies stimulated by environmental policy, stimulating the growth of export markets. If the world as a whole moves toward “sustainable” growth, then the relatively high-growth countries in this world will be those that have developed, and can export, resource-efficient technologies and industries; or
• environmental policy stimulates innovation in the economy that would produce greater monetary output than would have been produced in its absence.
Green growth could produce higher employment than brown growth if:
• with unemployment, environmental policy gives skills and training to people who would otherwise have remained unproductive;
• with unemployment, environmental policy such as ETR makes labor cheaper; and
• the new environmental industries stimulated by environmental policy are more labor-intensive than the industries they replace.
ETR emerges from the analysis undertaken as a key policy for fostering sustainable growth. There is certainly no evidence at all that ETR or other policies for environmental sustainability would choke off economic growth altogether. Complementary policies to ETR should focus on influencing the direction of innovation (eco-innovation) and increasing its rate. Such policies could be any or all of publicly funded research and development, regulation (standards), information, public procurement (e.g., Japan’s Top Runner program), and voluntary agreements. Relatively high-growth countries in a sustainable future will be those that have developed, and can export, resource-efficient technologies and industries.
It also seems most unlikely, given the environmental pressures and damage for which there is very clear scientific evidence, that “unsustainable” growth will last beyond this century, and it could lead to environmental collapse well before 2100. Depending on the learning curves of new technologies and the economic impacts of climate change and other manifestations of environmental unsustainability, green growth may start to exceed brown growth as early as 2020. The Durban Summit may come to be regarded as the starting gun for a new “green race.” The choice facing economic and other policy makers is therefore clear, and from a cost–benefit angle environmental sustainability seems the correct social choice at any but the highest discount rates.
The politics of moving toward environmental sustainability
A final question then arises as to why, if the economic costs of moving toward environmental sustainability are relatively low, governments everywhere are finding carbon reduction and other systemic measures of environmental improvement (for example, relating to the conservation of biodiversity) so difficult. The answer to this question has more to do with politics than economics.
It may be true that the technologies for large-scale climate change mitigation are, or soon will be, available at affordable cost, but, to realize their potential in the near term, government funding of RD&D will need to increase dramatically, and governments will also need to put in place clear incentives for the private sector, because deployment and diffusion of these technologies can only be driven at scale by markets. Such deployment will require huge investments in low-carbon technologies right along the innovation chain (research, development, demonstration, diffusion). Financing this investment will require a substantial shift from today’s consumption-oriented economy of Western countries to an investment economy that builds up low-carbon infrastructure and industries. This shift need not impact negatively on GDP (incomes) and employment but will require higher savings and lower consumption rates. This may not be politically popular in a consumer society.
A second reason for the political difficulty of reducing carbon emissions is that stimulating the required investment will require high (now) and rising carbon prices over the next half century, to choke off investment in high-carbon technologies and incentivize low-carbon investments. These high carbon prices will also have the effect of greatly changing lifestyles and consumption patterns. This too may not be politically popular, because many forms of high-carbon consumption (for example, related to travel) are deeply embedded in society.
The conclusions from this analysis can therefore be summarized thus.
The adequate mitigation of climate change will require a fundamental shift in the direction of innovation. This innovation will generate “green growth” which in the medium term will exceed rates of brown growth. The agreements at COP 17 at Durban may begin to focus countries’ attention on green growth in earnest.
It is not technology or cost that are the main constraining factors to policies for green growth, but politics—people’s attachment to consumption rather than savings/investment, and to high-carbon lifestyles. This political situation will need to be changed for green growth to become a reality. Conversely, it is only the possibility of and prospects for green growth that will persuade policy makers and the public to go for environmental sustainability at all and, in particular, for the adequate mitigation of climate change, which will alone avoid the potentially enormous, but still very uncertain, costs of adapting to climate events and conditions outside all known human experience.
Notes
1 See DECC 2011 for a comprehensive statement of this.
2 See www2.dmu.dk/cometr; for a full exposition of the results see Andersen and Ekins 2009.
3 Its final report is at www.petre.org.uk (Ekins 2009a), with the results reported in more detail in Ekins and Speck 2011.
4 For its final report see Ekins 2009b.
References
Andersen, M. S. and Ekins, P. (eds.) 2009 Carbon Taxation: Lessons from Europe, Oxford University Press, Oxford/New York.
Barker, T., Junankar, S., Pollitt, H., and Summerton, P. 2007 The Effects of Environmental Tax Reform on Competitiveness in the European Union, Final Report of the COMETR project, Cambridge Econometrics, Cambridge, pp. 43–75, www2.dmu.dk/cometr/COMETR_Final_Report.pdf.
Barker, T., Qureshi, M., and Köhler, J. 2006 “The costs of greenhouse gas mitigation with induced technological change: A meta-analysis of estimates in the literature,” mimeo, Cambridge Centre for Climate Change Mitigation Research (4CMR), University of Cambridge, Cambridge.
Daly, H. E. 1991 “Elements of environmental macroeconomic,” in R. Costanza (ed.) Ecological Economics: The Science and Management of Sustainability, Columbia University Press, New York.
DECC (Department of Energy and Climate Change) 2010 Electricity Market Reform: Consultation Document, Cm 7983, December, DECC, London, online, available at: www.decc.gov.uk/assets/decc/consultations/emr/1041-electricity-market-reform-condoc.pdf.
DECC (Department of Energy and Climate Change) 2011 The Carbon Plan: Delivering Our Low Carbon Future, December, DECC, London, online, available at: www.decc.gov.uk/en/content/cms/tackling/carbon_plan/carbon_plan.aspx.
Ekins, P. 2000 Economic Growth and Environmental Sustainability: The Prospects for Green Growth, Routledge, London/New York.
Ekins, P. 2009a Resource Productivity, Environmental Tax Reform and Sustainable Growth in Europe, Final Report, Anglo–German Foundation, London, October.
Ekins, P. 2009b The Case for Green Fiscal Reform, Final Report of the Green Fiscal Commission, October, Green Fiscal Commission, London, online, available at: www.greenfiscalcommission.org.uk/index.php/site/about/final_report/.
Ekins, P. and Speck, S. (eds.) 2011 Environmental Tax Reform: A Policy for Green Growth, Oxford University Press, Oxford.
Everett T., Ishwaran, M., Ansaloni, G. P., and Rubin, A. Economic Growth and the Environment, Defra Evidence and Analysis Series, Paper 2, DEFRA, London, online, available at: www.defra.gov.uk/publications/files/pb13390-economic-growth-100305.pdf.
Goodland, R. 1992 “The case that the world has reached limits,” in T. Goodland, H. E. Daly, and S. El Serafy (eds.) Population, Technology and Lifestyle: The Transition to Sustainability, Island Press, Washington, DC, pp. 3–22.
HMT (HM Treasury) 2010 Carbon Price Floor: Support and Certainty for Low-Carbon Investment, December, HM Treasury, London, online, available at: www.hm-treasury.gov.uk/d/consult_carbon_price_support_condoc.pdf.
HMT (HM Treasury) 2011 Budget 2011, HC 836, March, HM Treasury, London, online, available at: http://cdn.hm-treasury.gov.uk/2011budget_complete.pdf.
IPCC (Intergovernmental Panel on Climate Change) 2007 Climate Change 2007: The Physical Science Basis, Contribution of Working Group I to the Fourth Assessment Report of the Intergovernmental Panel on Climate Change, Cambridge University Press, Cambridge.
Jackson, T. 2009 Prosperity without Growth: Economics for a Finite Planet, Earthscan, London.
McKinsey 2007 “A cost curve for greenhouse gas reductions,” The McKinsey Quarterly, February, McKinsey, London.
MEA (Millennium Ecosystem Assessment) 2005 Ecosystems and Human Well-being: Synthesis, Island Press, Washington, DC.
Meinshausen, M. 2006 “What does a 2°C target mean for greenhouse gas concentrations? A brief analysis based on multi-gas emission pathways and several climate sensitivity uncertainty estimates,” in H.-J. Schellnhuber, W. Cramer, N. Nakicenovic, T. M. L. Wigley, and G. Yohe (eds.) Avoiding Dangerous Climate Change, Cambridge University Press, Cambridge/New York, pp. 265–279.
Meinshausen, M. 2007, Potsdam Institute for Climate Impact Research, Potsdam, personal communication.
Rockström, J., Steffen, W., Noone, K., Persson, Å., Chapin III, F. S., Lambin, E. F., Lenton, T. M., Scheffer, M., Folke, C., Schellnhuber, H. J., Nykvist, B., de Wit, C. A., Hughes, S., van der Leeuw, S., Rodhe, H., Sörlin, S., Snyder, P. K., Costanza, R., Svedin, U., Falkenmark, M., Karlberg, L., Corell, R. W., Fabry, V. J., Hansen, J., Walker, B., Liverman, D., Richardson, K., Crutzen, P., and Foley, J. A. 2009 “A safe operating space for humanity,” Nature Vol. 461 (24 September), pp. 472–475.
Socolow, R. 2005 “Stabilisation wedges,” Met Office Symposium, February 3, Met Office, Exeter, online, available at: http://cmi.princeton.edu/wedges/slides.php.
Stern, N. 2007 The Economics of Climate Change: The Stern Review, Cambridge University Press, Cambridge.
Strachan, N. and Kannan, R. 2008 “Hybrid modelling of long-term carbon reduction scenarios for the UK,” Energy Economics, Vol. 30 No. 6, pp. 2947–2963.
UNEP (United Nations Environment Programme) 2011 Green Economy Report, UNEP, Nairobi, online, available at: www.unep.org/greeneconomy/GreenEconomyReport/tabid/29846/Default.aspx.
WBGU (German Advisory Council on Global Change) 2007 Climate Change as a Security Risk, Flagship Report, Earthscan, London, online, available at: www.wbgu.de/en/flagship-reports/fr-2007-security.