
5.2.8.3 Example of TAL simulation: high-power Bismuth TAL
In this section, we describe the simulation of a particular TAL design that uses Bismuth as the propellant. The Bismuth thruster was originally developed in the 1960s in the former USSR. It was demonstrated that specific impulse in the range of 2000–5000 s at power levels of 10–34 kW can be achieved. This thruster has a two-stage configuration in order to separate the ion production and acceleration zones. In this analysis, we will consider only the second stage. In particular, plasma density is used as a parameter. The simulations correspond to the following case: mass flow rate is 20 mg/s, magnetic field is uniform and equals 0.2 T. In this case, the calculated discharge current is about 6 A. The particular design is considered that has following geometry: R1=6 cm, R2=10 cm, and L=5 mm. The 2D hydrodynamic model described in the previous section is used to calculate plasma flow in the second stage channel.
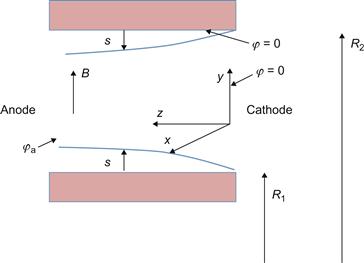
The computational domain is shown schematically in Figure 5.34. The electron temperature distribution along the channel is shown in Figure 5.35 in the case of φa=3 kV. One can see that the electron temperature peaks at about 120 eV near the channel exit plane and then decreases toward the anode. In order to validate the model, some integral characteristics of the thruster are calculated and compared with experiment.
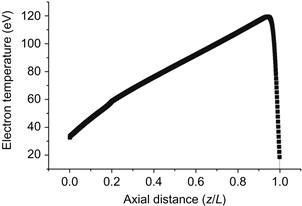
Figure 5.35 Electron temperature along the channel. Source: Reprinted with permission from Ref. [79]. Copyright (2004) by American Institute of Physics.
The steady-state thrust can be calculated at the thruster exit plane as follows: ![]() The calculated thrust increases linearly with the current (ion beam current) in agreement with experiment as shown in Figure 5.36. It can be seen that the model predicts thrust levels close to those measured experimentally over the entire range of the beam current (or equivalently mass flow rate).
The calculated thrust increases linearly with the current (ion beam current) in agreement with experiment as shown in Figure 5.36. It can be seen that the model predicts thrust levels close to those measured experimentally over the entire range of the beam current (or equivalently mass flow rate).

Figure 5.36 Thrust as a function of a beam current. Source: Reprinted with permission from Ref. [79]. Copyright (2004) by American Institute of Physics.
5.2.8.4 Example of calculation: TAL—analysis of the space-charge sheath near the channel wall
In the channel of the second stage, the guard ring has the cathode potential as shown schematically in Figure 5.34. When high voltage across the acceleration channel is considered, one should take into account the importance of the sheath development near the screening walls (guard ring) of the channel. When a negative voltage is applied to a surface immersed in a plasma, electrons are repelled from the surface, leading to sheath formation. Electrons drift away from the surface due to the presence of the high electric field. In the steady state, the ions are then accelerated toward the surface by the electric field of the sheath. In the 1D steady-state case, the sheath thickness can be estimated according to the Child–Langmuir law [156,157]:
![]() (5.103)
(5.103)
where Vs is the ion velocity at the sheath edge, U is the voltage across the sheath, Ls is the sheath thickness, ε is the permittivity of vacuum, Ns is the plasma density at the sheath edge, and mi is the ion mass. In a TAL, the channel wall has a potential equal to the cathode potential and therefore the voltage across the sheath, U, is equal to the plasma potential and varies along the channel. Similarly, the steady-state sheath thickness in a partially magnetized plasma was calculated in a plasma immersion ion implantation system [158]. One can see that the steady-state sheath thickness is determined by the plasma density and ion velocity at the sheath edge for a given bias voltage (Equation 5.103).
Based on the 2D hydrodynamic model, the plasma parameters at the plasma–sheath interface (Ns and Vs) as well as ion flux to the wall are calculated. It should be noted that the model used for sheath thickness calculation is one-way coupled, since the 2D plasma flow model does not account for the sheath thickness, while account for the voltage drop in the plasma and the sheath. The sheath thickness is several centimeters in typical high-power TAL conditions and occupies a significant portion of the channel as shown in Figure 5.37. The sheath thickness varies significantly along the channel wall due to variation of the potential drop between the plasma and the wall, which has cathode potential. Note that in typical high-power TAL design, the channel width is about several centimeters. It can be seen that when the discharge voltage is about 10 kV, almost the entire channel becomes nonquasi-neutral (sheath) and the quasi-neutral plasma is confined in the middle of the channel. Therefore, one can conclude that the discharge voltage limits the regime of quasi-neutral acceleration in a TAL with given geometry. Considering the interaction of the highly energetic (due to acceleration in the sheath toward the wall) ion flux with wall materials, one can expect significant erosion.

Figure 5.37 Sheath thickness along the channel with the voltage drop as a parameter. Source: Reprinted with permission from Ref. [79]. Copyright (2004) by American Institute of Physics.
It was shown above that the effect of the sheath expansion near the acceleration channel wall is very significant in the case of a high-power TAL. It affects mainly the cross-sectional area of the quasi-neutral plasma as shown in Figure 5.39. In turn, the change of the cross-sectional area of the quasi-neutral plasma affects the current density in the axial direction. It is natural to study this effect using a 1D approach since the axial current density (Eq. 5.102) is calculated in a 1D manner along the channel centerline. To this end, we developed a simplified quasi-1D model of the discharge in crossed E×B fields. The original model of this discharge was developed by Zarinov and Popov [59]. Recently, a modified version of that model that took into account plasma–wall interactions by introducing a more detailed electron energy equation was developed by Choueiri [63]. We present here a model [79] in which we adopt the formulation of Refs [59,63] except that sheath expansion near the channel wall in the acceleration region is taken into account as it occurs in a high-power TAL. In order to compare with previously published results [59,63], we adopt here a rectangular coordinate system shown in Figure 5.38. The z-axis is along the channel axis and the y-axis is along the thruster radius, i.e., along the magnetic field. The x-axis corresponds to the azimuthal direction in the Hall thruster. In this case, the current density in the quasi-neutral region will vary along the channel (z-axis). The characteristic time of sheath formation near the channel wall is about the plasma frequency and therefore a steady-state sheath will be considered. In the case considered, the cross-sectional area A(z) of the quasi-neutral plasma is varied along the channel. We start with the following set of equations for the quasi-neutral plasma:
![]() (5.104)
(5.104)
![]() (5.105)
(5.105)
![]() (5.106)
(5.106)
![]() (5.107)
(5.107)
where μ⊥ is the classical cross-field mobility, ji(z) is the ion current dependent on the cross section, jz is the electron current, νiz is the ionization frequency, νe is the electron collision frequency, and ωe is the electron cyclotron frequency. The change of the cross-sectional area of the quasi-neutral plasma due to sheath expansion can be calculated as follows:
![]() (5.108)
(5.108)
where R1 and R2 are the inner and outer radii of the channel and s is the sheath thickness (dependent on z) that can be calculated from Eq. (5.103). Since the wall has cathode potential (set to 0 for simplicity), the potential drop between the plasma and the wall is simply equal to the plasma potential φ. The channel cross section at the exit plane ![]() corresponds to the case of zero sheath thickness, since the wall potential is equal to the exit plane potential and therefore cathode potential.
corresponds to the case of zero sheath thickness, since the wall potential is equal to the exit plane potential and therefore cathode potential.
In addition, following Ref. [59,63,81], a simplified energy equation can be used: Te=βφ. It should be noted that similar linear behavior of electron temperature with discharge voltage near the channel exit plane was measured very recently [159]. On the other hand, the electron temperature profile in the entire channel is much more complicated and is a result of the balance between electron Joule heating and cooling due to interaction with the channel walls and ionization. For example, a typical profile is shown in Figure 5.35. Therefore, linear behavior of the electron temperature with plasma potential is generally only valid near the channel exit. In this particular 1D model, we are interested primarily in the effect associated with near-wall sheath expansion. Therefore, in order to simplify the problem, we will consider electron temperature as a parameter, which is constant along the channel.
Let us normalize the system of equations (5.104)–(5.107): ϕ=φ/φa, ξ=z/l*, ![]()
![]() θ=Te/φa. The characteristic quantities can be defined as follows:
θ=Te/φa. The characteristic quantities can be defined as follows:
![]()
The derivative of the channel cross section A(z) can be calculated as follows:
![]() (5.109)
(5.109)
Finally, the following normalized system of equations is obtained:
![]() (5.110)
(5.110)
![]() (5.111)
(5.111)
![]() (5.112)
(5.112)
This system of equations is similar to the original formulation of Zharinov and Popov [59] with one exception that change of the cross-sectional area of the quasi-neutral channel A(z) is taken into account.
Below, the following particular case of a high-power TAL is considered: mass flow rate of 10 mg/s, Bismuth as the propellant (i.e., R1=6 cm and R2=10 cm). As was mentioned above, in the calculation presented here, we assume a constant electron temperature close to the peak electron temperature (Te=100 eV, see Figure 5.35).
The effect of the near-wall sheath expansion on the anode layer potential profile is shown in Figure 5.39. One can see that the sheath expansion strongly affects the potential profile and the anode layer thickness decreases from 0.7 down to 0.15 when the sheath expansion effect is taken into account. This happens because the quasi-neutral plasma region is confined in the middle of the channel and as a result the current density increases. In turn, this leads to a higher axial electric field and therefore a smaller anode layer thickness.

Figure 5.39 Plasma potential profile in the quasi-neutral region with and without sheath expansion. Discharge voltage is 10 kV. Source: Reprinted with permission from Ref. [79]. Copyright (2004) by American Institute of Physics.
The anode layer (acceleration channel) thickness dependence on the discharge voltage is shown in Figure 5.40. One can see that the anode layer thickness significantly decreases with the discharge voltage increasing due to the sheath expansion effect. It is interesting to note that shrinking of the anode layer thickness is important as it leads to a smaller area of contact of the plasma with the walls and therefore smaller total erosion of the channel walls.
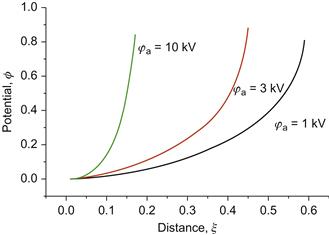
Figure 5.40 Potential profile in the quasi-neutral region with discharge voltage as a parameter. Source: Reprinted with permission from Ref. [79]. Copyright (2004) by American Institute of Physics.
It should be noted that the normalized length, l*, is proportional to ![]() which leads to a nonmonotonic behavior of the anode layer thickness with the discharge voltage in considered range of discharge voltages. This happens as a result of the near-wall sheath expansion effect. Without considering the near-wall sheath, the dimensional anode layer thickness will monotonically increase with the discharge voltage. Near-wall sheath expansion in the thruster channel leads to the current density increase (see above) and reverses the dependence of the dimensional anode layer thickness on the discharge voltage. The dimensional anode layer thickness will monotonically decrease with the discharge voltage in the large discharge voltage range (>10 kV).
which leads to a nonmonotonic behavior of the anode layer thickness with the discharge voltage in considered range of discharge voltages. This happens as a result of the near-wall sheath expansion effect. Without considering the near-wall sheath, the dimensional anode layer thickness will monotonically increase with the discharge voltage. Near-wall sheath expansion in the thruster channel leads to the current density increase (see above) and reverses the dependence of the dimensional anode layer thickness on the discharge voltage. The dimensional anode layer thickness will monotonically decrease with the discharge voltage in the large discharge voltage range (>10 kV).
5.2.9 Present state of the art: multiscale analysis of Hall thrusters
Recently progress was achieved in two directions: 1D kinetic model of the plasma slab between two walls was developed and analysis of the thruster was performed using 2D hybrid code. The 1D model allows analysis of the electron velocity distribution function, flux, and energy losses to the dielectric walls as well as cross-field conductivity. The model is based on the kinetic approach in which electrons are treated as simulation particles, and the local plasma parameters such as the Larmor radius and Debye length are resolved directly [160,161]. The simulation domain consists of a single magnetic field line bound by the dielectric walls. Magnetic field curvature is accounted for and sheath drop is computed self-consistently. Collisions are treated using the Monte Carlo method, and momentum transfer, Coulomb force, ionization, recombination, and excitation processes are included. Electron transport is computed using two methods. First, bulk mobility is computed from the average axial velocity and the average normal component of the electric field. Then, radial variation in mobility is obtained using newly developed method based on guiding center shift. This method is used to characterize the significance of NWC. The input parameters for the kinetic model include the magnetic field profile, axial electric field, and heavy-particle density distribution. These parameters can be computed by the 2D model. In particular, a hybrid PIC code can be used to obtain global plasma parameters. In this code, ions and neutrals are modeled as particles, but 1D conservation equations are used for the electron density. Radial variation in potential is obtained from the thermalized model.
The primary objective of the multiscale approach is to develop a tool capable of self-consistently determining electron mobility and the thruster plasma properties of interest. To accomplish this goal, we divide the problem into the following three spatial scales as shown in Figure 5.41:
• Magnetic field line: On the spatial scale of a magnetic field line, dynamics are driven by the cyclotron motion of electrons. Electrons are magnetized, and individual field lines can be considered independent of each other. Heavy particle and properties normal to the field lines are assumed frozen. This approach allows us to rapidly simulate electrons and recover mobility self-consistently. Leveraging modern multicore architectures via multithreading allows us to study multiple field lines simultaneously.
• Thruster channel: On the spatial scale of the thruster, plasma is assumed to be quasi-neutral, and electron density can be obtained from kinetic ions. Electron temperature and plasma potential is obtained by solving the quasi-1D equations.
• Plasma plume: Outside the thruster exit, the magnetic field plays a negligible role. The plume is quasi-neutral except in low-density sheath regions around the spacecraft. Of interest here is the formation of charge-exchange (CEX) ions and their impact on spacecraft components. Electron density is obtained from Boltzmann relationship, and potential can be solved by direct inversion or by solving Poisson’s equation.
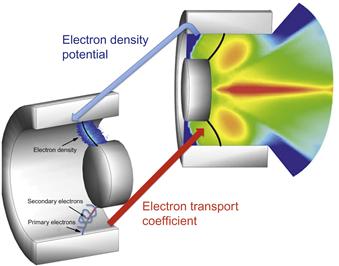
Figure 5.42 compares the mobility computed using multiscale approach to that used obtained by hybrid code. Although the background values of mobility are similar quantitatively, we can see stark differences between the two versions. The kinetic solution contains two distinct regions of high mobility, which are not seen in the analytical model. High production of secondary electrons was predicted by the code for the field lines at the left band. NWC may also explain the oscillatory nature of transport, which seems to be related to the high number of SEE seen on the magnetic field lines in this region. On the other hand, the high mobility in the right band may be due to a strong electric field. The right field line corresponds to the location where hybrid predicts drop in potential corresponding the start of the acceleration zone. We also see reduced mobility near the innerpole. This region is dominated by increased magnetic pressure which reduces flux of electrons to this region. It should be noted that the results shown here are statistically accurate.

5.3 Micropropulsion
Recent trends in space exploration associate with the paradigm shift toward the small and efficient satellites or micro- and nanosatellites. There are many near-future space missions involving science, military, and commercial payloads utilizing micro- and nanosatellite platforms that require very small thrust levels including very fine attitude control for high-resolution Earth imaging and astronomy, and very fine positioning requirements of spacecraft formation flying that is at the core of many interferometry missions. Nowadays, many basic components of spacecraft are being miniaturized so that micro- and nanosatellites are being designed and built. To satisfy the needs of both the low-thrust missions and the small-scale spacecraft, miniaturized propulsion systems are required.
While, micropropulsion devices producing micro-Newton level thrust or micro-Newton-second impulse bit are currently under development in many academic, government, and industrial laboratories, the field of micropropulsion is still in its infancy.
As it was described in Introduction to Chapter 5, traditionally plasma thrusters are divided into three categories based on the acceleration mechanism: electrothermal (arcjet, resistojet), elecrostatic (ion thruster, FEEP), and electromagnetic (PPT, Hall thruster, MPD thruster). The most important issue for microthrusters is the propellant management and therefore issues related to propellant feeding system become critical. In this section, we describe various propulsion concepts and we adopt natural division based on the propellant mechanism.
5.3.1 Microablative thrusters
Ablative thrusters are most simple devices in terms of functionality and in fact were the first propulsion concept flown in space. Ablative PPTs have achieved a high degree of maturity over several decades of research and development, test, and flight applications. The first flight of a PPT took place on Russian Zond 2 spacecraft in 1964. Subsequent flights took place in United States on the geosynchronous MIT Lincoln Lab LES-6 satellite in 1968 and 1974 and US Navy TIP/NOVA satellite in 1981. Finally, PPT experiment on Earth Observing 1 (EO-1, 2001) spacecraft has demonstrated the capability of new generation PPT to perform spacecraft attitude control. Ablative PPTs are relatively simple, compact devices featuring no moving parts. PPTs are able to provide minute impulse bits making them suitable for fine attitude control. Due to simplicity, PPTs are ready for miniaturization. The success of relatively recent EO-1 PPT enables the new generation of PPT technology to be considered for future missions with negligible risk.
5.3.1.1 Ablative PPT
PPTs are currently considered as an attractive propulsion option for mass and power limited satellites that require μN-s to mN-s impulse bits [162–167]. One of the most extensively analyzed propulsion functions has been attitude control. For missions that require precision pointing, the PPT offers a unique advantage over other technologies as it delivers a small impulse “bit” with high specific impulse (exhaust velocity). A second major functional area is stationkeeping, which includes drag compensation and formation flying. These functions require less than 1 mN of thrust. For instance, interferometer missions [168] such as ST-3 require submillimeter relative positioning precision. In particular, the US Air Force has a growing interest in highly maneuverable microsatellites to perform various missions, such as space-based surveillance, on-orbit servicing, inspection, and space control [162,163]. Recently, an electromagnetic PPT was successfully operated for pitch axis control on the EO-1 spacecraft [168,169]. It was shown that PPT can be easily scaled down in power and size. A μ-PPT is the miniature version of the traditional PPT has been designed at the AFRL for delivery of very small impulse bit [170,171]. AFRL μ-PPT was developed for a demonstration mission on TechSat21 [172] and it was recently employed at FalconSatIII. The μ-PPT can deliver a thrust in the 10 μN range to provide attitude control and stationkeeping for microsatellites.
In μ-PPT, the discharge across the propellant surface ablates a portion of the propellant, ionizes it, and then accelerates it predominantly electromagnetically to generate the thrust (schematically this thruster is shown in Figure 5.43) [25,173]. It is expected that the use of electromagnetic acceleration to create thrust will also lead to relatively high specific impulse.

Figure 5.43 (A) Schematic of the coaxial µ-PPT. (B) Teflon surface photograph and the ablation rate in the case of a micro-PPT.
It was demonstrated [174] that both discharge energy (peak current) and thruster size affect significantly the discharge uniformity (azimuthal or radial). Azimuthal nonuniformity relates to the current constriction and anode spot formation phenomena. This happens when the discharge current or thruster size exceeds some critical value. Discharge nonuniformity leads to a much higher ablation rate and causes degradation of the specific impulse. On the other hand, small discharge current leads to strong Teflon surface carbonization (charring) and radial nonuniformity, which in turn leads to thruster failure. The primary mechanism of the charring formation was identified and it is related to carbon backflux. Thruster size and discharge energy can be optimized by trading between two conflicting requirements of a large pulse energy (to prevent charring) and a small discharge energy (to prevent current constriction) [174]. Because the Teflon ablation rate grows nonlinearly with the surface temperature, the model predicts a lower rate of ablation in the areas where the surface temperature has a minimum. By taking this into account, the effect of the temperature distribution may be related to the preferential charring of the Teflon surface observed experimentally, as shown in Fig. 5.43 (b). It is interesting to note that comparison of the calculated temperature field and ablation rate with the photograph of the Teflon surface (Fig. 5.43 (b)) shows that the area with surface temperature and ablation rate minimum corresponds to the charred area in the case of the 3.6-mm-diam thruster. Because the charring phenomenon is completely intolerable and leads to thruster failure, the optimal discharge energy should be chosen somewhere near the spot formation limit.
5.3.1.2 Microlaser plasma thruster
Another example of the ablative type of micropropulsion system is the micro-laser plasma thruster (μ-LPT). Most notably, μ-LPTs have been developed by Phipps and Luke [175] and Gonzalez and Baker [176]. In Ref. [176], a Q-switched microchip laser, pumped by a CW diode laser, was used to ablate an aluminum target generating thrust in the range of 0.3 nN to 3 μN with power consumption of about 5 W and pulse frequency in the range of 1 Hz to 10 kHz. The wide dynamic range of thrust levels provided by these devices is one of their most attractive features.
The μ-LPT developed by Phipps and Luke [175] uses a 1–10 W, high-brightness diode laser irradiating various absorbing material and substrate combinations (e.g., black ink on paper, black PVC on Kapton™). Laser coupling coefficients on the order of 60 μN/W and specific impulses on the order of 500 s with a 1 W laser are achieved. One of the major advantages of the μ-LPT is its large dynamic range of impulse bit that can be varied between 0.4 nN-s to 16 μN-s by simply increasing the laser pulse duration. In addition, selection of absorber and substrate materials allows the specific impulse and the laser characteristics to be tailored for specific mission requirements.
The μ-LPT can be operated in two different modes. In reflection mode (R), the laser is incident on the target and the ablated material “reflects” from the surface. This mode has the potential problem of leading to deposition of plume effluent on the laser optics. In transmission mode (T), the laser passes through a transparent substrate film from the back. The substrate is coated on the other side with an absorbing material that is ablated. This approach circumvents the problem of optics contamination found with the R-mode. However, the dynamic range of impulse bit available in T-mode is more restrictive. Coating of laser optics by plume deposition is one of the major lifetime limitations of the μ-LPT in R-mode. Therefore, there is a certain preference for development of T-mode operation. Preliminary computational results for R-mode μ-LPT were presented [177]. A lens focuses the laser diode output on a 25 μm diameter spot on the transparent side of a fuel tape. The beam heats an absorbing coating to high temperature, producing a miniature ablation jet. The material that is ablated is usually PVC or Kapton. Typical parameters of operation are power of 2–14 W, pulse duration of 3–10 ms. The fuel tape thickness is about 185 µm, composed of 125 µm of transparent backing (usually cellulose acetate) and about 60 µm of absorbing coating. Typically Q* (energy of laser light required to ablate 1 kg of target material) is about 2×10⁷ J/kg and the momentum coupling coefficient is about Cw=60–100 μN/W. Recent computational work on T-mode μ-LPT was also developed and compared with experiment [178]. Generally LPT models satisfactorily describe the main features of the thruster such as ablated mass and plume expansion.
5.3.1.3 Microvacuum arc thruster
One possibility to improve some aspects of PPTs without compromising its efficiency is to use metal as a propellant. Success in development vacuum arc technology attracted much attention to this technology [179]. Metal propellant will have the following benefits: lower energy consumption per mass ionized (due to the low ionization potential of metals), high ionization degree, operation with higher repetition rates since the metal melting temperature is higher than that of polymer dielectrics used in some current thruster, and high pulse-to-pulse stability. For this reason, a vacuum arc source was developed and used for an ion thruster [180]. This work led to development of a coaxial vacuum arc plasma thruster [181]. Schematically this thruster is shown in Figure 5.44. However, the measured efficiency was reported to be only approximately 1.6% which is strongly different from the estimations, leaving ample room for improvement. On the other hand, several problems related to this technology were reported, including lifetime and ion current degradation with cathode recession [182]. Therefore, understanding of these problems and the efficiency limitations of the vacuum arc thruster (VAT) technology is an important issue. In addition, basic aspects of VAT such as thrust mechanism, effect of the magnetic field of the thruster operation and its plume, droplet generation were not studied in detail. It was shown that using an axial magnetic field (the so-called magnetically enhanced VAT) helps dramatically to improve thruster characteristics, such as specific impulse (plasma velocity) and to decrease plasma plume divergence [183,184].

In VAT, the thrust is created in the minute spot on the cathode surface called cathode spots (having size of ~10–100 μm) [185]. The high-pressure plasma in the cathode spot creates the reaction force (thrust) on the cathode as schematically shown in Figure 5.44. As earlier as in the 1930s, it was found experimentally that the plasma stream exerts a reaction force on the cathode, which is about 17±3 dyn/A (or ~0.2 mN/A) [186,187]. It is very important to note that since the reaction force is proportional to the arc current, the thrust can be controlled easily. Recent measurements confirmed those conclusions [188]. It should be pointed out that the force generated in the short vacuum arc exceeds that of the conventional cathodic arc [252].
In the late 1960s and early 1970s, several experimental groups investigated the use of vacuum arcs in electric thrusters for spacecraft propulsion (see review paper [189] and references therein). The main reason for considering vacuum arcs for electrical propulsion was the nature of the plasma plume expanding from the cathode, which exhibits high velocity and is highly directional. In general, a vacuum arc is established by using a coaxial geometry with a relatively small diameter cathode which is surrounded by an insulator and an anode. Vacuum arcs can be produced from any electrically conductive material. The suitability of various materials for vacuum arc propulsion was first studied by Dethlefsen [190]. In the case of a magnesium cathode, a plasma velocity of 50000 m/s was demonstrated, which is certainly very appealing to the propulsion community. Pulsed operation was demonstrated and the thrust efficiency was found to be dependent on the electrode material, the amplitude, and duration of the current pulse.
One reason for the material dependence is the fact that metals with low melting point and low thermal conductivity erode rather heavily, with a large part of erosion resulting in macrodroplets. These droplets tend to reduce the thrust efficiency because they are not accelerated to as high velocities as are the ions. While this reduces thrust efficiency, it has to be pointed out that the droplet emission does not depend on material properties alone and hence can be minimized through the action of thermal and mechanical inertia if a current pulse of sufficiently short duration on the order of 10 μs is used in a pulsed VAT. Apart from the high exit velocity and the fact that the cathode material can be chosen from a large variety of candidates, pulsed VATs were found to have other appealing characteristics, which include the fact that a solid fuel is used, the low-voltage operation, as the burning voltage of vacuum arcs does not exceed 100 V, and the simple control by adjusting arc current and repetition rate.
Interest in the vacuum arc source for propulsion applications was renewed [191] in 90s. The measured energy efficiency was about 80% which is comparable to that of xenon ion thruster. The development of the vacuum arc source for an ion thruster led to design of a thruster based on the pulsed vacuum arc without any ion extraction [192]. For later configuration, a specific impulse of about 1000 s was measured and 21% of efficiency was estimated. Further development of this technology is attributed primarily to Alameda Applied Science Corporation (AASC) [185].
The VAT is a simple, yet efficient electric propulsion device that combined with an inductive energy storage (IES) power processing unit (PPU) results in a low-mass (<300 g) system. The basic mechanism underlying the VAT is the production of micrometer-size fully ionized microplasmas (cathode spots) on the cathode surface, which expand into vacuum at high velocities, with the ions producing thrust. Every cathode spot carries a limited amount of current (~1–10 A) and exists for a few nanoseconds, which makes the VAT very scalable with respect to pulsed operation and/or amount of plasma produced.
The need for a low-mass propulsion system motivated the development of the VAT system. A PPT that uses conductive cathode materials as propellant is combined with an energy storage PPU that takes 5–24 V from the bus and converts it into an adequate power pulse for the thruster. It is a system well suited to provide small impulse bits (≈1 µNs) at high specific impulse, Isp of about 1000–3000 s. Applications include positioning and drag makeup for small, power, and mass limited satellites.
The performance of the VAT is determined by the propellant mass, the degree of ionization of the plasma, the angle of expansion, the average charge state, and the ion velocity. All these parameters have been measured repeatedly in the past and verified for numerous materials and operating conditions [166–169]. Typical values for the ion velocity vary between 10 and 30 km/s, the average arc/ion current ratio has been shown to be of the order 8%, and a cosine distribution has been found to emulate the plasma plume expansion very well.
In order to produce a low-mass system, the VAT was constructed using an IES circuit PPU and simple thruster head geometry. In the PPU, an inductor is charged through a semiconductor switch. When the switch is opened, a voltage peak L dI/dt is produced, which breaks down the thin metal film coated anode cathode insulator surface at relatively low-voltage levels (≈200 V). The current that was flowing in the solid-state switch (for ≤1 ms) is fully switched to the vacuum arc load. Typical currents of approximately 100 A (for ~100–500 µs) are conducted with voltages of approximately 25–30 V. Consequently, most of the magnetic energy stored in the inductor is deposited into the plasma pulse. The efficiency of the PPU may thus be greater than 90%. By varying the length of the trigger signal, the level of the current in the switch and thereby the energy stored in the inductor can also be adjusted. This in turn changes the amount of energy transferred to the arc and the impulse bit of the individual pulse. Obviously, the repetition rate of the individual pulse can be changed by varying the input signal as well.
The mass of the PPU is small (<300 g) resulting in a low-mass system. The plasma output is quasi-neutral; therefore, no additional neutralizer is needed. An electromagnetic interference (EMI) filter might be necessary due to the noisy characteristics of the discharge, high peak currents, and fast switching. A low-mass feed mechanism is available; therefore, even long missions can use this technology.
A picture of the VAT system with an equivalent circuit is shown in Figure 5.45. Additional information about the principle of the VAT can be found elsewhere [193–195].
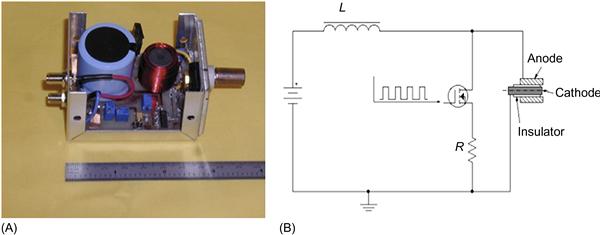
Figure 5.45 (A) VAT system including PPU (thruster head is on the right). (B) VAT equivalent circuit. Source: Reprinted with permission from Ref. [185]. Copyright (1996) by Institute of Physics.
While the system is simple and can be realized with an extremely low mass, the divergence of the plasma plume reduces the efficiency of the system due to the variations in the thrust vector and also increases the chances of contamination of essential parts of the spacecraft. Based on prior work by Gilmour and coworkers [196,197], who, by using a coaxial arc-diode configuration with an additional magnetic coil, achieved a total efficiency of 30% with a copper cathode and a magnetic field of 500 G and the fact that a magnetic field can be used to direct a vacuum arc plasma [194,198], an axial magnetic field was used to control the plasma flow. The magnetic field is produced by a coil wrapped around the anode of a coaxial thruster head. For the purpose of performing initial experiments, the currents in the coil and in the thruster are controlled independently, while a final design will utilize the magnetic field produced in the inductor of the IES PPU to control the plasma plume [199].
5.3.1.4 Microcathode arc thruster
Recently, a novel thruster design, the microcathode arc thruster (µ-CAT), was developed and investigated. This thruster improves on the vacuum arc discharge thruster by applying specially designed an external magnetic field. The unique magnetic field conditions achieved in a vacuum arc offer several potential advantages in these devices.
The µ-CAT is a simple electric propulsion device that combined with a magnetic coil and an IES PPU results in a low-mass (<100 g) system. A picture of the µ-CAT system and two types thruster are shown in Figure 5.46A–C. Figure 5.46B shows the schematic design of the ring electrodes µ-CAT (RE-µ-CAT), which consist of an annular titanium cathode and a same diameter annular copper anode with 1 mm width. The annular ceramic insulator tube having same inner and outer diameters and a width of about 1 mm was used as separator between the arc electrodes. Figure 5.46C shows the schematic design of the coaxial µ-CAT. Instead of the RE, this design employs cylindrically shaped cathode and anode.

Figure 5.46 (A) µ-CAT with PPU. (B) Schematic design of the ring shape µ-CAT. (C) Schematic design of coaxial electrodes µ-CAT.
Figure 5.47A shows a schematic of the thruster and the PPU system. The mass of the PPU is small (<100 g), resulting a low-mass system. PPU equipped with an IES system has been designed as shown in the Figure 5.46A and B. When the trigger pulse is applied to a semiconductor insulated gate bipolar transistor (IGBT) switch, the energy is accumulated in the inductor, while when trigger pulse ends, a surge voltage with the magnitude proportional to L dI/dt is generated on the inductor and applied to the electrodes. This leads to a breakdown and initiation of arc discharge between the electrodes. A coil has been applied to the outside of the thruster to produce magnetic field as indicated in Figure 5.47B and C. The direction of the magnetic field could be simply reversed by reversing the coil current.

Figure 5.47 (A) Schematic of microcathode arc thruster experimental arrangement. (B) CCD camera observation of plasma plume with no magnetic field (left figure) and with magnetic field (right figure, B=300 mT).
The µ-CAT operates by producing a fully ionized plasma at the inner surface of the electrode The plasma is formed in the cathode spots and expands into the vacuum zone under the applied magnetic field gradient. The plasma accelerates and expands into vacuum at a high velocity as the magnitude around tens thousands meter per second, which results in the impulse bit. The effect of the magnetic field on the thruster operation is clearly visible in Figure 5.47B. This figure shows a CCD camera observation of the RE µ-CAT firing in the vacuum chamber without and with an added magnetic field (B=0.3 T). The yellow lines in the second image of Figure 5.47B indicate the simulation results of the magnetic field distribution.
The plasma formed by a vacuum arc is created on the cathode surface spots. Using optical methods it was observed that the spots consist of either a homogeneous bright region or consist of cells and fragments with a typical total size of about 10–100 µm [200–202]. The observation of cathode spots motion under magnetic field was studied in 1960s [203,204]. It is known that presence of a transverse magnetic field at the cathode surface produces cathode spot motion in the −J×B direction. Theoretical explanation of this effect was given by Beilis [200]. The observed vacuum arc cathode spot rotation has important implications for propulsion since the cathode spot rotation leads to a uniform cathode erosion, which is critical for assuring long thruster lifetime. The µ-CAT cathode spot rotation was measured by the four-probe assembly Langmuir probes [205]. Four single probes were located along the azimuth direction inside the thruster channel and the four probes ion current measured results were shown in Figure 5.48. The rotation speed was calculated using a quarter of circumference of the thruster inner surface divided by the delay time between each of two neighbor peaks. The average rotation speed is shown in Figure 5.49. It was found that the spot rotation speed increased by factor of 5 (from 20 to 100 m/s) as the magnet field strength increased from 0 T to 300 mT.

Figure 5.48 Example of four Langmuir probes method to measure the cathode spot rotation speed. Source: Reprinted with permission from Ref. [205]. Copyright (1996) by Institute of Physics.

Magnetic field affects the total ion current (or jet current) collected in the thruster plume. The dependence of the ratio of jet current Ijet over arc current Iarc (f=Ijet/Iarc×100%) on the magnetic field is shown in Figure 5.50. It was found that due to losses to walls, the total ion current was very low (f=0.06%) in the case without the magnetic field. Increase of the magnetic field resulted in significant increase in the total ion current (up to 50 times) and saturated at about f~3–3.5%. Note that f cannot exceed the (fmax=Imax/Iarc×100%), where Imax is the total ion current generated by the cathodic spot. According to Kimblin [206], the fmax in the case of titanium is about 8%. Thus f~3–3.5% observed in the experiment corresponds to the efficiency of cathodic jet transport through the thruster channel of about 37.5–43.8%.

Figure 5.50 Ratio of Ijet (average over the pulse) over the total arc current as a function of a magnetic field.
Since total ion current increases with a magnetic field, one can expect increase in the impulse bit. Indeed recent measurements [207] indicated that the impulse bit increases with a magnetic field reaching about 1 µNs at 0.3 T as shown in Figure 5.51.

Figure 5.52 presents average ion velocity as a function of axial distance without and with magnetic field strengths of 0.17 and 0.3 T. It is seen that without magnetic field, the ions propagate at almost constant velocity as indicated in Figure 5.52 by the lower curve, while application of magnetic field leads to ion acceleration in the axial direction as demonstrated by two upper curves. The ion velocities saturate on the level of around 3–3.5×10⁴ m/s [208].

Figure 5.52 Ion velocity as a function of a magnetic field. Source: Reprinted with permission from Ref. [208]. Copyright (2012) by American Institute of Physics.
Plasma flow is subject to the electromagnetic force in the divergent magnetic field region:
![]()
where M is the ion mass, n is the plasma density, jθ is the azimuthal electron current, and Br is the radial component of the magnetic field. Azimuthal electron current density can be estimated as
![]()
where jr is the electron radial current density. In the plasma jet outside of the interelecrode gap, the total current is zero and therefore the electron current is equal to the ion current. Thus
![]()
where Vr is the radial component of the ion current. Radial component of the plasma velocity is developed in course of plasma expansion [147] and could be about 0.3 of the axial velocity component in a high magnetic field. Based on the above scenario, one can estimate the ion velocity change in the axial direction as

Using the following typical parameters of the plasma jet: B (i.e., both Br and Bz)~0.1 T, n~1020 m−3 Vr~104 m/s and Δz~0.01 m, one can estimate that ΔVz~104 m/s. This estimation is in good agreement with experimental measurements.
5.3.2 Microthrusters based on liquid propellants
Various micropropulsion concepts utilize liquid propellants since use of a liquid has some advantages over solid propellant especially in a miniature device.
5.3.2.1 Liquid PPT
In a microscale device with a high throughput, a solid propellant feeding mechanism may become impractical (unless propellant recession is organized in a proper manner, see previous section as an example). In that case, a liquid-based thruster can take advantage of fluid handling possibilities, such as capillary effect and adsorption. Several PPTs using liquid propellant were demonstrated over the last decade. Scharlemann and York [209] show that water is very effective propellant producing much higher specific impulse than Teflon. Microliquid PPT was demonstrated at Johns Hopkins University (Applied Physics Lab) [210]. JHU/APL thruster prototype weights about 13.5 g (without PPU) and also uses water as a propellant. This thruster accumulates water vapor in a small cavity as it diffuses through a membrane. An orifice at the opposite end of cavity leads to the main thruster chamber. Discharging a spark across two electrodes heats the vapor and injects it into the main chamber causing sustained discharge.
5.3.2.2 Field emission electric propulsion
Another type of thruster that may be relevant to nanopropulsion is field emission electric propulsion (FEEP). FEEP uses field emission ionization to extract and accelerate ions from the propellant. The propellant, which is typically a liquid metal, is stored in a reservoir. To initiate thruster operation, the propellant is first heated to its melting temperature in preparation for propellant extraction. A needle utilizes pressure gradients and propellant surface tension to extract the propellant from the reservoir and brings it in proximity of an extractor electrode. A large potential is applied between the needle and an extractor electrode. As the voltage increases, the propellant forms a cone (called a Taylor cone) that protrudes toward the extractor. The small radius of curvature at the protrusion tip increases the local electric field there, which causes further propellant displacement from the needle orifice. Once an electric field threshold of approximately 109 V/m is reached, atoms at the tip of the Taylor cone are ionized and accelerated through the gate electrode. Recently micro-FEEP thruster was demonstrated [211]. By utilizing electrostatic acceleration principles, FEEP has electrical efficiencies exceeding 90% [212,213]. However, the field emission process requires high voltages (10 kV range), leading to very high specific impulse up to 10,000 s and thus relatively high specific power values. In addition, the use of liquid metal propellant raises concerns regarding spacecraft contamination. While pure ion generation and acceleration are often sought, FEEP charge extraction instabilities can result in the formation of charged microscopic droplets. The amount of droplets formed is a strong function of emission current. A high droplet content decreases propellant utilization efficiency (called mass efficiency) and overall thruster specific impulse and electrical efficiency. In addition, a key limitation of FEEP has been the neutralization cathode. Typically, heated filament cathodes are employed for ion beam neutralization. In addition to their rather short lifetimes, filament cathodes consume an enormous amount of power.
5.3.2.3 Colloid thruster
Colloid thrusters are similar to FEEP featuring emitter tips and accelerating electrodes. However, unlike FEEP, colloid system does not accelerate individual ions but rather accelerate fine charged droplets. A key component of colloid thrusters is the phenomenon referred to as “electrospray.” Among the different spraying modes that can be attained, the so-called cone-jet produces a stable spray of monodisperse droplets. Droplets with diameters ranging from hundreds of microns to a few nanometers may be generated by tuning the physical properties of the electrosprayed solution. A strong electric field applied between the sharp-edged exit of the capillary and an external electrode causes charge separation inside the liquid propellant, which is doped with an additive to increase its electric conductivity. Various instabilities causes jet breakup into small liquid droplets, and by the action of the electric field on the conductive liquid charged droplets are extracted from the capillary at high voltages, producing thrust.
Colloid thrusters are able to deliver a very stable, fine thrust (of the order of 1 µN per cone-jet) with high specific impulse, Isp up to 1500 s. This type of electrostatic propulsion makes possible and enhances the use of microsatellites. Colloid thrusters also enable satellite flight formation and other missions requiring very precise positioning.
In principle, some combination of FEEP and colloid thruster is possible to provide flexibility in specific impulse and thrust. The idea of the hybrid approach is described in the next section.
5.3.2.4 FEEP operation in the colloid mode with low Isp range
To extend the range to lower Isp and higher thrust while preserving high efficiency, the FEEP thruster can be purposely operated in a droplet extraction mode.
Droplet emission is a phenomenon inherent to the operation of liquid metal ion source [214]. Several mechanisms of droplet emission were identified. One possible mechanism is related to the fact that at higher ion currents, the liquid jet becomes unstable, the so-called Rayleigh instability [215]. Another possibility is excitation of capillary waves at the sides of the Taylor cone [216]. Both effects form droplets with size of about 1–100 nm. Typically in liquid metal ion sources, droplets are generated when Rayleigh instability is set that requires electric field higher than some critical one (or current higher than critical) [217,218].
In the indium FEEP, it was shown that the mass efficiency, which is the ratio of the ion mass fraction to the total flux, decreases from 99.5% at 10 μA down to 10% at 200 μA in the case of indium. This means that when current greater than 200 μA, about 90% of the propellant mass is emitted in the droplet form.
In addition, Crowley [219] showed that the temperature rise at the emitter tip enhances droplet emission. According to Crowley, the temperature rise depends upon the electrical resistivity to thermal conductivity ratio. The smaller ρ/k ratio corresponds to smaller temperature rise and therefore smaller droplet fraction. Increasing the propellant temperature would lead to higher ρ/k and therefore enhance the droplet emission. Again, in the indium FEEP, it was shown that the droplet mass fraction increases up to 90% when indium temperature increases from melting point (156.6°C) up to about 280°C.
The approach may be to use a combination of fine-tuning emission current and temperature control to operate the micron-scale FEEP in charged droplet mode. In this case, specific impulse produced by the thruster can be adjusted dependent on mission requirement from being very high of about 10,000 s in the ion extraction mode down to 1000 s in the droplet emission mode.
5.3.2.5 Other concepts
Other electrostatic and electromagnetic schemes can be considered for micropropulsion, such as Hall thruster and ion thruster.
A microion engine is under development at Jet Propulsion Laboratory. This is a MEMS-hybrid device in which the bulk of the engine is fabricated using conventional machining, while several components are machined using MEMS technology. The engine has a discharge chamber of 3 cm. However, further miniaturization is not feasible because thruster becomes extremely inefficient or cannot maintain a plasma within given power limit [220]. Small-scale Hall thruster with power level of 50–200W was also demonstrated recently by MIT [221] and Princeton University PPPL [222]. In this respect, Princeton cylindrical Hall thruster has promise due to decreased surface-to-volume ratio.
5.4 Plasma plumes from thrusters
It is accepted that plasma propulsion can offer significant advantages for many space missions; however, integration of electric thrusters on spacecraft can present significant challenges. In this respect, assessing the plasma thruster plume interactions with the spacecraft serves as a major factor in determining thruster location. Schematically, plume interaction is shown in Figure 5.53. Plume of the plasma thruster typically consists of energetic ions, neutral gas, low-energy ions, and electrons. In order to fully assess plasma plume contamination, one needs to take into account the interaction between each of the plume components and other spacecraft systems.

For instance, Hall thruster is an attractive form of electric propulsion and it is one the most efficient plasma thruster nowadays. However, one of the shortcomings of Hall thrusters is the large exhaust-beam divergence, which may cause electrostatic charging and communication interference of satellites. Thus, the structure of the plasma plume exhaust from the thruster is of great interest. In this section, we will discuss issues related to plasma plume and its interaction with spacecraft.
5.4.1 Description of the plume model
In general, vast majority of the plume models are based on hybrid approach, which includes particle simulation of the ions and neutrals flow and fluid description of electrons flow. Particle simulation method such as PIC was employed. Charge exchange (CEX) collisions between ions and neutrals are typically taken into account. Fast ions from the main beam undergo CEX collisions with neutrals, resulting in slow-moving ions and fast-moving neutrals. Presence CEX ions will generate secondary plasma which is responsible for large plume divergence and backflow.
Schematically, this process is shown in Figure 5.53. The CEX ions have much lower velocities; therefore, they are more influenced by the self-consistent electric field in the plume. These fields may cause them to interact with spacecraft surfaces.
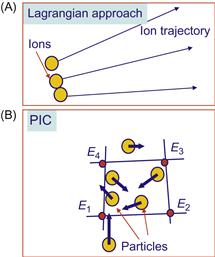
The charged particles may impact solar arrays or interfere with transmission from the satellite. A critical engineering issue in the employment of various devices is potentially hazardous interaction of the plume with spacecraft system. Thus, it is important to understand their dynamics in the plume. Energy distribution of the CEX is important for understanding possible effect on spacecraft such as sputtering of spacecraft components. In order to address this issue, a 2D simulation tool has been developed. The plume model that will be described below consists of two main components: a Lagrangian algorithm for determining the expansion of the main beam and a PIC solver for calculation of the dynamics of the secondary CEX plasma. This approach is similar to one described in Ref. [223].
A 2D, axisymmetric, and steady-state flow was assumed. We will use Hall thruster as an example of the plasma thruster for plume analysis. Inlet conditions for the plume will be generated from the plasma flow at the exit of Hall thruster. These conditions include the plasma density and velocity distribution in radial direction at the thruster exit. The main ion beam exhaust from the thruster is collisionsless, singly ionized, quasi-neutral expanding under the influence of the electric field. Electron flow will be analyzed assuming ambipolar, isothermal, collisionless, and unmagnetized [224]. The contribution of cathode mass in the total mass flow rate was assumed to be small and therefore will not be taken into account.
5.4.1.1 Ion beam generated from the thruster
Lagrangian approach will be employed here for ion simulations. It should be pointed out that the Lagrangian technique reduces the numerical noise associated with PIC method. Moreover, PIC technique is not accurate in the case of the problem with large-scale variation such as from millimeter to meter, which is the case of the thruster plume.
Ion momentum equation can be expressed as follows:
![]() (5.113)
(5.113)
where Vi is the ion velocity and E is the electric field. Mass elements or macroparticles are ejected from the thruster exit and are tracked using trajectory analysis. The location of each macroparticle is determined by the following system of equations:
 (5.114)
Each time the ion density is updated using calculated V(t) with the conservation of mass:
![]() (5.115)
(5.115)
Density is updated on each simulation time step as well as electric field. The iteration process ensures that ion trajectories are consistent with local electric field.
Typically the calculations of the ion density in the plume relay on the condition at the exit plane from the thruster.
5.4.1.2 Electron flow
Electron density distribution is given by a balance of electrostatic force and electron pressure while the magnetic field effects can be neglected. Recall that in the near-plume region of the electromagnetic thruster (such as Hall thruster), a magnetic field may affect the electron motion. However, it was found that this effect is small in a typical case since magnetic field decreases strongly outside of the Hall thruster channel [152]. Effect of the magnetic field on the plume in the near-plume field will be described in Section 5.4.4.1. Mathematically, the balance for electrons under considered conditions can be written as follows:
![]() (5.116)
(5.116)
where P is the electron pressure. Equation (5.116) comes from the general electron momentum conservation taking into account the currentless and unmagnetized electron flow. For densities and temperatures of the plasmas, which are typical for the plumes of Hall thrusters, the electron–ion collision term is negligible. The ratio of the collision frequency to the plasma frequency is much less than one. Further assuming isothermal conditions yields the Boltzmann relation:
![]() (5.117)
(5.117)
where nref is the reference electron density defined where potential is zero.
5.4.1.3 Neutral density
Typical scale of the plume of interest for spacecraft propulsion application is in the order of several meters which is about the size of the solar panels of a communication satellite. Neutral density decreases due to expansion into vacuum. As a result, in the most part of the plume, the flow is collisionless. The most common approach to describe the neutral density in the plasma plume is a Monte Carlo simulation such as Direct Simulation Monte Carlo (DSMC).
In some case, a simple analytical model for the neutral expansion can be employed as well [223]. The profile of neutrals in the thruster plume is computed using the emission by the solid angle Ω(r,z) [223]:
![]() (5.118)
(5.118)
where Γo is the mass flow rate of neutrals, Ua is the neutral velocity, and Ω is the solid angle [223].
The ion–neutral interactions include momentum and CEX collisions. The most important collision for plume contaminations is the CEX. The fast ions from the main beam undergo CEX collisions with neutral particles, resulting in slow-moving ions and fast-moving neutrals:
![]() (5.119)
(5.119)
CEX collision rate is calculated as follows:
![]() (5.120)
(5.120)
A value for σCEX of 5.5×10⁻¹⁹ m2 has been assumed following the previous comparison with experimental data. The data for collision cross section has been analyzed by Pullins et al. [225].
5.4.1.4 Potential distribution
The PIC algorithm solves the 2D Poisson equation and iterates until the steady-state solution is reached. The sum of the primary ion density ![]() and the CEX ion density is used in the Boltzmann relation:
and the CEX ion density is used in the Boltzmann relation:
![]() (5.121)
(5.121)
The primary ion density is calculated using the Lagrangian method.
The overall approach to calculate the primary ion density and CEX ion density is shown in Figure 5.54. Most simulations of the plasma plume employ about 100,000–500,000 particles in 300×300 PIC cells. These simulations required about 50–100 CPU time on single workstation.
5.4.2 Example of plasma plume simulation: Hall thruster plume
In this section, we present example of calculation of the plasma plume expanding from the Hall thruster called SPT-100 and compare these calculations with available experimental data for ion current density angular distribution at 50 cm. SPT-100 (i.e., 100 mm diameter thruster) is the Hall thruster developed by Fakel which has the longest flight history. The nominal operational conditions for this thruster are summarized in Table 5.1.
Table 5.1
Operational Conditions and Parameters of the Plasma in SPT-100
| Discharge current | 5 A |
| Discharge voltage | 300 V |
| Xenon mass flow rate | 4.5 mg/s |
| Plasma density | 2×10¹⁷ m−3 |
| Neutral xenon density | 3.3×10¹⁸ m−3 |
| Axial ion velocity | 1.9×10⁴ m/s |
| Electron temperature | 3 eV |
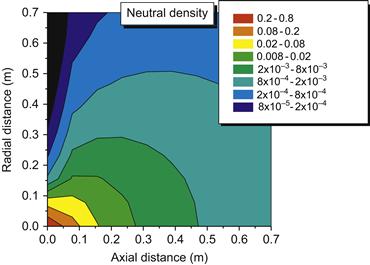
Calculated ion density distribution in the plume is shown in Figure 5.55 and neutral density distribution is shown in Figure 5.56. The domain that considered has the size of 0.7×0.7 m2.
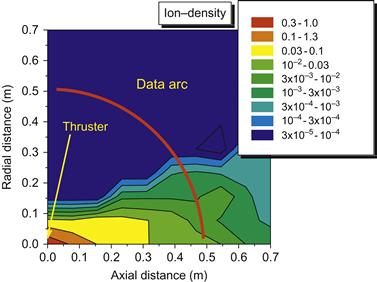
Figure 5.55 Normalized ion density distribution in the plume. The thruster exit plane and the data arc at 0.5 m are shown.
A comparison of the calculated and measured ion current density distributions are shown in Figure 5.57. The radius at which data were taken is shown in Figure 5.55. One can see that the primary ion beam analysis predicts the narrow plume of about 30°, while CEX ions are spread over large angles. Due to CEX process, slow ions are found at 80°. In general, the calculated results are in good agreement with experimental data especially for a primary ion beam. One can see that ion current density drops at about 40–50°. This is consistent with previous simulations of the Hall thruster plume [223]. It should be pointed out that more detailed neutral particle models such as DSMC can lead to better reproduction of the experimental data [226].
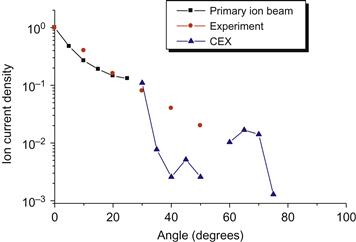
Figure 5.57 Normalized ion current density distribution in the plume. Source: Experimental data are taken from Ref. [227].
It can be seen from Figure 5.57 that ion current drops at about 40–50°. This drop is due to the fact that most CEX ions are generated near the exit plane in a relatively dense region. As a result of potential distribution, these ions are driven toward the satellite (backflow). Thus ion density has second peak at large angles. Recall that previous analysis show that assuming higher electron temperature (>10 eV) eliminate this effect.
5.4.3 Plasma plume ejected from microlaser plasma thruster
The μ-LPT developed by Phipps, Luke, and coworkers [228–230] with power from 1 to 10 W uses the high-brightness diode laser irradiating various absorbing material and substrate combinations (e.g., black ink on paper, black PVC on Kapton). Laser coupling coefficients on the order of 60 μN/W and specific impulses on the order of 500 s with a 1 W laser are achieved. One of the major advantages of the μ-LPT is its large dynamic range of impulse bit that can be varied from 0.4 to 16 μN-s by simply increasing the laser pulse duration. In addition, selection of absorber and substrate materials allows the specific impulse and the laser characteristics to be tailored for specific mission requirements.
As illustrated in Figure 5.58, the μ-LPT can be operated in two different modes. In reflection mode (R), the laser is incident on the target and the ablated material “reflects” from the surface. This mode has the potential problem of leading to deposition of plume effluent on the laser optics. In transmission mode (T), the laser passes through a transparent substrate film from the back. The substrate is coated on the other side with an absorbing material that ablates material away from the laser. T-mode circumvents the problem of optics contamination found with the R-mode. However, the dynamic range of impulse bit available in T-mode is more restrictive. On the other hand, coating of laser optics by plume deposition is one of the major lifetime limitations of the μ-LPT in R-mode. Such coating reduces the lifetime of the thruster. Thus T-mode operation has advantage from the practical point of view.
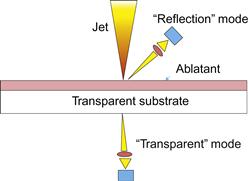
The principle of operation of this device is shown schematically in Figure 5.58. A lens focuses the laser diode output onto a 25 μm diameter spot on the transparent side of a fuel tape. The beam heats an absorbing coating to high temperature, producing a miniature ablation jet. The material that is ablated is usually PVC (carbon-doped PVC, ranging from 2–5% C). Typical parameters of operation are power of 2–14 W, pulse duration of 3–10 ms. Typically Q* (energy of laser light required to ablate 1 kg of target material) is about 2×10⁷ J/kg and the momentum coupling coefficient is about Cw=60–100 μN/W. These parameters will be used for evaluation of the boundary conditions for the plume simulations.
5.4.3.1 Laser generated plasma expansion
The laser generated plasma plume has been described by Itina et al. [231] and by Franklin and Thareja [232]. In each case, Monte Carlo methods were employed. The focus of these studies was on use of laser ablation for thin film deposition.
In the example that will be described in the next section, a hybrid fluid-particle approach is employed for the plasma plume simulations. The heavy-particle products of the laser ablation of PVC (neutral atoms of C and H, and ions C+ and H+) are modeled as particles. Particle collisions are computed using the DSMC method [233]. Both momentum-exchange and CEX collisions are taken into account. Momentum-exchange cross sections follow the model of Dalgarno et al. [234] and the collision dynamics follows the normal DSMC procedures. The implementation of this algorithm for the unsteady plasma plume is described in Ref. [235]. The CEX processes employ the cross sections proposed by Sakabe and Izawa [236].
Acceleration of the charged particles in self-consistent electric fields is simulated using the PIC method [237]. The plasma potential, φ, is obtained from the Boltzmann relation assuming that the plasma is quasi-neutral. Recall that the ion density is known from the PIC simulations.
By further assuming the electrons are adiabatic, the electron number density, ne, is then used in the Boltzmann relation to obtain the plasma potential:
![]() (5.122)
(5.122)
where φ*,T*, and n* are reference values and γ=5/3. In the case of the μ-LPT, the reference point for the Boltzmann relation is taken as the target surface. It is assumed that the potential here is constant.
The 2D axisymmetric simulation uses a single grid for both the collision and ion motion calculations. Since charge neutrality is assumed, the PIC cells are not required to be of the order of the Debye length. Instead they are chosen to be small enough to resolve in a reasonable way the gradients in the potential. At the same time, the cells satisfy the DSMC requirement that their size be less than a mean free path. The background pressure of the order of 10−5–10−2 Torr, typical for Laboratory conditions, is simulated. The background pressure gas is assumed to be fully composed of hydrogen atoms at a temperature of 300 K.
5.4.3.2 Example of calculation of expanding plume from microlaser plasma thruster
For simplicity, we consider here a two-component plasma consisting of carbon and hydrogen. The chlorine component of PVC is omitted due to its relatively low abundance. Two examples of a 2.5–8 W diode laser beam focused on a 25 μm radius spot were considered. The pulse duration is 3–10 ms, and the experimentally measured thrust-to-power (coupling coefficient) of about 70–200 μN/W is used in order to estimate the recoil pressure.
The particles injected into the DSMC–PIC simulations are sampled from the equilibrium velocity distribution [178]. The grid employed in the plume computation contains 300 by 300 nonuniform rectangular cells. The flow domain extends to about 3 cm in both the axial and radial directions from the center of the ablation spot. A constant time step of 2×10⁻¹⁰ s is employed that is smaller than the smallest collision and plasma timescales (the inverses of the maximum collision and plasma frequencies, respectively). A steady state is reached after 40,000 iterations and final results are obtained by averaging over a further 50,000 steps. A maximum of more than 1 million particles is employed in the simulation.
Contours of plasma densities are shown in Figure 5.59. One can see that background gas pressure strongly affects the plume expansion due to CEX and momentum transfer elastic collisions.

Figure 5.59 Plasma density (in m−3) distribution in the plume exhaust of the μ-PPT. Source: Reprinted with permission from Ref. [178]. Copyright (2004) by American Institute of Physics.
The distribution of plume deposition on a witness plate was obtained experimentally. The schematic of the experiment is shown in Figure 5.60. The axes in this figure are labeled in degrees, with 0° corresponding to the direction normal to the tape surface.
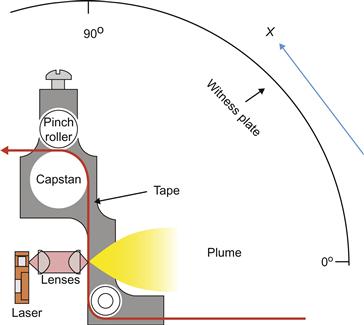
Figure 5.60 Schematics of witness plate experiment. Source: Reprinted with permission from Ref. [178]. Copyright (2004) by American Institute of Physics.
The distance from the laser focus to the cylinder on which the witness plate is rolled is 6 cm. The cylinder is made of metal and mounted to the vacuum chamber so that it is always in the same location. The X-axis in the images is the distance around the circumference of the cylinder. The Y-axis is the distance along the length, and the degree marks are not equally spaced. The deposit is attached to the metal cylinder as shown in Figure 5.60.
The normalized flux profiles are shown in Figures 5.61 and 5.62 for all cases (low and high power and low and high pressure, and vacuum). It is assumed that the black deposition material on the witness plate is carbon (this assumption was verified by chemical element analysis of the plume signatures using SEM) and so the simulation results in Figures 5.61 and 5.62 contain the total fluxes of carbon ions and atoms. One can see differences in the two deposition signatures due to the background pressure effect. High background pressure leads to narrow plume, while low-pressure case corresponds to large plume expansion. In turn, the strongest effect of the background pressure can be seen in the higher pressure case, while in the low-pressure case calculations in the vacuum case produces similar result as the one for low pressure. One can see that the simulations generally predict a narrowing (focusing) of the plume. These results are comparable to previous experimental and theoretical study in the similar background pressure range [238,239]. In this relatively low-pressure regime (<10−2 Torr), the effect of ablated atom collisions with background gas (hydrogen in our case) leads to redistribution of the ablated atom velocity toward the axial direction. These predictions are confirmed by present experiments as shown in Figures 5.61 and 5.62 showing the plume narrowing.
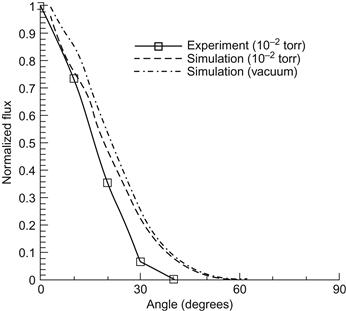
Figure 5.61 Normalized flux distribution. High-pressure (10−2 Torr) case, distribution along the x-direction. Source: Reprinted with permission from Ref. [178]. Copyright (2004) by American Institute of Physics.

Figure 5.62 Normalized flux distribution. Low-pressure case (10−5 Torr), distribution along the x-direction. Source: Reprinted with permission from Ref. [178]. Copyright (2004) by American Institute of Physics.
The above example of the code validation illustrate that the hybrid PIC–DSMC approach is the appropriate tool for plasma plume simulations.
5.4.4 Magnetic field effects on the plasma plume
In this section, we describe effects related to magnetic field that is present in the near-field plume region of plasma thrusters. For instance, in a Hall thruster, the magnetic field leaks outside the acceleration region.
In the case of electromagnetic PPT, self-magnetic field is formed and it is essential for plasma acceleration. Thus it is important to describe some peculiarities induced by the magnetic field in the near-field region of plasma thrusters.
The effect of the magnetic field on the near-field plume for Hall thrusters was modeled elsewhere [152] under steady-state conditions. It was found that the magnitude of the magnetic field near the thruster exit has an important effect on the plasma potential distribution in the plume. In the PPT, on the other hand, the self-magnetic field drives the plasma acceleration and thus one needs to include the electromagnetic effects on the near-field plume of unsteady plasma flow.
5.4.4.1 Effect of the magnetic field on the plasma plume
In this section, we describe effect of the magnetic field on the plasma potential distribution in the plume of the Hall thruster. A quasi-1D model of the three-fluid (ions, electron, and neutrals) plasma flow is considered. The model is described elsewhere [152]. The effect of the magnetic field appears in the equation for potential that can be obtained by solving the electron momentum equation for the potential:
![]() (5.123)
(5.123)
where B is the magnetic field, V is the flow velocity, and βe is the Hall parameter. The solution procedure and the approach is described in Ref. [152]. In this section, the main results of this model will be highlighted.
The axial potential distribution is shown in Figure 5.63 with the electron temperature as a parameter. One can see that the potential sharply increases initially and then saturates. For comparison, the experimental data [240] on the lines of 0° and 45° off the thruster centerline are plotted. It can be seen that, in general, the predicted results are in agreement with experiment. For instance, in the experiment, plasma potential saturation with axial distance was observed in the case of 0° as is predicted by the model.

Figure 5.63 Potential distribution along centerline. Distance is measured from the Hall thruster exit plane. Source: Reprinted with permission from Ref. [152]. Copyright (1999) by American Institute of Physics.
The plasma potential distribution with magnetic field as a parameter is shown in Figure 5.64. In the case of a zero magnetic field, the plasma potential is negative and decreases with axial distance according to the Boltzmann relation. The plasma potential becomes positive when the magnetic field is finite. One can see that, in general, the plasma potential increases with increasing magnetic field.

Figure 5.64 Potential distribution along centerline with a magnetic field as a parameter. Distance is measured from the Hall thruster exit plane. Source: Reprinted with permission from Ref. [152]. Copyright (1999) by American Institute of Physics.
The potential increase across the magnetic field can be understood in the following manner. The cases considered correspond to a plasma jet entering a transverse magnetic field with a high supersonic directed velocity in the condition that the magnetic field is relatively weak. This means that only electrons are magnetized, while ions are not magnetized on the spatial scale of interest. Since plasma flow across magnetic field is ambipolar, an electric field is formed that leads to the potential increase across the magnetic field.
5.4.4.2 Near-field plasma plume of PPT
The model is based on a hybrid approach involving a DSMC description of neutrals, a PIC approach for ions, and a fluid description of the electrons. In these methods, the potential distribution is usually calculated by reducing the electron momentum equation to the Boltzmann relation in the absence of a magnetic field. When the magnetic field was presented in the plasma plume domain, the electron momentum equation including the magnetic field effect should be used instead of Boltzmann relation.
5.4.4.3 Boundary conditions for the plume simulation
During the discharge, the plasma density near the propellant face is large (on the order of 1023–1024 m−3 [25,241]) and therefore a fluid approach can be used. The plasma layer model includes the following features (similar to the model of an electrothermal PPT [25,241]): Joule heating of the plasma, heat transfer to the Teflon surface, and Teflon ablation. Mechanisms of energy transfer from the plasma column to the Teflon wall include heat transfer by particle convection and by radiation. The Teflon ablation computation is based on a kinetic ablation model described in Chapter 1.
5.4.4.4 Plasma plume electrodynamics
As it was mentioned above, the hybrid fluid-particle approach was used for the plasma plume description in which the neutrals and ions are modeled as particles, while electrons are treated as a fluid. Elastic (momentum transfer) and nonelastic (CEX) collisions were taking into account. The particle trajectory due to collisions is calculated using the DSMC method [233]. Momentum-exchange elastic cross sections use the model of Dalgarno et al. [242], while CEX cross sections was calculated according to Sakabe and Izawa [236]. Acceleration of the charged particles is computed using the PIC method [237]. A single grid employing nonuniform, rectangular cells is used for both the DSMC and PIC steps. Since the flow is assumed to be quasi-neutral, there is no requirement to resolve the Debye length. Hence, the cells are scaled by the local mean free path. A single time step given by the reciprocal of the maximum plasma frequency is used throughout.
In the presence of a strong magnetic field, the electron density distribution deviates from that of the Boltzmann distribution [84]. In the case of a magnetic field, the electron momentum equation reads (neglecting electron inertia):
![]() (5.124)
(5.124)
We have assumed quasi-neutrality therefore Ne=Ni=N. Using a definition j=eN((Ve−Vi), Eq. (5.125) is usually referred to as the generalized Ohm’s law. The electric and magnetic field distributions in the plume were calculated from the set of Maxwell’s equations (see Chapter 2). We further assume that the magnetic field has only an azimuthal component and also neglect the displacement current. The combination of Maxwell’s equations and electron momentum conservation (5.125) gives the following equation for the magnetic field:
![]() (5.125)
(5.125)
where σ=e2Ne/(νeime) is the plasma conductivity which has only a weak dependence on the plasma density (in the Coulomb logarithm). Using this fact, it was assumed that plasma conductivity depends only on the electron temperature in the plasma plume. A similar approach regarding the assumption about conductivity was also employed in the plasma flow simulation in the PPT [243]. The electron temperature in the plume was assumed to be constant. The plasma conductivity is also constant (mainly due to the fact that electron temperature is assumed to be constant in the near plume [226]) and that the density gradient does not affect the magnetic field diffusion. The last assumption comes from the fact that the main density gradient is developed in the direction of magnetic field transport (as clear from the results below) and therefore does not affect magnetic field transport [32].
A scaling analysis shows that in the case of the near plume of the μ-PPT with a characteristic scale length L of about 1 mm, the magnetic Reynolds number Rem=μσLV![]() 1 (where V is the characteristic velocity ~104 m/s as shown below) and therefore the last term in Eq. (5.126) can be neglected. In addition, depending on the plasma density, the Hall effect (second term on the right-hand side of Eq. (5.125)) may be important for the magnetic field evolution. One of the first calculations of the plasma flow with Hall effect was performed by Brushlinski and Morozov (see Ref. [244] and references therein), who considered isothermal flow. The plasma densities become high at the cathode and lower at the anode. The Hall effect has a particularly noticeable influence on the magnetic field distribution. The field near the anode increases and near the cathode decreases. As a result, the current is deflected to the side and grazes the anode. Our estimations of the Hall parameter show that ωτ
1 (where V is the characteristic velocity ~104 m/s as shown below) and therefore the last term in Eq. (5.126) can be neglected. In addition, depending on the plasma density, the Hall effect (second term on the right-hand side of Eq. (5.125)) may be important for the magnetic field evolution. One of the first calculations of the plasma flow with Hall effect was performed by Brushlinski and Morozov (see Ref. [244] and references therein), who considered isothermal flow. The plasma densities become high at the cathode and lower at the anode. The Hall effect has a particularly noticeable influence on the magnetic field distribution. The field near the anode increases and near the cathode decreases. As a result, the current is deflected to the side and grazes the anode. Our estimations of the Hall parameter show that ωτ![]() 1 if the plasma density near the Teflon surface N>1023 m−3. This is usually the case in the μ-PPT (PPT with the scale length of about few mm and low power), so the Hall effect is expected to be small and will not be considered in this analysis. Therefore Eq. (5.126) is reduced to the simple magnetic transport equation:
1 if the plasma density near the Teflon surface N>1023 m−3. This is usually the case in the μ-PPT (PPT with the scale length of about few mm and low power), so the Hall effect is expected to be small and will not be considered in this analysis. Therefore Eq. (5.126) is reduced to the simple magnetic transport equation:
![]() (5.126)
(5.126)
Having the magnetic field distribution, one can calculate the current density distribution from Ampere’s law:
![]() (5.127)
(5.127)
The magnetic field and current distributions calculated from this model are used in PIC for ion motion calculations. The ion velocity distribution depends upon the magnetic field distribution, and the ion motion is calculated using following momentum equation:
![]() (5.128)
(5.128)
The electric field in this equation was determined using the electron momentum equation and therefore the last equation reduces to the following simplified form:
![]() (5.129)
(5.129)
5.4.4.5 Example of plasma plume simulations
The results are presented for a 3.6 mm (0.141″) diameter axisymmetric μ-PPT, which has a 0.9 mm diameter central electrode, 3.1 mm propellant diameter, and 0.24 mm anode wall [174]. Results presented below correspond to energy of about 2.25 J and C=0.5 μF.
Figure 5.65 shows evolution of the carbon ion (C+) component of the plasma plume during the main part of the pulse. One can see that a high-density region is developed at a few millimeters from the thruster exit plane.
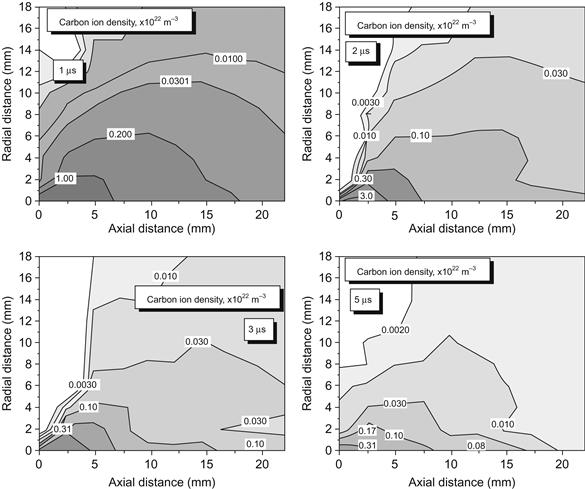
Figure 5.65 Evolution of the carbon ion density during the pulse. Source: Reprinted with permission from Ref. [245]. Copyright (2004) by AIAA.
This dense region exists during the entire pulse as shown in Figure 5.65, but the plasma density decreases from about 2×10²² m−3 at the beginning of the pulse down to 0.3×10²² m−3 at 5 μs. At the beginning (first 2 μs), the C+ density mainly develops a gradient in the radial direction that is a result of high directed velocity in the axial direction. Later, during the discharge pulse, the axial density gradient becomes comparable to the radial one.
The fluorine ions (F+), due to their larger mass, have different dynamics as shown in Figure 5.66. They have smaller acceleration in the axial direction even at the beginning of the pulse and therefore both axial and radial density gradients are developed. The F+ density in the plume and in the high plasma density region is larger than that of C+, because originally Teflon has composition C2F4 with F density twice that of C. Additionally, F ions experience less acceleration in the plume because of their higher mass that also contributes to their relative density increase.
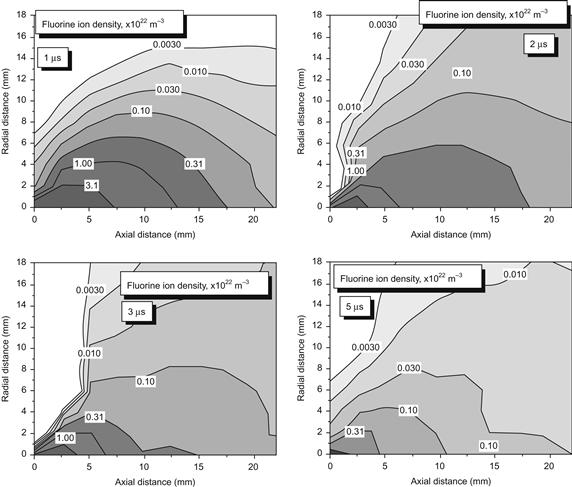
Figure 5.66 Evolution of the fluorine ion density during the discharge pulse. Source: Reprinted with permission from Ref. [245]. Copyright (2004) by AIAA.
The μ-PPT is essentially an electromagnetic accelerator as shown in the velocity phase plots (Figures 5.67 and 5.68). The phase plot of the carbon ions at 5 μs is centered at 10 km/s in the axial direction (note that the sound speed is ~5 km/s for a 4 eV plasma). Ions also experience radial expansion due to the magnetic field structure and expansion. The radial velocity in the negative direction is related to the focus formation along the axis, as shown in Figures 5.67. The fluorine ions have generally smaller axial and radial velocities comparing to carbon ions due to their higher mass.

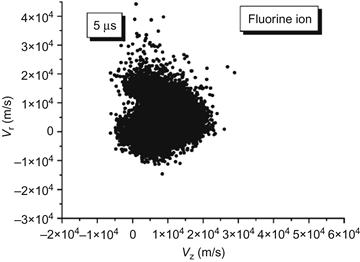
Figure 5.68 Velocity phase plot (radial-axial velocity components) for fluorine ions. Source: Reprinted with permission from Ref. [245]. Copyright (2004) by AIAA.
During the entire pulse, there is a population of ions having a negative axial velocity with magnitude up to about 10 km/s (see Figures 5.67 and 5.68). This population creates the backflow contamination that occurs mainly onto the thruster itself. The carbon ions have a larger negative velocity due to their higher mobility that results in their domination in the backflux. This backflux may be mainly responsible for charring phenomena observed in the μ-PPT [173].
5.4.4.6 Comparison with experiment
In this section, the comparison of measured and predicted electron and neutral density distributions in the near-field plume for one μ-PPT design is discussed.
An experimental basis for comparison is provided using results from a two-color interferometer [245]. Electron and neutral density measurements are taken on a 6.35 mm (1/4″) diameter μ-PPT at AFRL. The interferometer uses 488 and 1152 nm wavelengths and a quadrature heterodyne technique described by Spanjers et al. [246]. The two-color technique uses the difference in phase shifts from the two wavelengths to calculate electron and neutral densities. This technique tends to ensure that both lasers are sampling the same portions of the plume [247]. Older data with less focusing is shown with typical uncertainty in Antonsen et al. [248] along with a more thorough treatment of the two-color diagnostic. The data in Figure 5.69 has a maximum uncertainty of ±1.15×1016 cm−3 for electron density and ±1.76×1016 cm−3 for neutral density at 2 µs into the discharge. For the data shown here, the beam center is located 3 mm from fuel face on the thruster centerline with a beam diameter of 6 mm. It should be noted that the discharge in the μ-PPT may be azimuthally nonuniform (nonaxisymmetric) [249]. Therefore a comparison between an axisymmetric model and experiment in this case may be questionable. However, the mentioned nonuniformity decreases with discharge energy[173] and experimental data are reproducible during many pulses. This suggests that any effect of nonuniformity may be small and our comparison is justified.

Figure 5.69 Comparison of predicted and measured electron and neutral densities time variation at 3 mm from the propellant face at the axis in the case of the 6.35 mm diameter μ-PPT firing at 6 J, θ=0.2: (A) plasma density and (B) neutral density. Source: Reprinted with permission from Ref. [245]. Copyright (2004) by AIAA.
Figure 5.69 shows the experimental data coplotted with model predictions. Plasma density peaks at about 2×10²² m−3 and decreases by several orders of magnitude toward the pulse end. The neutral density is significantly higher and peaks at about 14×1022 m−3. The experimental data were taken at discharge energy of 6.0 J from a 0.417 μF capacitor. One can see that plume model predicts very well magnitude and temporal variation of both electron and neutral densities.
Homework problems
Section 1
1. Calculate the velocity (normalized by local sound speed) at the outer edge of the Knudsen layer as a function of plasma density (1022–1024 m−3). Use iteration to perform analysis. Use the following conditions at the surface: n0=1023 m−3; T0=1000 K and plasma temperature is 0.5 eV. Compare results with and without effect of magnetic field. Current is about 103 A and characteristics size of the electrode is about 1 cm.
2. Compute the Alfven speed in a magnetic field of about 0.1 T and plasma density of about 1020 m−3.
3. Thickness of the ionization layer in ablative pulsed plasma thrusters. Demonstrate that the thickness of the ionization layer decreases with the magnetic field strength using the analysis of plasma acceleration in pulsed plasma accelerators.
4. Compute the ablation rate of the Teflon in the case of surface temperature of about 900 K (use system of equation from Chapter 1, Section 5). Teflon surface is in contact with plasma having density of about 1022 m−3 and temperature of about 3 eV.
Section 2
1. Estimate the frequency of near wall conductivity across the channel having width of about 2 cm. Consider xenon plasma having electron temperature of about 30 eV. (use material from Section 5.2.2)
2. Plot the dependence of the current density distribution on potential drop across the sheath. Consider the near wall conductivity. Comment on effect of the sheath. (use material from Section 5.2.2)
3. Calculate the deviation from the equipotential condition along the magnetic line in the plasma having electron temperature of about 10 eV. Consider the plasma density decrease along the magnetic field by factor of 10.
4. Compute the dependence of the sheath potential drop near the dielectric wall in the Hall thruster channel on the SEE coefficient (0–0.9). Consider Xenon plasma flow with electron temperature of about 20 eV.
5. Assume that SEE coefficient has linear dependence on the electron energy (5–20 eV). Plot the dependence of the sheath potential drop on the electron energy. Consider krypton as a propellant.
6. Anodic plasma analysis. Calculate the near anode potential drop assuming that the electron density near the anode is about 1017 m−3, electron temperature is about 7 eV. Discharge current is 3 A and the anode collection area is about 6 cm2.
7. Consider the sheath thickness near the channel wall of the thruster with anode layer. Electron temperature can be assumed to be about 100 eV. Consider the discharge voltage of about 3 kV, bismuth as a propellant and the channel wall having the cathode potential. Plot the dependence of the maximum sheath thickness on the electron density (1016–1018 m−3).
Section 4
1. Compute the potential drop in the near field plume of the Hall thruster. Consider a plasma flow across the 1 cm layer of a magnetic field of about 0.005 T, Hall parameter of about 10 and density decrease across the layer by factor of 2. Electron temperature is about 5 eV and ion velocity is about 14 km/s.
2. A Hall thruster 10 cm in diameter produces a Xe ion beam at 300 eV. Assume that initially ions have only axial component of velocity. Compute the effective divergence of the beam (angle) if diameter of the beam doubles in a distance of 50 cm and radial component of ion velocity.
3. Estimate the rate of particle production due to charge exchange in the near field plume of Hall thruster having outer diameter of channel of about 10 cm and the inner diameter of about 6 cm. Consider the mass flow rate of about 5 mg/s and the ionization degree of about 10 %. Assume that the ion velocity is about 16 km/s and the neutral particles velocity is about 1 km/s. Plume expansion can be neglected.
4. Compute the sputtering rate of the Kapton plate placed normal to the plasma plume. Consider conditions of the problem #2. Calculate the sputtering at following radial locations: 0, 10, 15 and 20 cm. The molecular weight of Kapton is 382 g/mol and that its mass density is 1.42×10³ kg/m3. Use the sputtering yield of Kapton as a function of ion energy and angle.
References
1. M. Keidar, A.D. Gallimore, Y. Raitses, J.P. Bouef (Eds.), Special issue on plasma propulsion, IEEE Trans. Plasma Sci. 36 (5) (2008) 1962–1966.
2. Jahn RG, Choueiri EY. Electric propulsion. pp. 125–141 Encyclopedia of Physical Science and Technology. vol. 5 third ed. San Diego: pp. 125–141. The Academic Press; 2001.
3. Beilis II. State of the theory of vacuum arcs. IEEE Trans Plasma Sci. 2001;29:657.
4. Keidar M, Boyd ID, Beilis II. Electrical discharge in the Teflon cavity of a co-axial pulsed plasma thruster. IEEE Trans Plasma Sci. 2001;27:376.
5. Muller L. Modelling of an ablation controlled arc. J Phys D Appl Phys. 1993;26:1253–1259.
6. Domejean E, Chevrier P, Fievet C, Petit P. Arc–wall interaction modelling in a low-voltage circuit breaker. J Phys D Appl Phys. 1997;30:2132–2142.
7. Kukhlevsky SV, Kaiser J, Samek O, Liska M, Erostyak J. Stark spectroscopy measurements of electron density of ablative discharges in Teflon–(CF2)n capillaries. J Phys D Appl Phys. 2000;33:1090–1092.
8. Hong D, Dussart R, Cachoncinlle C, et al. Study of a fast ablative capillary discharge dedicated to soft X-ray production. Rev Sci Instrum. 2000;71:15–19.
9. Beilis II. Analysis of the cathode spots in a vacuum arc. Sov Phys Tech Phys. 1974;19:251–256.
10. Zhou X, Heberlein J. Analysis of the arc-cathode interaction of free-burning arcs. Plasma Sources Sci Technol. 1994;3:564.
11. Rethfeld B, Wendelstorf J, Klein T, Simon G. A self-consistent model for the cathode fall region of an electric arc. J Phys D Appl Phys. 1996;29:121.
12. Vondra RJ, Thomassen KI. Flight qualified pulsed plasma thruster for satellite control. J Spacecraft Rockets. 1974;11(9):613–617.
13. Keidar M, Boyd ID, Beilis II. On the model of teè on ablation in an ablation-controlled discharge. J Phys D Appl Phys. 2001;34:1675.
14. M. Keidar, I.D. Boyd, F.S. Gulczinski III, E. Antonsen, G.G. Spanjers, in: 27th International Electrical Propulsion Conference, Pasadena, CA, 2001 (IEPC-01-155).
15. G.G. Spanjers, D.R. Bromaghim, C.J. Lake, M. Dulligan, D. White, J.H. Schilling, et al., in: 28th AIAA Joint Propulsion Conference, Indianapolis, IN, 2002 (Paper AIAA-2002-3974).
16. Anisimov SI. Vaporization of metal absorbing laser radiation. Sov Phys JETP. 1968;27:182.
17. Beilis II. On the theory of the erosion processes in the cathode region of an arc discharge. Sov Phys Dokl. 1982;27:150.
18. Knight CJ. Theoretical modeling of rapid surface vaporization with back pressure. AIAA J. 1979;17:519.
19. Keidar M, Fan J, Boyd ID, Beilis II. Vaporization of heated materials into discharge plasmas. J Appl Phys. 2001;89:3095.
20. I. Mikellides, Theoretical modeling and optimization of ablation-fed pulsed plasma thrusters, Ph.D Thesis, Ohio State University, Columbus, 2000.
21. Turchi PJ, Mikellides IG, Mikellides PG, Kamhawi H. In: AIAA 2000;Micci MM, Ketsdever AD, eds. Micropropulsion for Small Spacecraft. vol. 187 Progress in Astronautics and Aeronautics.
22. Alfven H. On the Origin of the Solar System Oxford: Oxford University Press; 1964.
23. Burton RL, et al. Pulsed plasma thruster performance for microspacecraft propulsion. Progress in Astronautics and Aeronautics In: Reston VA AIAA 2000;Michael M, Micci, Ketsdever AD, eds. Micropropulsion for Small Spacecraft. vol. 187.
24. Danielson L. Experiment on the interaction between a plasma and a neutral gas. Phys Fluids. 1970;13:2288.
25. Keidar M, Boyd ID, Beilis II. Model of an electrothermal pulsed plasma thruster. J Propul Power. 2003;19(3):424–430.
26. Potter DE. Numerical studies of the plasma focus. Phys Fluids. 1971;14:1911.
27. Fruchtman A, Fisch NJ, Raitses Y. Control of the electric-field profile in the Hall thruster. Phys Plasmas. 2001;8:1048.
28. Ahedo E, Martinez-Cerezo P, Martinez-Sanchez M. One-dimensional model of the plasma flow in a Hall thruster. Phys Plasmas. 2001;8:3058.
29. Zemskov AI, Prut VV, Khrabrov VA. Pulsed discharge in dielectric chamber. Sov Phys Tech Phys. 1972;17:285–289.
30. Kozlov GI, Kuznetsov VA, Masyukov VA. Radiative losses by argon plasma and the emissive model of a continuous optical discharge. Sov Phys JETP. 1974;39:463–468.
31. Raizer YP. Gas Discharge Physics Moscow: Nauka; 1987; (in Russian).
32. Kingsep AS, Mokhov YuV, Chukbar KV. Sov J Plasma Phys. 1984;10(4):495.
33. Markusic TE, Polzin KA, Choueiri EY, Keidar M, Boyd ID, Lepsetz N. Ablative Z-pinch pulsed plasma thruster. J Propul Power. 2005;21(2):392–400.
34. IAEA Aladin database <http://www-amdis.iaea.org/aladdin.html>.
35. Vondra RJ. (Paper 76-998) The MIT Lincoln Laboratory Pulsed Plasma Thruster Reston VA: AIAA; 1976.
36. P.J. Turchi, Directions for improving PPT performance, in: Proceedings of the 25th International Electric Propulsion Conference, vol. 1, Worthington, OH, 1998, pp. 251–258.
37. E. Antonsen, R.L. Burton, F. Rysanek, Energy Measurements in a Co-Axial Electromagnetic Pulsed Plasma Thruster, Reston VA (Paper AIAA-1999-2292).
38. F. Gulczinski III, M. Dulligan, J. Lakes, G. Spanjers, Micropropulsion research at AFRL, Reston VA (Paper AIAA-2000-3255).
39. R.L. Burton, S.S. Bushman, Probe measurements in a co-axial gasdynamic PPT, in: 35th Joint Propulsion Conference, AIAA, Los Angeles, CA, 1999, pp. 99–2288.
40. F. Rysanek, R.L. Burton, in: 36th Joint Propulsion Conference, AIAA, Huntsville AL, 2000 (Paper 2000-3429).
41. Keidar M, Beilis II. Non-equilibrium thermal boundary layer in a capillary discharge with an ablative wall. Phys Plasmas. 2006;13:114503.
42. S.S. Bushman, Investigations of a coaxial pulsed plasma thruster, Master’s Thesis, University of Illinois Urbana-Champaign, 1999.
43. Keidar M, Boyd ID, Beilis II. On the model of Teflon ablation in an ablation-controlled discharge. J Phys D Appl Phys. 2001;34(June):1675–1677.
44. Beilis II. Parameters of the kinetic layer of arc discharge cathode region. IEEE Trans Plasma Sci. 1985;PS-13:288–290.
45. Ruchti CB, Niemeyer L. Ablation controlled arc. IEEE Trans Plasma Sci. 1986;14:423–434.
46. Kovatya P, Lowke JJ. Theoretical predictions of ablation-stabilised arcs confined in cylindrical tubes. J Phys D Appl Phys. 1984;17:1197–1212.
47. Kovatya P. Thermodynamic and transport properties of ablated vapors of PTFE, alumina, perspex and PVC in the temperature range 5000–30000 K. IEEE Trans Plasma Sci. 1984;12:38–42.
48. Schmahl CS, Turchi PJ. Development of equation-of-state and transport properties for molecular plasmas in pulsed plasma thrusters Part I: A two-temperature equation of state for Teflon. Proc Inter Electr Propul Conf 1997;781–788.
49. Burton RL, Hilko BK, Witherspoon FD, Jaafari G. Energy-mass coupling in high-pressure liquid-injected arcs. IEEE Trans Plasma Sci. 1991;19:340–349.
50. Spanjers GG, Lotspeich JS, McFall KA, Spores RA. J Propul Power. 1998;14(4):554–559.
51. A. Shapiro, The Dynamics and Thermodynamics of Compressible Fluid Flow, Wiley, New York, NY.
52. V. Kim, The Main Physical Features of SPT Thruster and Classification (IEPC-2011-007).
53. Kim V. Main physical features and processes determining the performance of stationary plasma thrusters. J Prop Power. 1998;14(5):736–743.
54. Yushmanov EE. Radial distribution of the potential in cylindrical trap with magnetron ion injection. In: Moscow: USSR Academy of Science; 1958;235–237. Leontovich MA, ed. Plasma Physics and Problem of Controlled Fusion. vol. IV (in Russian).
55. A.V. Zharinov, Electric double layer in strong magnetic field, Kurchatov Institute Report, 1961 (in Russian).
56. Seikel GR, Reshotko E. Hall current ion accelerator. Bull Am Phys Soc Sr II. 1962;7:414.
57. Salz F, Meyerand RG, Lary EC. Ion acceleration in a gyro-dominated neutral plasma-theory. Bull Am Phys Soc Sr II. 1962;7:441.
58. Janes GS, Lowder RS. Anomalous electron diffusion and ion acceleration in a low-density plasma. Phys Fluids. 1966;9(6):1115–1123.
59. Zharinov AV, Popov YuS. Acceleration of plasma by a closed Hall current. Sov Phys Tech Phys. 1967;12(2):208–211.
60. Morozov AI. Effect of near-wall conductivity in magnetized plasma. J Appl Math Tech Phys. 1968;3:19–22.
61. Zhurin VV, Kaufman HR, Robinson RS. Plasma Sources Sci Technol. 1999;8:1.
62. Morozov AI. Focusing of the cold quasineutral beams in electromagnetic fields. Doklady Akademii Nauk. 1965;163(36):1363 (in Russian).
63. Choueiri E. Fundamental difference between the two Hall thruster variants. Phys Plasmas. 2001;8(11):5025–5033.
64. Vlasov MA, Zharinov AV, Kovalenko YuA. On the theory of discharge in crossed fields. Sov Phys Tech Phys. 2001;46(12):1522–1529.
65. Kovalenko AYu, Kovalenko YuA. Modeling of a discharge in crossed fields with account of collisions and ionization. Sov Phys Tech Phys. 2003;48(11):1413–1418.
66. Yu. A, Kovalenko Yu, Kovalenko, Keidar M. Conditions for formation of a kinetic anode layer in crossed E×B fields. Appl Phys Lett. 2006;89:051503.
67. Beilis II, Fruchtman A, Maron Y. A mechanism for ion acceleration near the anode of a magnetically insulated ion diode. IEEE Trans Plasma Sci. 1998;26(3):995–999.
68. Y. Raitses, J. Ashkenazy, G. Appelbaum, M. Guelman, 25th International Conference on Electric Propulsion, Cleveland, OH, The Electric Rocket Propulsion Society, Worthington, OH, 1997 (IEPC 97-056).
69. Raitses Y, Dorf L, Litvak A, Fisch N. Plume reduction in segmented electrode Hall thruster. J Appl Phys. 2000;88(3):1263–1270.
70. Raitses Y, Staack D, Smirnov A, Fisch NJ. Space charge saturated sheath regime and electron temperature saturation in Hall thrusters. Phys Plasmas. 2005;12(7):073507.
71. J.M. Fife, Hybrid PIC modeling and electrostatic probe survey of Hall thrusters, Ph.D. Thesis, MIT, Cambridge MA, 1998.
72. Bouef JP, Garrigues L. Low-frequency oscillations in a stationary plasma thrusters. J Appl Phys. 1998;84(7):3541–3550.
73. I.D. Boyd, L. Garrigues, J. Koo, M. Keidar, Progress in development of a combined device/plume model for Hall thrusters, in: 36th AIAA Joint Propulsion Conference, Huntsville, AL, 2000, American Institute of Aeronautics and Astronautics, Washington, DC, 2000 (AIAA-2000-3520).
74. A. Fruchtman, N.J. Fisch, Modeling of a Hall thruster, in: 34th AIAA Joint Propulsion Conference, Cleveland, OH, 1998, American Institute of Aeronautics and Astronautics, Washington, DC, 1998 (AIAA-1998-3500).
75. Ahedo E, Martinez P, Martines-Sanches M. One dimensional model of the plasma flow in a Hall thruster. Phys Plasmas. 2001;8(6):3058–3067.
76. K. Makowsky, Z. Peradzynski, N. Gascon, M. Dudeck, in: 35th AIAA Joint Propulsion Conference, Los Angeles, CA, 1999, American Institute of Aeronautics and Astronautics, Washington, DC, 1999 (AIAA-99-2295).
77. S. Locke, U. Schumlak, J.M. Fife, in: 37th AIAA Joint Propulsion Conference, Salt Lake City, UT, 2001, American Institute of Aeronautics and Astronautics, Washington, DC, 2001 (AIAA-01-3327).
78. Keidar M, Boyd ID, Beilis II. Plasma flow and plasma–wall transition in Hall thruster channel. Phys Plasmas. 2001;8(12):5315–5322.
79. Keidar M, Boyd ID, Beilis II. Modeling of a high-power thruster with anode layer. Phys Plasmas. 2004;11(4):1715–1722.
80. Keidar M, Gallimore AD, Raitses Y, Boyd ID. On the potential distribution in Hall thrusters. Appl Phys Lett. 2004;85(13):2481–2483.
81. Raitses Y, Keidar M, Staack D, Fisch NJ. Effects of segmented electrode in Hall current plasma thrusters. J Appl Phys. 2002;92(9):4611–4906.
82. Keidar M, Boyd ID. On the mirror effect in Hall thrusters. Appl Phys Lett. 2005;87(Sept):121501.
83. Raitses Y, Staack D, Keidar M, Fisch NJ. Electron–wall interaction in Hall thrusters. Phys Plasmas. 2005;12:057104.
84. Beilis II, Keidar M, Goldsmith S. Plasma–wall transition: the influence of the electron to ion current ratio on the magnetic presheath structure. Phys Plasmas. 1997;4(10):3461–3468.
85. Bohm O. In: Guthrue A, Wakerling RK, eds. The Characteristics of Electrical Discharges in Magnetic Fields. New York, NY: McGraw Hill Book Co., 1949.
86. Choueiri EY. Plasma oscillations in Hall thrusters. Phys Plasmas. 2001;8(4):1426–1441.
87. Litvak AA, Fisch NJ. Resistive instabilities in Hall current plasma discharge. Phys Plasmas. 2001;8(2):648–651.
88. Chesta E, Meezan NB, Cappelli MA. Stability of a magnetized Hall plasma discharge. J Appl Phys. 2001;89(6):3099–3107.
89. Litvak AA, Raitses Y, Fisch NJ. Experimental studies of high-frequency azimuthal waves in Hall thrusters. Phys Plasmas. 2004;11(4):1701–1705.
90. Litvak AA, Fisch NJ. Rayleigh instability in Hall thruster. Phys Plasmas. 2004;11(4):1379–1383.
91. Lazurenko A, Vial V, Prioul M, Bouchoule A. Experimental investigation of high-frequency drifting perturbations in Hall thrusters. Phys Plasmas. 2005;12(1):013501.
92. Adam JC, Heron A, Laval G. Study of stationary plasma thrusters using two-dimensional fully kinetic simulations. Phys Plasmas. 2004;11(1):295–305.
93. C.A. Thomas, M.A. Cappelli, Gradient transport processes in E×B plasmas, in: 41th AIAA Joint Propulsion Conference, Tucson, AZ, 2005, American Institute of Aeronautics and Astronautics, Washington, DC, 2005 (AIAA paper 2005-4063).
94. Alcock MW, Keen BE. Experimental observation of the drift dissipative instability in an afterglow plasma. Phys Rev A. 1971;3(3):1087–1096.
95. Chable S, Rogier F. Numerical investigation and modeling of stationary plasma thruster low frequency oscillations. Phys Plasmas. 2005;12:033504.
96. Hobbs GD, Wesson JA. Heat flow through a Langmuir sheath in the presence of electron emission. Plasma Phys. 1967;9:85–87.
97. V.I. Baranov, Yu.S. Nazarenko, V.A. Petrosov, A.I. Vasin, Yu.M. Yashnov, Energy balance and role of walls in ACDE, in: 25th International Conference on Electric Propulsion, Cleveland, OH, The Electric Rocket Propulsion Society, Worthington, OH, 1997 (IEPC-97-060).
98. Morozov AI, Shubin AP. Electron kinetics in the near-wall conductivity regime. Sov J Plasma Phys. 1984;10:1262–1269.
99. Morozov AI, Savel’ev VV. Theory of the near-wall conductivity. Plasma Phys Rep. 2001;27(7):570–575.
100. Ivanov AA, Ivanov Jr AA, Bacal M. Effect of plasma–wall recombination on the conductivity in Hall thrusters. Plasma Phys Control Fusion. 2002;44:1463–1470.
101. Levchenko I, Keidar M. Visualization of ion flux neutralization effect on electrical field and atom density distribution in Hall thruster channel. IEEE Trans Plasma Science. 2005;33(2):526–527.
102. S. Barral, K. Makowski, Z. Peradzynski, and M. Dudeck, Is nearwall conductivity a misnomer_B plasmas, in: Proc. 39th AIAA Joint Propulsion Conference, Huntsville, AL, Reston VA, 2003, AIAA 2003-4855.
103. Keidar M, Beilis II. Electron transport phenomena in plasma devices with E×B drift (invited review). IEEE Trans Plasma Sci. 2006;34(3):804–814.
104. Egorov VV, Kim V, Semenov AA, Shkarban II. Near-wall process and its influence on operation of accelerators with closed electron drift. Ion Injectors and Plasma Accelerators Moscow: Energoatomizdat; 1990; (in Russian).
105. Schwager LA. Effects of secondary and thermoionic electron emission on the collector and source sheaths of a finite ion temperature plasma using kinetic theory and numerical simulation. Phys Fluids. 1993;B5(2):631–645.
106. Morozov AI. Effect of near-wall conductivity in a strongly magnetized plasma. Sov Phys Dokl. 1966;10:775.
107. A.I. Morozov, V.V. Savel’ev, in: 24th International Conference on Electric Propulsion, Moscow, Russia, The Electric Rocket Propulsion Society, Worthington, OH, 1995 (IEPC-95-161).
108. Meezan NB, Hargus WA, Cappelli MA. Anomalous electron mobility in a coaxial Hall discharge plasma. Phys Rev. 2001;E63:026410.
109. J.M. Fife, S. Locke, AIAA Aerospace Sciences Meeting and Exhibit, 2001, Reno, NV, American Institute of Aeronautics and Astronautics, Washington, DC, 2001 (AIAA-2001-1137).
110. Morozov AI. Effect of near-wall conductivity in a strongly magnetized plasma. Prikl Mekh Tekh Fiz. 1968;3:19.
111. King LB, Gallimore AD, Marrese CM. Transport property measurements in the Plume of an SPT-100 Hall thruster. J Prop Power. 1998;14:327.
112. J.P. Bugeat, C. Koppel, Development of a second generation of SPT, in: 24th International Conference Electric Propulsion, Moscow, Russia, The Electric Rocket Propulsion Society, Worthington, OH, 1995 (IEPC-95-35).
113. S. Bechu, G. Perot, N. Gascon, P. Lasgorceix, A. Hauser, M. Dudeck, in: 35th AIAA Joint Propulsion Conference, Los Angeles, CA, 1999, American Institute of Aeronautics and Astronautics, Washington, DC, 1999 (AIAA-99-2567).
114. Morozov AI, Savel’ev VV. One-Dimensional hybrid model of a stationary plasma thruster. Plasma Phys Rep. 2000;26:219.
115. S. Kim, J.E. Foster, A.D. Gallimore, in: 32th AIAA Joint Propulsion Conference, Orlando, FL, American Institute of Aeronautics and Astronautics, Washington, DC, 1996 (AIAA-96-2972).
116. Keidar M, Beilis I, Boxman RL, Goldsmith S. 2-D expansion of the low-density interelectrode vac-uum arc plasma jet in an axial magnetic field. J Phys D Appl Phys. 1996;29:1973.
117. Bishaev AM, Kim V. Sov Phys Tech Phys. 1978;23(9):1055.
118. J.M. Haas, A.D. Gallimore, An investigation of internal ion number density and electron temperature profiles in a laboratory-model hall thruster, in: 36th Joint Propulsion Conference (JPC) Huntsville, AL, 2000, American Institute of Aeronautics and Astronautics, Washington, DC, 2000 (AIAA-00-3422).
119. R.C. Weast (Ed.), Handbook of Chemistry and Physics, The Chemical Rubber Co., Boca Raton FL 1965, p. E-138.
120. J.M. Fife, Hybrid PIC modeling and electrostatic probe survey of Hall thrusters, Ph.D. Thesis, MIT, Cambridge, MA, 1998.
121. A. Fruchtman, N. J. Fisch, Modeling of a Hall thruster, in: 34th AIAA Joint Propulsion Conference, Cleveland, OH, 1998, American Institute of Aeronautics and Astronautics, Washington, DC, 1998 (AIAA-1998-3500).
122. K. Makowsky, Z. Peradzynski, N. Gascon, M. Dudeck, in: 35th AIAA Joint Propulsion Conference, Los Angeles, CA, 1999, American Institute of Aeronautics and Astronautics, Washington, DC, 1999 (AIAA-99-2295).
123. Ashkenazy J, Raitses Y, Appelbaum G. Parametric studies of the Hall current plasma thruster. Phys Plasmas. 1998;5:2055.
124. Barral S, Makowski K, Peradzyński Z, Gaskon N, Dudeck M. Wall material effects in stationary plasma thrusters II Near-wall and in-wall conductivity. Phys Plasmas. 2003;10:4137–4152.
125. Keidar M, Beilis I, Boxman RL, Goldsmith S. 2-D expansion of the low-density interelectrode vacuum arc plasma jet in an axial magnetic field. J Phys D Appl Phys. 1996;29:1973–1983.
126. Ahedo E, Gallardo JM, Martinez-Sanchez M. Effects of the radial plasma–wall interaction on the Hall thruster discharge. Phys Plasmas. 2003;10:3397.
127. Keidar M, Boyd I, Beilis II. Plasma flow and plasma–wall transition in Hall thruster channel. Phys Plasmas. 2001;8:5315.
128. Meezan N, Cappelli M. Kinetic study of wall collisions in a coaxial Hall discharge. Phys Rev E. 2002;66:036401.
129. O. Batishchev, M. Martinez-Sanchez, Charged particles transport in the Hall effect thruster, in: Proc. 28th International Electric Propulsion Conference, 2003, Toulouse, France, Electric Rocket Propulsion Society, Cleveland, OH 2003 (IEPC paper 2003-188).
130. D.Y. Sydorenko, A.I. Smolyakov, Simulation of secondary electron emission effects in a plasma slab in crossed electric and magnetic fields, in: APS DPP 46th Annual Meeting, Savannah, GA, 2004 (NM2B.008).
131. Sydorenko D, Smolyakov A, Kaganovich I, Raitses Y. Kinetic simulation of secondary electron emission effects in Hall thrusters. Phys Plasmas. 2006;13:014501.
132. Ahedo E, Parra F. Partial trapping of secondary-electron emission in a Hall thruster. Phys Plasmas. 2005;12:073503.
133. Raitses Y, Staack D, Smirnov A, Fisch NJ. Space charge saturated sheath regime and temperature saturation in Hall thrusters. Phys Plasmas. 2005;12:073507.
134. Haas JM, Gallimore AD. IEEE Trans Plasma Sci. 2002;30:687.
135. Haas JM, Gallimore AD. Phys Plasmas. 2001;8:652.
136. T.B. Smith, D.A. Herman, A.D. Gallimore, R.P. Drake, Deconvolution of axial velocity distributions from Hall thruster LIF spectra, in: 27th International Electric Propulsion Conference, Pasadena, CA, 2001 (IEPC-01-019).
137. Dorf L, Raitses Y, Fisch NJ, Semenov V. Effect of anode dielectric coating on Hall thruster operation. Appl Phys Lett. 2004;84:1070.
138. Melikov I. Soviet Phys Tech Phys. 1977;22:452.
139. Melikov IV. Soviet Phys Tech Phys. 1974;19:35.
140. M. Keidar, I.D. Boyd, I.I. Beilis, Analyses of the anode region of a Hall thruster channel, in: Proc. 38th Joint Propulsion Conference and Exhibit, 2002, Indianapolis, IN, American institute of Aeronautics and Astronautics, Reston, VA, 2002 (AIAA-2002-4107).
141. J. Koo, M. Keidar, I.D. Boyd, Boundary conditions for a 2-D hybrid stationary plasma thruster model, in: Proc. 40th Joint Propulsion Conference and Exhibit, 2004 Fort Lauderdale, FL. American institute of Aeronautics and Astronautics, Reston, VA, 2002 (AIAA-2004-3781).
142. Ahedo E, Rus J. J Appl Phys. 2005;98:043306.
143. Dorf L, Raitses Y, Fisch NJ. J Appl Phys. 2005;97:103309.
144. Anders A, Anders S. Plasma Sources Sci Technol. 1995;4:571.
145. Katz I, Anderson JR, Polk JE, Brophy JR. J Prop Power. 2003;19:595.
146. Keidar M, Beilis II. IEEE Trans Plasma Sci. 2005;33:1481.
147. Lieberman MA, Lichtenberg AJ. Principles of Plasma Discharges and Materials Processing New York, NY: Wiley; 1994.
148. Dorf L, Raitses Y, Fisch NJ. Rev Sci Instrum. 2004;75:1255.
149. Beilis II, Fruchtman A, Maron I. IEEE Trans Plasma Sci. 1998;26:995.
150. D.T. Jacobson, R.S. Jankovsky, V.K. Rawlin, D.H. Manzella, High voltage TAL performance, in: 37th AIAA Joint Propulsion Conference, Salt Lake City, UT, 2001, American Institute of Aeronautics and Astronautics, Washington, DC, 2001 (AIAA-2001-3777).
151. S. Tverdokhlebov, A. Semenkin, J. Polk, Bismuth propellant option lor very high power tal thruster, in: 40th AIAA Aerospace Sciences Meeting, Reno, NV, 2002, American Institute of Aeronautics and Astronautics, Washington, DC, 2002 (AIAA Paper 2002-0348).
152. Keidar M, Boyd ID. Effect of a magnetic field on the plasma plume from Hall Thruster. J Appl Phys. 1999;86:4786–4791.
153. A.E. Soloduchin, A.V. Semenkin, Study of discharge channel erosio in multi mode anode layer thruster in: 28th International Conference on Electric Propulsion, Toulouse, France, The Electric Rocket Propulsion Society, Worthington, OH, 2003 (IEPC-2003-0204).
154. Beilis II, Keidar M. Phys Plasmas. 1998;5:1545.
155. V.S. Erofeev, L.V. Leskov in: Physics and Application of Plasma Accelerators, A.I. Morozov, (Ed.), Minsk, 1974 (in Russian).
156. Child CD. Phys Rev. 1911;32:492.
157. Langmuir I. Phys Rev Ser II. 1913;2:450.
158. Keidar M, Monteiro OR, Anders A, Boyd. ID. App Phys Lett. 2002;81(7):1183.
159. Y. Raitses, D. Staack, L. Dorf, N.J. Fisch, Experimental study of acceleration region in A 2 Kw Hall thruster, in: 39th AIAA Joint Propulsion Conference, Huntsville, AL, 2003, American Institute of Aeronautics and Astronautics, Washington, DC, 2003 (AIAA paper-2003-5153).
160. L. Brieda, M. Keidar, Multiscale modeling of Hall thrusters, in: 32nd International Electric Propulsion Conference in Wiesbaden, Germany, 2011 (Paper IEPC-2011-101).
161. Brieda L, Pai S, Keidar M. Kinetic analysis of electron transport in a cylindrical Hall Thruster. IEEE Trans Plasma Sci. 2011;39(11):2946–2947.
162. R.A. Spores, R.B. Cohen, M. Birkan, The USAF electric propulsion program, in: Proc. 25th International Electric Propulsion Conference, vol. 1, Worthington, OH, 1997, p. 1.
163. M. Birkan, Formation flying and micro-propulsion workshop, Lancaster, CA, 1998.
164. Turchi PJ. Directions for improving PPT performance. Proceeding of the 25th International Electric Propulsion Conference. vol. 1 Worthington, OH: The Electric Rocket Propulsion Society; 1997; 1998, pp. 251–258.
165. C.A. Scharlemann, R. Corey, I.G. Mikellides, P.J. Turchi, P.G. Mikellides, Pulsed plasma thruster variations for improved mission capabilities, in: 36th Joint Propulsion Conference (JPC) Huntsville, AL, 2000, American Institute of Aeronautics and Astronautics, Washington, DC (AIAA Paper-00-3260).
166. Choueiri EY. System optimization of ablative pulsed plasma thruster for stationkeeping. J Spacecraft Rockets. 1996;33(1):96–100.
167. M. Keidar, I.D. Boyd, Device and plume model for an electrothermal pulsed plasma thruster, in: 36th Joint Propulsion Conference (JPC) Huntsville, AL, 2000, American Institute of Aeronautics and Astronautics, Washington, DC (AIAA Paper 2000-3430).
168. J.W. Dunning, S. Benson, S. Oleson, NASA’s electric propulsion program, in: 27th International Electric Propulsion Conference, Pasadena, CA, 2001 (IEPC-01-002).
169. C. Zakrzwsky, S. Benson, P. Sanneman, A. Hoskins, On-orbit testing of the EO-1 pulsed plasma thruster, in: 38th Joint Propulsion Conference, 2002, Indianapolis IN (AIAA-2002-3973).
170. G.G. Spanjers, D. White, J. Schilling, S. Bushman, J. Lake, M. Dulligan, AFRL MicroPPT development for the TechSat21 flight, in: 27th International Electric Propulsion Conference, Pasadena, CA, 2001 (IEPC paper 2001-166).
171. G.G. Spanjers, D.R. Bromaghim, J. Lake, M. Dulligan, D. White, J.H. Schilling, et al., AFRL microPPT development for small spacecraft propulsion, in: 38th AIAA Joint Propulsion Conference, Indianapolis, IN, 2002 (Paper AIAA-2002-3974).
172. F.S. Gulczinski, M.J. Dulligan, J.P. Lake, G.G. Spanjer, Micropropulsion research at AFRL, in: 36th AIAA Joint Propulsion Conference, Huntsville, AL, 2000 (Paper AIAA-2000-3255).
173. M. Keidar, I.D. Boyd, E.L. Antonsen, F.S. Gulczinski III, G.G. Spanjers, Propellant charring in pulsed plasma thrusters, J. Propulsion Power, 20 (6) (2004) 978.
174. Keidar M, Boyd ID, Antonsen EL, Burton RL, Spanjers GG. Optimization issues for a micro-pulsed plasma thruster. J Propulsion Power. 2006;22(1):48–55.
175. Phipps C, Luke J. Diode laser-driven microthrusters: a new departure for micropropulsion. AIAA J. 2002;40:310–317.
176. D.A. Gonzalez, R.P. Baker, Microchip laser propulsion for small satellites, in: 37th AIAA/ASME/SAE/ASEE Joint Propulsion Conference, 2001 (AIAA Paper 2001-3789).
177. Boyd ID, Keidar M. Simulation of the plasma plume generated by a microlaser ablation thruster. In: Proc. SPIE 2002;852. Phipps CR, ed. High-Power Laser Ablation IV. vol. 4760.
178. Keidar M, Boyd ID, Luke J, Phipps C. Plasma generation and plume expansion for a transmission-mode micro-laser plasma thruster. J Appl Phys. 2004;96(1):49–56.
179. J. E. Polk, M. Sekerak, J. K. Ziemer, J. Schein, N. Qi, R. Binder et al., A theoretical analysis of vacuum arc thruster performance, in: 27th International Electric Propulsion Conference, Pasadena, CA, 2001 (Paper IEPC-2001-211).
180. N. Qi, S. Gensler, R.R. Prasad, M. Krishnan, A. Visir, I.G. Brown, A pulsed vacuum arc ion thruster for distributed small satellite systems, in: 34th AIAA Joint Propulsion Conference, Cleveland OH, 1998 (AIAA-98-3663).
181. N. Qi, J. Schein, R. Binder, M. Krishnan, A. Anders, J. Polk, Compact vacuum arc micro-thruster for small satellite systems, in: 37th Joint Propulsion Conference, Salt Lake City, UT, 2001 (AIAA Paper 2001-3793).
182. J. Schein, N. Qi, R. Binder, M. Krishnan, J.K. Ziemer, J.E. Polk, A. Anders, Low mass vacuum arc thruster system for station keeping missions, in: 27th International Electric Propulsion Conference, Pasadena, CA, 2001 (IEPC-01-228).
183. M. Au, J. Schein, A. Gerhan, K. Wilson, B. Tang, M. Krishnan, Magnetically enhanced vacuum arc thruster (MVAT), AIAA-2004-3618, in: 40th AIAA/ASME/SAE/ASEE Joint Propulsion Conference and Exhibit, Fort Lauderdale, Florida, July 11–14, 2004.
184. M. Keidar, J. Schein, Modeling of a magnetically enhanced vacuum arc thruster, in: 40th AIAA Joint Propulsion Conference, Fort Lauderdale, FL, 2004 (Paper AIAA−04-4117).
185. Keidar M, Schein J, Wilson K, et al. Magnetically enhanced vacuum arc thruster. Plasma Source Sci Technol. 2005;14:661–669.
186. Tanberg R. On the cathode of an arc drawn in vacuum. Phys Rev. 1930;35:1080.
187. Robertson R. The force on the cathode of a copper arc. Phys Rev. 1938;53:578.
188. Marks H, Beilis II, Boxman RL. Measurement of the vacuum arc plasma force. IEEE Trans Plasma Sci. 2009;37(7):1332–1337 Part 2.
189. Dorodnov AM. Pulsed metallic plasma generators Sov Phys Tech Phys. 1978;23(9):1058–1064.
190. Dethlefsen R. Performance measurements of a pulsed vacuum arc thruster. AIAA J. 1968;6:1197–1199.
191. N. Qi, S. Gensler, R.R. Prasad, M. Krishnan, A. Visir, I.G. Brown, A pulsed vacuum arc ion thruster for distributed small satellite systems, in: 34th Joint Propulsion Conference, 1998 (AIAA-Paper-98-3663).
192. Keidar M, Beilis I, Boxman R, Gold-smith S. Voltage of the vacuum Arc with a ring anode in an axial magnetic field. IEEE Trans Plasma Sci. 1997;25(4):580–585.
193. Schein J, Anders A, Binder R, et al. Inductive energy storage driven vacuum arc thruster. Rev Sci Instrum. 2002;72:925–927.
194. J. Schein, M. Krishnan, J. Ziemer, J. Polk, Adding a “Throttle” to a clustered vacuum arc thruster, in: Nanotech Conference, 2002 (AIAA paper 2002-5716).
195. J. Schein, A. Gerhan, F. Rysanek, M. Krishnan, Vacuum arc thruster for cubesat propulsion, in: 28th International Electric Propulsion Conference, Toulouse, France, 2003 (IEPC-0276, 28th IEPC).
196. A.S. Gilmour, Concerning the feasibility of a vacuum arc thruster, in: A.I.A.A. Fifth Electric Propulsion Conference, San Diego, CA, 1966 (AIAA Paper 66-202).
197. A.S. Gilmour, R.J. Clark, H. Veron, Pulsed vacuum-arc microthrusters, in: AIAA Electric Propulsion and Plasmadynamics Conference, Colorado Springs, CO, 1967 (AIAA Paper 67-737).
198. Anders A, Anders S, Brown IG. Transport of vacuum arc plasmas through magnetic macroparticle filters. Plasma Sources Sci Technol. 1995;4:1–12.
199. M. Au, J. Schein, A. Gerhan, K. Wilson, B. Tang, M. Krishnan, Magnetically enhanced vacuum arc thruster (MVAT), in: 40th AIAA Joint Propulsion Conference, Fort Lauderdale, FL, 2004 (AIAA Paper 2004-3618).
200. Beilis. II. Vacuum arc cathode spot grouping and motion in magnetic fields. IEEE Trans Plasma Sci. 2002;30(6):2124–2132.
201. Djakov BE, Holmes R. J Phys D Appl Phys. 1974;7:569.
202. Beilis II, Djakov BE, Juttner B, Pursch. Structure and dynamics of high-current arc cathode spots in vacuum. J Phys D: Appl Phys. 1997;30(1):119–130.
203. Murphree D. Phys Fluids. 1970;13(1747):1970.
204. Ecker G, Muller KG. J Appl Phys. 1958;29:1606.
205. Zhuang T, Shashurin A, Keidar M, Beilis II. Circular periodic motion of plasma produced by a small-scale vacuum arc. Plasma Sources Sci Technol. 2011;20:015009.
206. Kimblin CWJ. Appl Phys. 1973;44:3074.
207. Zhuang T, et al. J Prop Power 2012; (in review).
208. Zhuang T, Shashurin A, Beilis II, Keidar M. Ion velocities in a micro-cathode arc thruster. Phys Plasmas. 2012;19:063501.
209. C.A. Scharemann, T.M. York, Pulsed plasma thruster using water propellant, in: 39th AIAA/ASME/SAE/ASEE Joint Propulsion Conference, Huntsville AL, 2003 (Paper AIAA-2003-5022).
210. D. Simon, H.B. Land III, Micro pulsed plasma thruster technology development, in: 40th AIAA/ASME/SAE/ASEE Joint Propulsion Conference, Fort Lauderdale, 2004 (Paper AIAA-2004-3622).
211. Tajmar, MEMS Indoum F.E.E.P. thruster: manufacturing study and first prototype results, in: 40th AIAA/ASME/SAE/ASEE Joint Propulsion Conference, Fort Lauderdale, 2004 (AIAA-2004).
212. M. Tajmar, K. Marhold, S. Kropatsch, Three-dimensional In-FEEP plasmadiagnostics, in: Proc. International Electric Propulsion Conference, Toulouse, France, 2003 (IEPC-2003-161).
213. E. Chesta, D. Nicolini, D. Robertson, G. Saccoccia, Experimental studies related to field emission thruster operation: emission impact on solar cell performances and neutralization electron backstreaming phenomena, in: Proc. International Electric Propulsion Conference, Toulouse, France, 2003 (IEPC-2003-102).
214. Tajmar M, Genovese A. Appl Phys. 2003;A76:1003.
215. Rayleigh L. Math Soc. 1878;10:4.
216. Faraday M. Phil Trans Roy Soc. 1831;121:299.
217. Vladimirov VV, Badan VE, Gorshkov VN. Surf Sci. 1992;266:185.
218. Mair GLR. J Phys D Appl Phys. 1996;29:2186.
219. Crowley JM. J Appl Phys. 1977;48(1):145.
220. J. Mueller, et al., An overview of MEMS-base micropropulsion development at JPL, in: Third International Symposium on Small Satellites for Earth Observation, IAA, Berlin, Germany, 2001.
221. V. Khayms, M. Martinez-Sanchez, Design of a miniaturized hall thruster for microsatellites, in: 32nd AIAA/ASME/SAE/ASEE Joint Propulsion Conference, Buena Vista FL, 1996 (AIAA Paper 96-3291).
222. Raitses Y, Fisch NJ. Phys Plasmas. 2001;8:2579.
223. Mikellides IG, et al. J Spacecraft Rockets. 2002;39(6):894.
224. VanGilder DB, Boyd ID, Keidar M. Particle simulation of a Hall thruster plume. J Spacecraft Rockets. 2000;37(1):129–136.
225. S. Pullins, R.A. Dressler, Y. Chiu, D.J. Levandier, Ion dynamics in hall effect and ion thrusters: Xe Xe symmetric charge transfer, in: 36th AIAA Joint Propulsion Conference, Huntsville, AL. 2000 (AIAA Paper 2000-0603).
226. Boyd ID. Review of hall thruster plume modeling. J Spacecraft Rockets. 2001;38:381–387.
227. L.B. King, A.D. Gallimore, 1996 (AIAA Paper 96-2712).
228. C.R. Phipps, J.R. Luke, G.G. McDuff, A diode-laser-driven microthruster, in: 27th International Conference on Electric Propulsion, Pasadena, CA, 2001, The Electric Rocket Propulsion Society, Worthington, OH, 2001 (Paper IEPC-01-220).
229. C.R. Phipps, J.R. Luke, G.G. McDuff, A Laser- Ablation-based micro-rocket, in: Proc. 33rd AIAA Plasmadynamics and Lasers Conference, Maui 2002, American Institute of Aeronautics and Astronautics, Washington, DC, 2002 (Paper AIAA 2002-2152).
230. Phipps CR, Luke JR, McDuff GG, Lippert T. Appl Phys. 2003;A77:193.
231. Itina TE, Marine W, Autric M. J Appl Phys. 1997;82(7):3536.
232. Franklin SR, Thareja RK. Appl Surf Sci. 2001;177:15.
233. Bird GA. Molecular Gas Dynamics and the Direct Simulation of Gas Flows Oxford: Clarendon Press; 1994.
234. Dalgarno A, McDowell MRC, Williams A. Proc Royal Soc Lond. 1958;250:411.
235. Boyd ID, Keidar M, McKeon W. J Spacecraft Rockets. 2000;37:399.
236. Sakabe S, Izawa Y. Simple formula for the cross sections of resonant charge transfer between atoms and their ions at low impact velocity. Phys Rev A General Phys. 1992;45(3):2086–2089.
237. Birdsall CK, Langdon AB. Plasma Physics via Computer Simulation Bristol, UK: Adam Hilger Press; 1991.
238. Lichtenwalner DJ, Auciello O, Dat R, Kingon AI. J Appl Phys. 1993;74:7497.
239. Kools JCS. J Appl Phys. 1993;74:6401.
240. Kusamoto D, Mikami K, Komurasaki K, Gallimore AD. Trans Japan Soc Aeron Space Sci. 1998;40:238.
241. Keidar M, Boyd ID, Beilis II. Electrical discharge in the Teflon cavity of a co-axial pulsed plasma thruster. IEEE Trans Plasma Sci. 2000;28:376–385.
242. Dalgarno A, McDowell MRC, Williams A. The modalities of ions in unlike gases. Proc Royal Soc Lond. 1958;250(April):411–425.
243. G.A. Popov, M.N. Kazeev, V.F. Kozlov, Two dimensional numerical simulation of co-axial APPT, in: 27th International Electric Propulsion Conference, Pasadena, CA, 2001 (IEPC paper 2001-159).
244. Brushlinskii KV, Morozov AI. Calculation of two-dimensional plasma flows in channels. In: New York, NY: Consultants Bureau; 1980;Leontovich MA, ed. Rev Plasma Physics. vol. 8.
245. Keidar M, Boyd ID, Antonsen EL, Spanjers GG. Electromagnetic effects in the near field plume exhaust of a micro-pulsed plasma thruster. J Propul Power. 2004;20(6):961–969.
246. G.G. Spanjers, K.A. McFall, F. Gulczinski III, R.A. Spores, in: Investigation of Propellant Inefficiencies in a Pulsed Plasma Thruster, 1996 (AIAA Paper 96-2723).
247. E.L. Antonsen, Herriott cell interferometry for pulsed plasma density measurements, MS Thesis, University of Illinois at Urbana-Champaign, 2001.
248. E. Antonsen, R. Burton, G.G. Spanjers, High resolution laser diagnostics in millimeter-scale micro pulsed plasma thrusters, in: 27th International Electric Propulsion Conference, Pasadena, CA, 2001 (IEPC paper 2001-157).
249. M. Keidar, I.D. Boyd, E.L. Antonsen, G.G. Spanjers, Progress in development of modeling capabilities for a micro-pulsed plasma thruster, in: 39th AIAA Joint Propulsion Conference, Huntsville, AL, 2003 (Paper AIAA-03-5166).
250. Keidar M, Boyd ID, Beilis II. Ionization and ablation phenomena in an ablative plasma accelerator. Journal of Applied Physics. 2004;96(10):5420–5428.
251. Keidar M. Anodic plasma in Hall thrusters. J Appl Phys. 2008;103:053309.
252. Beilis II. Modeling of a microscale short vacuum Arc for a space propulsion thruster. IEEE Trans Plasma Sci. 2008;36(5):2163–2166 Part 1.