
Plasma Medicine
7.1 Plasmas for biomedical applications
7.1.1 Introduction
Plasma medicine is an emerging field combining plasma physics and engineering, medicine, bioengineering to use plasmas for therapeutic applications.
Recent progress in atmospheric plasmas led to creation of cold plasmas with ion temperatures close to room temperature [1]. Cold nonthermal atmospheric plasmas can have tremendous applications in biomedical technology. In particular, plasma treatment can potentially offer a minimally invasive surgery that allows specific cell removal without influencing the whole tissue. Conventional laser surgery is based on thermal interaction and leads to accidental cell death, i.e., necrosis, and may cause permanent tissue damage. In contrast, nonthermal plasma interaction with tissue may allow specific cell removal without necrosis. These interactions include cell detachment without affecting cell viability, controllable cell death, etc. It can be also used for cosmetic methods of regenerating the reticular architecture of the dermis. The aim of plasma interaction with tissue is not to denature the tissue but rather to operate below the threshold of thermal damage and to induce chemically specific response or modification. Presence of the plasma can promote chemical reactions that would have the desired effect. Chemical reactions can be promoted by tuning the pressure, gas composition, and energy. Thus, it is important to find conditions that produce effect on tissue without thermal treatment. Overall plasma treatment offers advantages that were never considered in most advanced laser surgery [2]. Due to the myriad of potential applications for cold plasma in biomedical science, it is critical to understand the mechanism regulating the plasma interaction with tissue at the cellular and the molecular level.
It should be pointed out that earlier applications of plasma in medicine relied mainly on the thermal effects of plasma [3]. Heat and high temperature have been utilized in medicine for a long time for the purpose of tissue removal, sterilization, and cauterization [3]. One of the successful applications of thermal plasma is the argon plasma coagulation (APC) in which highly conductive plasma allows passing a current through the tissue [4]. APC is being used to cut tissue and, in particular, in endoscopic applications [5].
Stoffels et al. [2,6] studied the plasma needle and demonstrated the promising potential of the cold plasma in biomedical applications. It was concluded that plasma can interact with organic materials without causing thermal/electric damage to the surface, although this conclusion was not supported by direct measurements. In recent years, several new devices have been presented that were able to generate a cold plasma [7]. It is becoming clear that low-temperature plasmas will play an increasing role in biomedical applications. This understanding motivates development of a variety of reliable and user-friendly plasma sources. Plasma jets have to meet many requirements such as low-temperature, stable operation at atmospheric pressure, and no risk of arcing. Electrosurgical medical devices based on pulsed nonequilibrium plasma in saline solutions were developed [8]. Laroussi and Lu [9] described operation of a cold plasma plume using helium as carrier gas. They demonstrated that the plasma plume can be touched by bare hands and can come in contact with skin and dental gums without causing any heating or painful sensation. The device that later received the name “plasma pencil” was further characterized by Laroussi et al. [10]. A nonequilibrium plasma plume with lengths of 4 and 11 cm was generated by Lu et al. [11,12] Marriotti [13] shows that atmospheric plasma jets are highly nonequilibrium with strong departure between temperatures of electrons and heavy species. A similar plasma source was described by Kolb et al. [14]. They demonstrated that yeast grown on agar can be eradicated with a treatment lasting only a few seconds. Fridman et al. [3,15] demonstrated that cold plasmas can promote blood coagulation and tissue sterilization. It was shown previously that thermal plasma treatment is very beneficial in terms of blood coagulation and sterilization, but it induces significant damage. On the contrary, nonthermal plasmas can lead to the same result without any side effects associated with thermal plasmas [12,13]. It was demonstrated that plasmas efficiently eliminate a mix of “skin flora” [16]—a mix of bacteria collected from cadaver skin containing Staphylococcus, Streptococcus, and yeast. Sterilization under plasma treatment occurs in the experiments generally after 4 s of the treatment in most cases and 5–6 s in a few cases [13]. There is some controversy in the literature with respect to the mechanism of plasma–cell interaction. Some authors are of the opinion that ion species play the most important role in plasma–cell interactions by triggering intracellular biochemistry [17]. On the other hand, the same and other authors suggested that neutral species play the primary role in some plasma–cell interaction pathways [18]. It was suggested that various plasma effects are highly selective and that different species can have either “plasma killing” (such as O) or “plasma healing” (such as NO) effects [19]. The roles of other species such as O3 and OH are not clear.
Thus recent studies of cold atmospheric plasmas (CAPs) have shown great potential for the use in biomedical applications. Their distinguished physical and chemical properties are defined by the uniqueness of the nonthermal, nonequilibrium plasmas. Depending on their configuration, they can be used in the following areas: wound healing, skin diseases, hospital hygiene, sterilization, antifungal treatments, dental care, cosmetics targeted cell/tissue removal, and cancer treatments [19–23].
In addition, studies of the impact of cold plasma on cell motility have been conducted [24]. It was shown that cold plasma leads to decrease in the cell motility. This effect will be considered in detail in the next section.
Some limited research has been performed with respect to application of cold plasma for cancer therapy. These studies were limited to skin cells and only simple cell responses to the cold plasma treatment were reported [25,26]. It was shown that cold plasma treatment demonstrates a selective effect by causing apoptosis primarily in cancer cells. More recent work presents preliminary results on the in vivo treatment of U87 glioma-bearing mice [27]. It was demonstrated [22] that cold plasma treatment of U87-luc glioma tumor leads to a decrease of tumor bioluminescence intensity and tumor volume. It was demonstrated [21] that cold plasma application (a) selectively eradicates cancer cells in vitro a lesser effect on normal cells and (b) significantly reduces tumor size in vivo. It is shown that ROS metabolism and oxidative stress responsive genes are deregulated. The development of cold plasma tumor ablation has the potential to transform cancer treatment technologies by utilizing another state of matter.
In summary, cold plasma has demonstrated intriguing potential for cancer treatment. Further progress is associated with creating new devices that can enhance the established CAP effect and understanding the underlying mechanism of plasma action on cells.
The variety of different effects of plasma can be explained by their complex chemical composition and variations in the way that CAP is generated. CAP is a cocktail containing variety of reactive oxygen species (ROS), reactive nitrogen species (RNS), charge particles, UV, etc. This variety leads to the variety of effects mentioned above. In general, the CAP sources can be classified into three major groups according to the principal mechanism of generation and application:
a. Direct plasmas employ living tissue or organs as one of the electrodes, and thus, living tissue directly participates in the active discharge plasma processes. Some current may flow through living tissue in the form of small conduction current, displacement current, or both. Conduction current has to be limited to avoid any thermal effects or electrical stimulation of the muscles. The dielectric barrier discharges (DBD) are typical example of direct plasma sources as shown in Figure 7.1A [18].
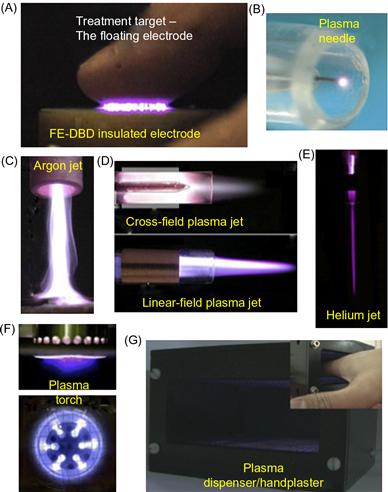
Figure 7.1 Plasma medicine devices. (A) Direct plasma device, (B–F) indirect plasma devices, (G) hybrid plasma device.
b. Indirect plasmas are produced between two electrodes and are then transported to the area of application entrained in a gas flow. There is a great variety of different configurations of indirect plasma sources exist in the size, type of gas, and power. They range from very narrow “plasma needles” to larger “plasma torches” as shown in Figure 7.1B–F [28,29].
c. Hybrid plasmas that combine the production technique of direct plasma with the current-free property of indirect plasma, which is achieved by introducing a grounded wire mesh electrode, which has much smaller electrical resistance than the skin—so that practically all the current passes through the wire mesh. One of the best examples is the plasma dispenser “HandPlaSter” (Max-Plank Institute, Germany) shown in Figure 7.1E [30].
7.1.2 Cold atmospheric plasmas
CAP is a newly developed technology that recently attracted a lot of attention because of their tremendous potential in the areas of nanotechnology, bioengineering, and medicine [24,31–35]. As an example, of CAP device we will consider atmospheric plasma jet that is widely used nowadays in biomedical applications.
The experimental data on atmospheric jet parameters are very scanty and overall understanding of phenomena involved is still lacking. Below we describe most recent efforts in understanding the physics of the CAPs.
The potential for new diagnostics of these plasma jets has been recently demonstrated by microwave scattering diagnostics of small size atmospheric plasmas, which has been successfully applied for laser-induced avalanche ionization in air, resonance-enhanced multiphoton ionization in argon, and CAP jet [36–38].
7.1.2.1 State of the art modeling of the cold plasma jets
The state of the art numerical modeling of CAPs for medical applications is mainly limited to the study of the “plasma needle” described by Stoffels [2]. The first numerical study of this device was performed by Brok et al. [39]. The device was studied using a time-dependent, 2D fluid model based on the diffusion equation. The code included air chemistry and modeled a large number of helium and nitrogen species. The code considered a wide range of chemical reactions, including excitations, ionization, disassociation, and recombination. To account for deviation from the Maxwellian distribution, the authors used a Boltzmann solver to tabulate the transport coefficients and reaction rates as a function of electron energy. Similar approach was taken by Sakiyama and Graves [40–42]. The authors also used a 2D fluid model implementing the fine element method in order to accurately capture the needle geometry. An even more limited set exists for codes utilizing a particle-based approach. One example of this approach is a work by Shi et al. [43]. Here the authors used the particle-in-cell method coupled with Monte Carlo collisions to model a pulse-induced discharge between two parallel plates. This model accounted for the avalanche ionization; however, air chemistry was neglected. Feasibility of particle-in-cell modeling was performed by Hong et al. [44] by comparison with fluid simulations. It was found that electron energy distribution is strongly nonequilibrium especially near the sheath region. Hybrid approach for the atmospheric pressure discharge was recently presented by Iza et al. [45]. Kinetic approach is used to simulate pulse-on phase of plasma while fluid approach is used to simulate multiple pulses. Only very recently models of the atmospheric plasma jets were developed [46]. A numerical study of ionization waves propagating through a circuitous capillary channel and impinging upon a target, in the context of remote delivery of plasma species for biomedical applications, has been conducted [47]. Unlike the plasma bullets in open configurations, the ionization wave fronts in the capillary channel are followed by an extended tail of high electron temperature and ionization up to several centimeters long [45].
7.1.2.2 Characterization of cold atmospheric plasma jet
The typical cold plasma jet device is shown schematically in Figure 7.2A. It is a Pyrex syringe through which a helium flow is supplied. The gun is equipped with a pair of high-voltage (HV) electrodes—a central electrode (which is isolated from direct contact with plasma by ceramics) and an outer ring electrode, as shown schematically in Figure 7.2A. The electrodes are connected to the HV resonant transformer (voltage U up to 10 kV, frequency ~30 kHz). A typical photograph of the plasma jet is shown in Figure 7.2B for U~5 kV and helium jet corresponding to the flow rate υfl=17 l/min without plasma (measured at U=0). The visible well-collimated plasma jet has a typical length of ~5 cm. The length of the plasma jet varied with gas flow. In particular, the increasing of the helium feeding results in jet elongation, while further increase in the flow rate caused jet shortening and appearance of a turbulent tail at the jet’s end. Maximal plasma jet length was observed at conditions presented in Figure 7.2A. The increase in the HV amplitude applied to the electrodes resulted in increase in plasma jet intensity but did not affect the plasma jet diameter.

Figure 7.2 (A) Schematic presentation of experimental setup and (B) typical image of plasma jet for U=3.8 kV. Source: Reprinted with permission from [118]. Copyright (2010) by American Institute of Physics.
In the following, we describe experimental technique that was developed recently to study CAP jets.
The microwave scattering on the plasma jet was studied to resolve the temporal evolution of plasma density in the jet [48]. The experimental microwave system is schematically presented in Section 2.16. Two microwave horns with centers of exit sections located at (x,y,z)=(6 cm,0,0) and (0,15 cm,0) were used for radiation and detection of microwave signal. Microwave radiation was linearly polarized along the z-axis (12.6 GHz).
The output signal of the microwave system can be written as follows for the case of dielectric and conducting scatterers:
![]() (7.1)
(7.1)
The coefficient A was determined to be ~11 V×W/cm [31] using the dielectric scatterers made of Teflon (e=2.1), alumina (e=9.2), polyethylene (e=2.25), and quartz (e=3.8) [49–51]. Then, plasma conductivity and plasmas were determined based on Eq. (7.1), known coefficient A, and plasma volume. The temporal evolutions of average plasma density are shown on Figure 2.17 for two driven voltage amplitudes, 2.7 and 3.8 kV. It was observed that after discharge initiation, the plasma density reaches ~5–10×1013 cm−3 and then decays with characteristic times of few ms governed by electron attachment. The second peak of plasma density appears with a certain delay after decay of the first discharge (~1 ms for UHV=2.7 kV) and indicates the presence of the second breakdown event. This additional ionization of the channel can be provided by ongoing increase of discharge driver voltage (see voltage waveform in Figure 2.17).
A typical microwave scattering signal from the jet, ICCD images of the jet (taken at times indicated by the rectangular bars, exposition time=500 ns, the plasma bullet is moving down), the jet (Ij), and discharge (Id) currents are all shown in Figure 7.3 (t=0 is chosen at the moment of zero voltage as shown in Figure 7.3A and C). The ICCD images in Figure 7.3B(a and b) indicate that intensively radiating “plasma bullets” were ejected from the syringe. They had velocities of ~2×106 cm/s and existed for ~2 ms (from t~1 ms up to t~3 ms) as indicated in Figure 7.3A and C by the red bar. Such high velocities of “plasma bullets” can be explained by a streamer model, which we will invoke here following previous works [31]. If in fact a streamer model is applicable, the ICCD photos in Figure 7.3B (a and b) are images of the propagation of a positively charged head of streamer photoionizing the gas in front of it and causing avalanche directed toward the head.

Figure 7.3 (A) Scattering signal from the jet and voltage waveform. Gray bars a, b, and c indicate time windows, when ICCD images were taken. (B) ICCD images of jet at a, b, and c: “plasma bullet” velocity is ~2×106 cm/s. (C) Discharge and jet currents at different z positions. Red bar indicates time when streamer exists. During this time, the first peak in scattering signal and Id peak were observed. Blue bar indicates time after streamer passing when signals from plasma were registered. Scattering signal and jet current indicate the presence of the afterglow plasma column with a characteristic decay time of ~3–5 µs. Source: Reprinted with permission from [119]. Copyright (2009) by American Institute of Physics.
The microwave scattering signal (see Figure 7.3A) consists of two sequential peaks. The first peak occurs at the same time that the ICCD camera registered the presence of the streamer. Note that the first peak starts even before the head comes out from the syringe, and this may be caused by the electron avalanche developing in front of the streamer head or by scattering from the plasma in the syringe. The second peak on the microwave scattering signal (indicated by blue bar in Figure 7.3A) and image (c) in Figure 7.3B (integrated over 100 shots of 500 ns exposition time each)) was registered after the streamer had already gone. Thus we may conclude that an afterglow plasma column remains after streamer passing, having a decay time of ~3–5 ms. This fast decay of the column plasma may be explained by three body and dissociative attachment of electrons to oxygen molecules present in ambient air.
Streamers observed by high-speed cameras in atmospheric jets (see Figure 7.3) were characterized by a new method of stopping (“scattering”) by means of external DC potential [52]. Interaction of the streamer with the DC potential created by the ring located at z=3 cm and dependence of streamer length L as a function of the ring potential Ur are shown in Figure 7.4. One can see that application of higher positive potential to the ring electrode led to significant perturbation of the streamer propagation, namely to shortening of the streamer. Basing on this experimental evidence, the term “streamer scattering on the external DC potential” was introduced to denote this interaction.

Figure 7.4 Interaction (scattering) of the streamer on the DC potential created by the ring located at z=3 cm and dependence of streamer length L vs. ring potential Ur (exposure window t=2–7 ms, UHV=3.1 kV). Source: Reprinted with permission from [52]. Copyright (2012) by Institute of Physics.
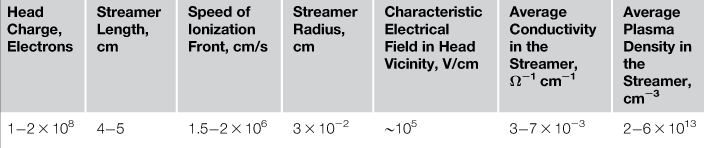
As the electric field around the streamer head is governed by difference Uh−Ur, where Uh is potential of streamer head, one can consider the condition Ur=Uh as sufficient to stop propagation of the streamer [50,53]. Figure 7.5 presents the temporal evolution of streamer head potential Uh(t) for the amplitude of driven high voltages UHV=2.6, 3.1, and 3.8 kV, superimposed with the temporal evolution of voltage applied to the discharge electrodes. The discharge current is also shown. It can be seen that in all cases, Uh was close to the voltage applied to the electrodes (within 10–15%) and followed its temporal evolution. Thus, the experimental evidence does not support the model of the electrically insulated streamer head. On the contrary, the experiment indicates that the electrode potential is transferred to the streamer head along the streamer column to which it is attached with no significant voltage drop. Measurement of the streamer head potential allow to determine number of key streamer properties such as head charge (1–2×10⁸ electrons), electrical field in the head vicinity (~100 kV/cm), average conductivity (3–7×10⁻³ W−1 cm−1), and plasma density of the streamer column (2–6×1013 cm−3). All measured parameters are listed in Table 7.1.

Figure 7.5 Temporal evolution of discharge current (green), discharge voltage (blue) and streamer head potential (red) for UHV=2.6, 3.1, and 3.8. Potential of streamer head is close to potential of central electrode and following its temporal behavior in all cases. This indicates that voltage drops potential of central electrode is transferred to the streamer head without significant drops. Source: Reprinted with permission from [52]. Copyright (2012) by Institute of Physics.
In addition to measurement techniques presented in this section, optical emission spectroscopy (OES) is also widely used for characterization of the atmospheric pressure plasmas. Plasma composition and temperature at various modes (translational, rotational, vibrational) can be measured using this technique. Composition of the CAP jet is shown in Figure 2.13.
7.2 Cold plasma interaction with cells
Among others, CAP treatment leads to modification in cell migration as will be described below. In particular, these results suggest that by controlling cell migration, it is possible to stabilize wounds. As an immediate consequence, this would lead to mitigation of tissue damage after injury. It should be pointed out that wound healing can be delayed in the elderly and in patients with diabetes. These delays can be due to problems with any or all of the three phases of wound healing cited above. Ulcers form when wound healing is impaired and can lead to amputation and loss of life if not treated. Delayed reepithelialization or poorly adherent epithelial tissue fails to provide the needed barrier and contributes to delayed healing. Persistent inflammation in the wound bed will also cause delayed healing. Finally, poor reestablishment of circulation caused by delayed angiogenesis also causes challenges to wound healing, particularly in diabetics and the elderly. Paradoxically, some patients, particularly young adults, have robust wound healing responses which also results in complications. When wound healing takes place too quickly, reduced epithelial stability and increased scar formation result. If the epithelial barrier is not tightly adhere to the underlying connective tissue, the newly formed epithelial sheet over the wound site will rip off due to scratching and/or normal wear and tear, and the adjacent epithelial cells will have to initiate reepithelialization once again. This exposes the underlying tissue once again to microbes and increases the risks of infection. Scars are thick disordered accumulations of collagen and connective tissue elements produced by the fibroblasts during the proliferative phase of wound healing. During the remodeling stage of healing, these scars have to be remodeled to allow proper regrowth of nerves and blood vessels. Remodeling involves the selective secretion of proteases that degrade collagen. Excessive scar formation is more than just a cosmetic problem. It can slow down recovery by preventing angiogenesis and the regrowth of nerves. However, for injuries to exposed sites on the face, scar formation is indeed a serious cosmetic concern [54]. Proper treatment of traumatic and chronic injuries demands that we monitor the healing process in each patient and step in to apply treatments to enhance healing when it is delayed or to slow it down when it is taking place too rapidly. Thus cell migration reduction triggered by the cold plasma treatment becomes very important. While treatments are available for the purpose of improving wound healing, more are needed. Although several recent studies have begun to sort out the cellular and subcellular events altered when cold plasmas interact with living cells, these studies have yet to address the dose–response (the relationship between duration of plasma jet interaction with living tissue and a change in the migration rates) and permanency of the migration effects induced in cells by cold plasmas.
In addition, migration of the tissue cells plays an important role in many physiological and pathological processes, including embryonic development, angiogenesis, and the metastasis of tumor cells. The migration of the cells based on the interaction (mechanical, electrical, and chemical) between the cell adhesion receptors and the extracellular matrix. The most important family of cell adhesion proteins are integrins. As their name suggests, integrins are cell adhesion receptors that integrate signals received from the extracellular matrix with intracellular elements of the cytoskeleton to regulate mechanical signal transduction. In so doing, integrins function to maintain cell adhesion, tissue integrity, cell migration, and differentiation [21,55]. These issues will be discussed in the following sections.
7.2.1 Cell migration
Cell migration is a broad term that describes those processes that involve the translation of cells from one location to another. This may occur on glass/plastic (common in vitro setups), or within complex, multicellular organisms. Cells migrate in response to multiple situations they encounter during their lives. Some examples include morphogenetic events that require the mobilization of precursors to generate new structures/layers/organs, sometimes at distant locations (during embryogenesis, organogenesis, and regeneration); or the presence of environment cues that inform the cells of the need for their movement to accomplish a larger goal (e.g., wound healing or the immune response).
There are different modes of cell migration depending on the cell type and the context in which it is migrating. Cells can move as single entities, and the specifics of their motility depend on several factors, e.g., adhesion strength and the type of substratum (including extracellular matrix ligands and other cells), external migratory signals and cues, mechanical pliability, dimensionality, and the organization of the cellular cytoskeleton. Cell migration can be characterized by velocity, which is the measure of speed at which cells change their location.
The unique chemical and physical properties of CAPs enable their numerous recent applications in biomedicine [56]. A wide range of cold plasmas applications have been investigated including sterilization, the preparation of polymer materials for medical procedures, wound healing, tissue or cellular removal, and dental drills [35,57]. One of the recent research trends is the investigation of CAPs interaction with living tissue at the cellular level [58–60]. Initial experiments on direct interaction of cold plasmas with living cells demonstrated immediate detachment of treated cells from the extracellular matrix [58]. Later it was demonstrated that cell detachment occurs for several different cell types including primary mouse fibroblast cells, PAM212 (skin) cancer cells, and BEL-7402 liver cancer cells [58]. The effects of mild intensity and short duration cold plasma treatment below the threshold required for cell detachment have also been studied [61]. It was observed that the migration rate of primary mouse fibroblast cells slowed significantly after mild intensity plasma treatment [61]. It was found that integrin expression at the cell surface reduced at plasma treatment. Integrins (transmembrane proteins) are cell adhesion receptors having dual function: intracellular (integrin occupancy coordinates the assembly of cytoskeletal filaments and signaling complexes) and extracellular (engaging either extracellular matrix macromolecules or counter receptors on adjacent cell surfaces). Integrins function in maintaining cell adhesion, tissue integrity, cell migration, and differentiation [55,62,63].
The interaction of the CAP with a living tissue was examined on fibroblast cells and PAM212 cells (mouse squamous carcinoma cells) [64]. Uniform densities of cells in culture were grown on the surfaces of six-well tissue culture dishes using the methodology described in Ref. [65]. The schematic of the treatment is shown in Figure 7.6.

Figure 7.6 CAP jet treatment of the living tissue. The distance between nozzle and plate bottom was of around ~20 mm during all treatment. The cell culture was placed on the heating plate to maintain the liquid media temperature ~37°C. Inset shows schematics of media and cells in the vicinity of CAP action.
Experiments were conducted with different volumes of media covering the cell. Immediately following the plasma jet treatment time-lapse cell migration analysis was performed. Cells were maintained in normal cell culture media containing serum at 36°C and 5% CO2. Cell velocity distributions were built and analyzed using SAS software [66].
Interaction of CAP jet with cells leads to media displacement away from the point of contact of jet with cells, and for the duration of treatment, the cells were not covered by media as shown in Figure 7.6. Immediately after jet interruption, the media flowed over the cells. Three distinct regions were observed as shown in Figure 7.7. Region 1 is the zone which stayed uncovered during the treatment where the cells were subject to desiccation and after the treatment was occupied by immovable or “frozen” dead cells. Second region is the area which remains covered with a media at all times. This region was filled up with migrating alive cells. A third region which was at the interface between the two areas with alive and dead cells contained voids with no cells. Images taken in the center of region with frozen cells at r=0 and at the edge r=rd are shown in Figure 7.7A and B immediately after 30 s treatment with plasma jet demonstrating all three regions. Note that no voids or frozen cells were found after treatment of the cell culture with He flow only without plasma at the same conditions as that on Figure 7.7C and D. After treatment with He flow without plasma, no voids were found in the cell culture as shown in Figure 7.7D.

Figure 7.7 Photographs of the fibroblast cell culture immediately after treatment: (A) and (B) with CAP jet at the central point r=0 (A) and at the edge between the areas with alive and dead cells r=3 mm (B); (C) and (D) with He flow only. Source: Reprinted with permission from [24]. Copyright (2008) by American Institute of Physics.
Alive cells tracks are shown in Figure 7.8. These observations led to the conclusion that untreated cells display higher mobility.

Figure 7.8 Cell tracks (in red) after 16 h of migration: treated (with plasma jet) cells and untreated cells.
The velocity of cells treated with these conditions was compared to that of untreated cells and cells treated with helium only (80 cells were tracked in each case) The velocity distributions are presented in Figure 7.9 (velocities are normalized to the average velocity of untreated cells). The cell velocity distribution after treatment with helium (no plasma) coincides well with the distribution exhibited by untreated cells. Treating with the plasma jet decreased the average cell migration rate and standard deviation by a factor of ~2 in comparison with both untreated cells and cells treated with helium (no plasma).
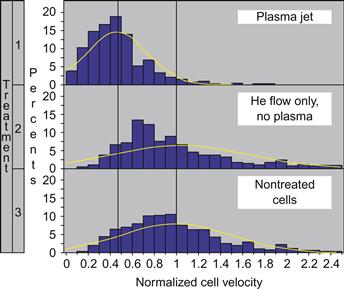
Figure 7.9 Velocity distribution functions for fibroblast cells treated with (1) plasma, (2) He flow only, and (3) nontreated cells. Source: Reprinted with permission from [24]. Copyright (2008) by American Institute of Physics.
The migration of cells within tissues plays an important role in many physiological and pathological processes, including embryonic development, wound repair, angiogenesis, and the metastasis. Various signaling pathways control these processes. Integrins are a major family of metazoan cell-surface-adhesion receptors playing a key role in the signaling and mechanotransduction (i.e., conversion mechanical stimulus into the chemical activity) mechanisms. Their functions include maintaining cell adhesion, tissue integrity, cell migration, and differentiation. Integrins consists of two noncovalently associated subunits α and β subunits, each of which is a single-pass type I transmembrane protein. There are 24 types of α subunits and 8 types of β subunits. However, not all αβ combinations exist, only 24 are possible as shown in Figure 7.10 [67–69].

Figure 7.10 (A) Structure and functions of integrins [57]. (B and C) WTDF 3° (wild-type dermal fibroblast tertiary passage) cells were stained against vinculin (focal adhesions, red) and actin filaments (cytoskeleton, green).
An integrin expression study was performed in order to understand the effects of the plasma jet on fibroblast cells migration. Fibroblast cells 4 days after being placed in cell culture were used. Treatment with plasma jets consisted of consecutive exposure of seven adjacent positions. Each position was exposed to the plasma jet for 5 min, while the thickness of protecting media was kept ~2 mm during the entire treatment. Cells whose surface integrins were stained with the β1-integrins-PE-conjugated antibody expressed about two orders of magnitude higher fluorescence response—Iβ1=440. This increase of fluorescence intensity is caused by fluorescence of antibodies bound to the β1-integrins on the cell surface. Similar as above, stained cells had a higher Iβ1 of 310. However, their mean fluorescence intensity was significantly less (~30%) than that for untreated cells (440). The histograms summarizing change of average fluorescence responses after cell treatment and their deviations are presented in Figure 7.11. To summarize, we observed that treatment of cells with the plasma jet resulted in a decrease of cell fluorescence responses: 25% and 10% for staining of β1 and αv-integrins, respectively. This clearly indicates that plasma treatment reduces expression of β1 and αv surface integrins. This suggests that one of the elementary cell components being affected by plasma treatment are surface integrins. Because surface integrins are responsible for cell adhesion and mediate cell migration, changes in integrin expression may be responsible for the effects observed experimentally, including the decrease in migration rate and cell detachment after plasma jet treatment.

Figure 7.11 Average fluorescence treated with plasma cells (stained with β1- and αv-integrins PE-conjugated antibodies) and treated with He only cells (stained with β1-integrins antibody) normalized to fluorescence of untreated cells stained with corresponding antibody. Source: Reprinted with permission from [60]. Copyright Wiley-VCH Verlag GmbH & Co. KGaA.
In addition, it is important to determine the region that is affected by CAP during the treatment, i.e., to determine how localized CAP treatment could be [70]. A schematic diagram indicating how these treatments were made is shown in Figure 7.12A. Controls included cells treated with helium alone for the same times. Cells were treated with plasma immediately after plasma treatment with trypan blue. It was shown previously that plasma treatments can cause cell death as assessed using trypan blue. Trypan blue is a vital dye that is excluded from entering live cells; dead cells fill with the blue dye. Data shown in Figure 7.12B for cells treated with plasma or helium alone for the times tested indicate that trypan blue is excluded from cells and therefore these treatment times do not cause cell death.
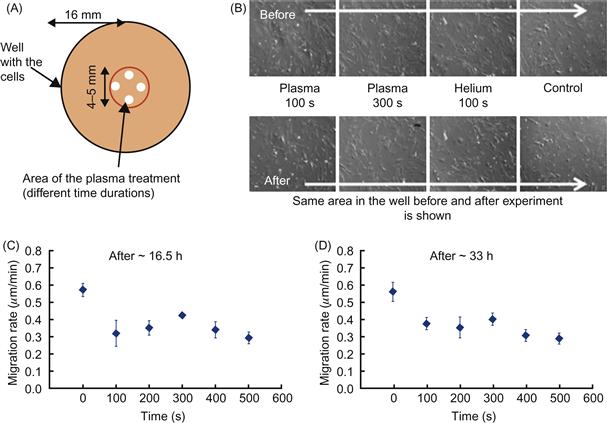
Figure 7.12 Reduction of the cell migration in WTDF 3. Temporal dynamics. (A) Schematic representation of the experiment is shown: reduction in migration rates dependence on the duration of the plasma treatment. Four points were taken inside the treated area and 40 cells analyzed. (B) “Alive-vs.-dead” testing of the treated cells with trypan blue stain with the same area in the well analyzed before and after treatment. Cell migration rates for ~0–16.5 h (C) and ~16.5–33 h (D) after treatment as function of treatment duration. Error bars indicate the standard deviations of data points.
When cell migration is assessed as a function of the duration of plasma treatment, it was found (as shown in Figure 7.12C) that 100 s significantly reduced cell migration rates when assessed from 0 to 16.5 h after plasma treatment. Treatment times up to 500 s did not further reduce cell migration significantly when assessed between 0 and 16.5 h; however, when migration rates were assessed between 16.5 and 33 h (see Figure 7.12D), it was found that 100 s significantly reduced cell migration rates.
In order to address the effect of plasma treatment on pH-level of media, treatments of media at standard experimental conditions described above was performed. One of the components of cell culture media is the acid–base indicator phenol red. At acidic pH, the color of phenol red is yellow; at basic pH, phenol red is pink, and at neutral pH, phenol red is red/orange. These features of phenol red, along with its lack of toxicity, make it an excellent indicator of pH in cell culture media. No change of media color was observed after the 60, 120, and 200 s treatments of media (data not shown) indicating that pH-level of media remained unchanged at plasma treatment.
The ability of CAP treatment to impact cell migration was further considered by evaluating cell migration rates as a function of the distance from the plasma-treated zone. A schematic of the experiment is shown in Figure 7.13A. Three locations of interest were considered: inside the plasma-treated area (red circle indicates the treated area, diameter of around 5 mm) and further equidistant at second and third locations outside, each location between two neighbor points was ~3–4 mm apart. The average velocity of 10 cells per each tracked location was calculated after 16.5 h. To increase the statistical significance of the results, data were taken symmetrically in six different locations thus giving 20 cells per point of interest. Experiments were repeated several times with various treatment times of 100 and 300 s. Thus, overall ~60 cells per each location were analyzed. Figure 7.13B shows spatial distribution of migration rates after 100 s of plasma treatment (data shown for 20 cells at each point after 16.5 h of tracking). Both the only helium and control velocity distributions do not show any significant changes. However, plasma-treated cells showed a localized reduction in their migration rates of around 30–40%. The standard deviation is indicated with vertical bars at the data points; it does not exceed 5%.

Figure 7.13 Localization of the cold plasma effect on the cell migration. (A) The experimental setup for spatial distribution of the cell migration rates for single well is shown. (B–D) The dependence of cell migration rates vs. distance from the center of treated zone: for cells tracked during 0–16.5 h after 100 and 300 s plasma treatment, respectively (B and C), for cells tracked during 16.5–33 h after 300 s plasma treatment (D). Cells treated with plasma, with helium only, and untreated cells are shown. Data is given with standard deviations. The reduction in migration rate is around 30% in the treated area after ~16.5 h (B and C), this trend remains after ~33 h (D) of cell tracking.
Spatial characteristics of the effect in cell migration induced by the plasmas treatment are shown in Figure 7.13B and C for cells tracked between 0 and 16.5 h after treatment (cells treated during 100 and 300 s) and in Figure 7.13D for cells tracked between 16.5 and 33 h after treatment (time duration of treatment 300 s).
Again for controlling purpose, the only helium treated cells and untreated cells are shown. Figure 7.13B and C shows that cells treated with plasma (100 and 300 s) have slowest migration rates in the treated area (~1 mm from center of the plate), while cells outside the treated area (5 and 8 mm from the center) migrate at the same rates as untreated cells. Also no reduction of cells migration was observed in the cells treated with the only helium. It was observed that reduction (around 30%) in cell migration is persistent for 33 h (see Figure 7.13D).
In conclusion, the reduction of the rates of the cells migration can be related to the changes in the integrin expression whose functions are related to cell motility and cell adhesions. In the following section, we present more detailed analysis of this effect.
7.2.2 Integrin activation by a CAP jet
Despite the progress made in studying of CAP interaction with the living tissue described above, questions remain. What causes the motility and cell adhesion to change in response to plasma treatment? [71].
The goal of this section is to understand the mechanism by which the CAP jet alters cell migration and influences adhesion [72]. Although the main focus here is on the study of the interaction between the CAP jet and fibroblasts, we also present data comparing fibroblast responses to those of epithelial cells.
Wild-type tertiary mouse fibroblast cells (WTDF) were cultured in the Dulbecco’s Modified Eagle Medium (DMEM; Invitrogen Corp., Carlsbad, CA) enriched with 5% serum, 1% NEAA, 1% L-glutamine, and 1% Pen-Strep. Diluted cells (30% confluence) were plated in multiwell plates or double-well glass slides and treated with plasma on the third day in culture. Human corneal limbal epithelial cell line (HCLE, Dr. Ilene Gipson, Harvard Medical School and described in Ref. [73]) was grown in HCLE medium (500 ml Keratinocyte Serum Free Medium with added 1.2 ml Bovine Pituitary Supplement, 4 μl epidermal growth factor, 0.17 mM CaCl2 and 5 ml Pen-Strep, Invitrogen Corp., Carlsbad, CA). HCLE cells were used on the second day of culture with confluence of around 30–40%. During plasma treatment, plates with cells were kept on a heating plate (Boekel Scientific, model 240000, Feasterville, PA) to maintain the media temperature at 37°C. Serum starvation experiments were performed on WTDF 3 cells and placing the cells in DMEM media with 1% serum ~24 h before the plasma treatment. For studies using MnCl2 to activate integrins, 0.5 mM MnCl2 was added to DMEM with 5% serum immediately after cells were subjected to cold plasma treatment.
Some cold plasma treatments were conducted on cells that had been placed in plates precoated with extracellular matrix proteins. Fibroblasts were placed onto plates precoated with either 10 mg/ml fibronectin (BD Bioscience, Pasadena, CA, cat#354008)/1% collagen type I (Advanced BioMatrix, San Diego, CA, Part#5005) or 10 ug/ml vitronectin (BD Bioscience, cat#354238). Plasma treatment was performed 8 h after replating.
In the described studies, dermal fibroblasts and epithelial cells were prepared and equivalent numbers plated onto culture plastic (for time-lapse studies) or glass slide (for immunostaining) and maintained at DMEM medium supplemented with 5% serum (fibroblasts) or HCLE medium (epithelial cells). Fresh media or fresh media with the MnCl2 was added to cells following plasma treatment.
For experiments involving immunofluorescent staining of cells, cells were plated onto two well glass chamber slides for 24 h prior to CAP treatment. For cold plasma treatment, chamber slides containing cells were placed on the heating plate to maintain the temperature and treated with cold plasma as described above. Fresh media was added and cells returned to the 37°C CO2 incubator for 3 h. Media was discarded and cells fixed in 4% paraformaldehyde (Prod#28908, Thermo Scientific, Rockford, IL) in PBS for 10 min and then rinsed in PBS. Nonspecific staining of cells was blocked by incubating the cells for 15 min in blocking buffer (1% Bovine Serum Albumin (BSA) in 1X PBS). Cells were incubated in the appropriate dilution of each of the primary antibodies below for 1 h, followed by washing (15 min in PBS) and incubation in secondary antibodies. When the primary antibodies used were generated in different species, cells were stained with multiple antibodies simultaneously. For studies of active and total surface integrins, cells were used for immunostaining without permeabilization. However, for studies of vinculin, and the αv receptor within focal adhesions, cells were permeabilized by incubating in 0.1% triton-×100 for 10 min and then incubated in PBS. Permeabilization is needed because vinculin is an intracellular protein and antibodies to detect it cannot penetrate the cell unless it is permeabilized. Total β1 integrin was detected with the hamster-derived CD 29 monoclonal antibody clone Ha2/5 (BD Bioscience, cat#555004) at a dilution of 1:200. For activated β1 integrin, the rat-derived monoclonal antibody against activate CD 29, clone 9EG7 (BD Bioscience, cat#553715), was used at a dilution of 1:200. αv integrin was visualized using the rat-derived monoclonal antibody against CD 51 RMV7 (BD Bioscience, cat#552299) at a dilution of 1:200. Focal adhesions were visualized by staining for the focal adhesion protein vinculin using the mouse-derived monoclonal antibody clone VIIF9 (7F9) at a dilution of 1:200 (cat#MAB3574, Chemicon Int., Temecula, CA). Nuclei were visualized using DAPI, dilution 1:2000 (D21490; Invitrogen Corp., Carlsbad, CA). Images were acquired at 20× magnification using a Nikon Fluorescent microscope equipped with a RT-Slider SPOT Camera (Melville, NY).
7.2.2.1 Dermal fibroblasts and human corneal epithelial cells reduce their migration in response to CAP
While it was described above that dermal fibroblasts migrate slower after CAP treatment, a difference between behavior of cell type will be described in this section. Presented in Figure 7.14A are relief-contrast images of the tracks taken (red lines) by migrating fibroblasts (WTDF 3) and epithelial (HCLE) cells with and without CAP treatment over a 16 h and 40 min time period.

Figure 7.14 Temporal dynamics of the cells in response to CAP treatment. (A) Relief-contrast images of the WTDF 3 and HCLE cells with their tracks: control (no plasma treatment), plasma (WTDF 3–60 s, HCLE ~100 s). (B and C) The data is shown for ~16.5 h of tracking. Error bars indicate the standard error of mean for the presented data. At least ~80 cells were analyzed per each time point. The migration rates and the persistence of the cells are assessed as a function of the plasma treatment time: fibroblast cells are shown in blue and epithelial cells in red. Source: Reprinted with permission from [72]. Copyright (2012) by Institute of Physics.
The tracks of the cells after plasma treatment (fibroblast cells were treated for ~60 s, epithelial cells for ~100 s) are significantly shorter than untreated cells (control). Additional experiments were conducted to assess the impact of increasing plasma treatment times on cell migration rates of fibroblasts and epithelial cells, i.e., to determine the threshold of treatment (threshold here is determined as the treatment dose (duration of the treatment) after which the change becomes statistically nonsignificant (i.e., P>0.05 between two neighbor points) and no other change occurs). In Figure 7.14B, cell migration rates are shown as a function of the duration of CAP treatment. Fibroblasts show a maximum drop in the migration rate at ~40 s; increasing treatment times ranging from 40 to 200 s do not alter cell migration rates. The impact of CAP on the migration of epithelial cells is more graded; migration rates of epithelial cells decrease with increasing treatment times from 10 to 100 s; treatment times between 100 and 200 s do not alter epithelial cell migration rates. The decrease in cell migration rates for both cell types is ~30–40%. It was shown early that helium treatment only does not affect the cell migration without additional conditions such as serum starvation or MnCl2 activation. Figure 7.14C shows the persistence of the cell motion as a function of the duration of the plasma treatment. The persistence was measured as the ratio between displacement in a particular direction and the total displacements and, thus, represents the directionality of the cells motion. Neither fibroblasts nor corneal epithelial cells show significant changes in persistence as a function of increasing plasma treatment time.
7.2.2.2 Activating fibroblast integrins reduces their response to CAP
One of the possible reasons for the decrease in cell migration rate after CAP treatment is the activation of integrins on cell surfaces. Integrins can be activated by adding MnCl2 to their media [74]. This treatment shifts the integrins from a folded state to an unfolded state exposing their ligand binding sites. Serum starvation of fibroblasts increases their spreading which induces activation of α5β1 integrin [75]. Figure 7.15A shows the migration rates of fibroblasts under control (not treated, only helium treated for 100 s) and CAP treatment (100 s) followed by incubation in standard media, media supplemented with MnCl2, and low serum media. In the case of no additional treatment, we found a 30–40% drop in the migration rates of the cells as expected. However, under conditions where integrins were activated, no change in migration rate was observed after CAP treatment. The decrease of cell migration rates for all three conditions is 30–40% of the optimal cell migration rate. These data suggest that CAP treatment activates integrins on cell surfaces.

Figure 7.15 Integrin activation of the fibroblasts reduces their response to CAP. (A) The migration rates of the fibroblast cells controls (no CAP treatment and treated with helium only) and cells treated with plasma for ~100 s are shown under different conditions: blue—no additional pretreatments, red—treated with MnCl2 and green—serum-starved cells. Data is shown for ~16.5 h of tracking. (B) The migration rates (μm/min) and persistence of the cells motion (a.u.) of the WTDF 3 cells control (blue)—no plasma treatment and cells treated with plasma for ~100 s (red) plated on a different precoated surfaces: no precoating, precoated with fibronectin/collagen type I and with vitronectin. The data are shown for the first 6 h of the cell tracking. The standard error of mean is shown with error bars. At least ~80 cells were analyzed per each conditional change. Double asterisk stands for the P<0.001 and single asterisk for P<0.01, otherwise there are no statistical significant difference in the data. Source: Reprinted with permission from [72]. Copyright (2012) by Institute of Physics.
Plating cells onto surfaces coated with integrin ligands activates integrins engaged by those ligands. β1 family integrins bind to fibronectin (FN) and collagen (CN), whereas αv-family integrins bind to vitronectin (VN). Next we assess whether plating cells onto FN/CNI- or VN-coated surfaces impacts their ability to respond to CAP. In Figure 7.15B, cell migration rates and persistence of migration for fibroblasts plated on uncoated surfaces and surfaces precoated with FN/CNI or VN are shown for untreated and for CAP (100 s) treated cells. Data are shown for just the first 6 h of cell tracking, i.e., right after cells were adhered to the surface. There are no significant differences in cell migration rates between cells plated onto uncoated compared to FN/CNI- and VN-coated surfaces for the control cells (P>0.05). In addition, precoating surfaces with FN/CNI or VN did not alter their response to plasma treatment and a drop of ~30% in cell migration rate was seen for the three conditions studied. Statistical analyses of these data showed that there is greater statistical significance (P<0.001) for fibroblasts plated on the uncoated surface rather than on the surface precoated with FN/CNI or VN (P<0.01). No significant changes were found in the persistence of the cells motion. Note also that helium alone does not affect the cell migration [72].
7.2.2.3 Integrins activation by CAP
It was shown above that integrin activation by MnCl2 and starvation attenuates the response of cells to CAP, but adhering cells to specific integrin ligands had no impact on cells ability to respond to CAP. To study directly the impact of CAP on integrin activation, control cells and cells treated with CAP were fixed and used for immunofluorescence studies without permeabilization to assess the ratio of activated to total β1 integrin on their surface. The method requires the use of an antibody that recognizes total β1 integrin regardless of conformation (Ha2/5) and another that recognizes only the active conformation of the β1 integrin (9EG7). Figure 7.16 shows the results of immunofluorescence studies to assess the activation state of the β1 integrin in the CAP treated fibroblasts. Untreated cells (control), cells treated with MnCl2 only, CAP (100 s) treated cells, and cells treated with plasma (100 s) and MnCl2 are shown in Figure 7.16A; Figure 7.16B shows an enlargement of the image shown in Figure 7.16A. Data show that activated β1 integrin is present at significantly higher amounts in cells treated with MnCl2, CAP, and both CAP and MnCl2 confirming that β1 integrin is activated by CAP treatment (see Figure 7.16C).

Figure 7.16 Activation of the β1 integrin with CAP. The immunofluorescence images of the fibroblast cells with different scales are shown: control (no treatments), control+MnCl2 (treated with only MnCl2), plasma (treated with CAP 100 s), plasma+MnCl2 (treated with both plasma 100 s and MnCl2). Total β1 integrin are shown in green, activated β1 (clone 9EG7)—in red and nuclei in blue. (A) Images were taken with the magnification 20×. Cells enlarged in Figure 3.3B are marked with the white asterisk. (B) Enlarged typical cells are shown. White arrows indicate the increase of the activated β1 integrin. (C) The data represents the ratio of 9EG7 and total β1 integrin for the peripheral part of the cells; error bars stand for with the standard error of mean, ~20 cells were analyzed per each conditional change. The double asterisk shows the statistical significance (P<0.001) in the increase of the intensity of the 9EG7 over the total β1 in the cells treated with MnCl2, plasma, or both. Source: Reprinted with permission from [72]. Copyright (2012) by Institute of Physics.
7.2.2.4 Focal adhesion of treated cells
Activated integrins accumulated within focal adhesions increasing their size and reducing cell migration rates. To determine whether focal adhesions of CAP treated cells were indeed larger, control cells and cells treated with CAP were fixed, permeabilized, and used for immunofluorescence to detect the presence of vinculin as well as αv integrin within focal adhesions. The data are presented in Figure 7.17A and quantified in Figure 7.17B. Vinculin is a focal adhesion protein and the amount of the protein engaged into the focal adhesion is proportional to the size of the focal adhesion [76]. Thus the intensity of the fluorescence antibody will be proportional to the size of the focal adhesion. CAP treated cells, cells treated with MnCl2 only, or cells treated with both CAP and MnCl2 show an overall increase in vinculin intensity and thus have larger focal adhesions [76]. Whereas a statistically significant (P<0.001) increase of ~20% is seen for vinculin intensity at the periphery of MnCl2, CAP, or both treated cells. However, no significant changes were found in the expression of the total αv integrin in ~3 h after treatments.

Figure 7.17 CAP treatment induces enlargement of the focal adhesions. (A) The immunofluorescence images of WTDF 3 cells (control—no treatments, control+MnCl2—treated with MnCl2 only, plasma—treated only with plasma 100 s and plasma+MnCl2—treated with both plasma 100 s and MnCl2) are shown. αv (RMV 7) integrin are shown in red, focal adhesion protein vinculin—in green and nuclei—in blue. The first column shows the images taken with the magnification 20×, the white asterisk indicates the cells enlarged in the second and third columns: the second shows only αv (red), the third one—only vinculin (green). The change in the size of the focal adhesions is shown with white arrows. (B) Statistical data of the pixels intensities (a.u.) of the RMV 7 and vinculin (normalized to the controls) are shown. The statistically significant increase (~20%) in the vinculin intensity is shown with the double asterisk (P<0.001). The error bars indicate the error of the mean for the presented data. Source: Reprinted with permission from [72]. Copyright (2012) by Institute of Physics.
7.2.2.5 Relationship between integrins and focal adhesions
The results shown in Section 7.2.2.3 demonstrate that CAP activates β1 integrin, slows down cell migration, and increases focal adhesion size. The ability of CAP to alter cell migration rates is not specific to fibroblasts but extends to human corneal epithelial cells; both types of cell reduce their cell migration rates by maximum 30–40% after CAP treatment. The extent of reduction in cell migration rate after CAP in fibroblasts and epithelial cells was identical to the reduction in cell migration achieved by activating integrins using MnCl2 or by serum starving cells.
In both cell types, CAP decreases cell migration as a function of plasma treatment time up to a threshold above which no further change in cell migration is seen. That threshold is reached at 40 s for fibroblasts and 100 s for epithelial cells. The difference in threshold between cell types suggests that epithelial cell adhesion is mediated by integrins that are more adhesive and more difficult to activate. Epithelial cells but not fibroblasts express α6β4 integrin, which acts like cellular glue to mediate the tight adhesions needed between the epidermis and underlying dermis [71]. It is likely that the increased adhesion seen in epithelial cells underlies the higher threshold seen in CAP treatment time required to reduce epithelial cell migration by 30–40%. It is important to note that CAP treatment of ~40 s leads to discrimination between fibroblast and epithelial cells thus allowing differential treatment of various cells presented in tissue.
MnCl2 treatment is known to activate integrins and to reduce cell migration rates; here it was shown that MnCl2 alone reduces cell migration rates to the same extent as plasma treatment. The migration rates of plasma-treated cells and those of plasma-treated cells subsequently treated with MnCl2 are similar. It is known that treatment with MnCl2 leads to integrin activation, thus linking plasma treatment to integrin activation. If plasma treatment did not activate integrins, incubating cells with MnCl2 would further reduce cell migration rates.
Serum starvation induces cell flattening and activates integrins via mechanotransduction of stress forces to the cells focal adhesions. The fact that plasma treatment does not alter the migration rates of serum-starved cells can be interpreted numerous ways. It is possible that the reduction in cell migration after plasma treatment requires nutrients lacking in media with 1% serum; this is unlikely since rapid cell migration demands energy and nutrients. It is also possible that cell migration in 1% media is reduced to a level that cannot be reduced further without a loss of cell viability. Although cell migration rates did not change after CAP treatment of serum-starved cells, it is remarkable that the most observed starved cells did not show an increase in cell death in response to CAP treatment.
Integrins are expressed on cell surfaces as αβ heterodimers. There are two different classes of integrins on fibroblasts: those that adhere primarily to fibronectin (FN) and collagens and are primarily β1 containing integrins (α1β1, α2β1, α3β1, α5β1, α7β1, α8β1, α9β1, and α11β1) and those that adhere to vitronectin (VN), which include the αv containing integrins (αvβ3 and αvβ5) [77]. Epithelial cells are more complex having an additional integrin heterodimer (α6β4) to mediate attachment to laminin [71,77].
Tissue culture plastic is charged. When cells are placed in dishes with media containing 5% serum, low concentrations of glycoproteins with charged sugar moieties on their surface that are present in the serum stick to the uncoated tissue culture plastic. FN and VN, two integrin ligands, are among the proteins present in serum that stick to tissue culture plastic. This yields a low concentration of those ligands on uncoated tissue culture plastic and supports cell adhesion and migration by both β1 and αv integrins. When cells adhere to high concentrations of FN-collagen type I (FN/CNI), β1 integrins cluster which induces their activation, adhering cells to VN clusters and induces activation of αv integrins. When cells migrate on FN/CNI- or VN-coated surfaces, they migrate using primarily β1- or αv-integrins, respectively.
The purpose of the replating studies was to determine whether cells using primarily β1 integrins to migrate respond to plasma treatment differently than cells using primarily αv integrins or cells using both β1 and αv integrins on uncoated plastic. If plasma treatment acts by increasing β1 integrin activity, then plating cells on FN/CNI would reduce or eliminate the impact of plasma treatment on cell migration rate because β1 integrins would be active prior to plasma treatment; in addition, if plasma treatment acts by increasing β1 integrin activity, plating cells on VN would enhance the plasma affect. Putting cells on VN reduces the cells’ surface ligated and activated β1 integrin compared to cells on uncoated plastic. There would be less active β1 integrin present on cells on VN than on cells on uncoated plastic and therefore there would be an increase in the ability of plasma to alter cell migration if plasma operates by increasing β1 integrin activation alone. As shown in Figure 7.15, there is a reduction in the ability of plasma to alter cell migration when cells are plated on FN/CNI compared to uncoated plastic and VN-coating dishes. These results show that plasma treatment operates primarily through β1 integrins but that αv integrins are also involved because plating cells on VN did not increase the ability of plasma treatment to reduce cell migration.
The data obtained for β1 integrin activation using immunofluorescence (see Figure 7.16) confirms that MnCl2 treatment, as expected, activates β1 integrin but data were only statistically significant for β1 integrin at the cell periphery where the ratio of active to total integrin increased from 1.1 to 1.4; it was not observed an increase in β1 integrin activation at the cell center. The failure to demonstrate β1 integrin activation at the center of cells likely reflects limitations of 9EG7, which binds to its activation-state epitope more readily when the integrin is both ligand bound and active [78]. Because integrin activation at the cell center of control cells treated with MnCl2 was not noticed, we focused our assessment of whether β1 integrin was activated by plasma treatment on changes seen at the cell periphery. The data presented in Figure 7.16 show that the ratio of active to inactive is 1.1 without plasma treatment, whereas after plasma treatment it is 1.38. This value is statistically significant; treating cells with plasma followed by MnCl2 increases the ratio of active to inactive β1 integrin to 1.5. It is also worth noting that there is a statistically significant difference in the presence of the activated β1 integrin between cells treated with only plasma and only MnCl2 and between only plasma and MnCl2 and both. This interesting observation can be subject of the future studies, since it is expressing different mechanisms involved in the integrin activation.
Integrin activation is one of the conditions required for the formation of focal adhesions [79,80]. The activation of integrins leads to an increase of the sizes of focal adhesions. The data presented in Figure 7.17 show that plasma-treated cells and cells treated with MnCl2 both show an increase in the size of the vinculin positive focal adhesions measured in pixel intensities at the cell periphery of ~20%. Treating cells with plasma followed by MnCl2 further increased the sizes of the focal adhesions, but the increase was small. Ligated αv integrin also localizes to focal adhesions. After plasma treatment, focal adhesions increase in size, and activated β1 integrin accumulates within these larger focal adhesions and yet, αv integrin does not increase within focal adhesions. If the ratio of αv integrin to vinculin is determined, it is clear that both plasma and MnCl2 treatments reduce the localization of αv integrin within focal adhesions. Consider together the data with the cell migration rate presented in Figure 7.16B and the β1 integrin activation data in Figure 7.17. These data suggest that plasma treatment increases β1 integrin activation leading to increased accumulation of β1 integrin and reduced accumulation of αv integrin within focal adhesions. These events increase focal adhesion size. The increased size of focal adhesions resists disassembly during cell migration and impedes cell migration rates. Interestingly, the migration rate reduction due to CAP treatment and MnCl2 is about ~30–40%; the low migration rate value seen after these treatments may represent some universal lower threshold for cell migration rate.
7.2.2.6 Thermodynamic model of the CAP effect on the cell membrane
Let us discuss a possible physical mechanism leading to integrin activation and, thus, decrease in the cell motility as described in the previous sections. A mechanism based on the thermodynamic model of mechanotransduction developed by Shemesh et al. [81] will be described here. The model uses the thermodynamic argument that the pulling force leads to self-assembly of molecules into an aggregate increasing the number of focal adhesions in order to decrease the stresses induced on the cell membrane.
Several phenomena associated with reactive chemical species, charged species, or charging can possibly effect the cell migration [82]. In the following model, it will be demonstrated that cell membrane charge change can affect formation of the focal adhesions. The change in charge that caused by plasma at the cell might lead to conformational changes in the extracellular domain of the integrins ligands [83] and, therefore, integrins activation. Consider the direct charge transfer from the plasma to the cell. Recall that while cells are covered by media before the treatment plasma jet action lead to removal of the liquid above the treated cells during the treatment.
Charge that is changed at the cell can be calculated based on the floating potential argument [84]. In the case of a cell with radius of ~10−5 m, the charge is ~104 electrons [84].
The charge will induce the force
![]()
where R is the cell radius and thus the elastic stress will be formed along the cell membrane. According to the thermodynamic argument, the aggregation (i.e., focal adhesion (FA) centers formation) occurs if the chemical potential in the aggregate is smaller than without focal adhesions. One can estimate the force due to the formed focal adhesions as NAfA, where NA is the number of the focal adhesions and fA is the resisting force of the anchor. Thus, the change in the thermodynamic potential can be expressed as
![]() (7.2)
(7.2)
where Δμ(Q,NA) is the change in the chemical potential, Δμ0 is the change in the chemical potential in the absence of induced charge, ((Q2/4πεR2)−fANA) is the resulting tension between the electric field force and resistance of the FA appeared at the cell surface due to the interaction with plasma. Estimate the fA for the unperturbed cell-surface charge Q0 as ![]() (NA0 is the number of focal adhesions in the cell without plasma-induced charge), then change in the chemical potential can be rewritten as
(NA0 is the number of focal adhesions in the cell without plasma-induced charge), then change in the chemical potential can be rewritten as
![]() (7.3)
(7.3)
with ![]() It can be seen that increase in the number of focal adhesions leads to decrease in the chemical potential. Calculations based on this model are presented in Figure 7.18. One can see that according to this model, an induction of the extra charge at the cell surface will lead to the formation of the new focal adhesions (see Figure 7.18). This can explain decrease of the cell motility observed experimentally after plasma treatment.
It can be seen that increase in the number of focal adhesions leads to decrease in the chemical potential. Calculations based on this model are presented in Figure 7.18. One can see that according to this model, an induction of the extra charge at the cell surface will lead to the formation of the new focal adhesions (see Figure 7.18). This can explain decrease of the cell motility observed experimentally after plasma treatment.

Figure 7.18 Thermodynamic model. (A) Schematic representation of the cold plasma interaction with a cell layer is shown. (B) Spherical approximation of the cell with induced charge Q and as a result resisting forces fA in the points of the formation of the focal adhesions (red) are shown. (C) The qualitative plot of the chemical potential (Δμ/Δμ0) as a function of the charge change at the cell (Q/Q0) and the change of the number of focal adhesions (NA/NA0) is shown. One can see as charge increases, the chemical potential becomes negative. Source: Reprinted with permission from [72]. Copyright (2012) by Institute of Physics.
7.3 Application of CAP in cancer therapy
In Section 7.2, it was demonstrated that CAP has the nonaggressive nature during the interaction with cells [85]. It was shown, albeit indirectly, that plasma can interact with organic materials without causing thermal/electric damage to the cell surface, and several biological applications were examined [7]. As evidence accumulates, it is becoming clear that low-temperature or cold plasmas have an increasing role to play in biomedical engineering.
There is still some controversy with respect to the mechanism of plasma–cell interaction. Some authors are of the opinion that ion species play the most important role in plasma–cell interactions by triggering intracellular biochemistry [17]. Alternatively, others have suggested that neutral species play the primary role in some plasma–cell interaction pathways [18]. Furthermore, the effects of various ion species may be highly selective; different species can have either “plasma killing” (such as O) or “plasma healing” (such as NO) effects [7,86]. The role of other species, such as O3 and OH, are not yet clear.
One of the important and perhaps most promising application of CAP is the cancer treatment [87–91].
The complex nature of cancer makes it difficult to develop effective treatments. Targeted cancer therapies are defined as substances or methods that block tumor growth by interacting with specific molecules or that focus on treatments to cancer specific molecular and cellular changes. Several targeted cancer therapies exist today. Examples include chemotherapy, radiotherapy, and molecularly targeted drugs [92–94]. One way to target cancer cells is to interfere with the cell cycle. Cancer cells proliferate at a faster rate than normal cells [95]. Combination therapies are proved to be most effective; they impact cancer cell biology at multiple signal transduction pathways resulting in a synergetic effect. The goal is to trigger cells to execute what has been referred to as “the cell death pathway” or apoptosis. A major hurdle in treating cancers is preserving surrounding normal tissue while inducing death of the cancer cells within a tumor. While progress is being made at developing treatments that are selective for cancer cells, cancer treatment damage to normal cells within tissues remains a major problem in oncology.
In this section, we will describe the known (and published) application of CAP. In particular, the therapeutic potential of CAP with a focus on selective tumor cell eradication capabilities and signaling pathway deregulation will be described.
Demonstration of plasma antitumor activity has been demonstrated using various plasma delivery systems [89,90]. In particular, in vivo studies revealed that the cold plasma leads to decrease of tumor volume after plasma treatment.
7.3.1 Cold plasma selectivity
A strong selective effect was observed, the resulting 60–70% of SW900 (lung) cancer cells were detached from the plate in the zone treated with plasma, while no detachment was observed in the treated zone for the normal NHBE (lung) cells under same treatment conditions. Images of treated and untreated NHBE and SW900 cells are shown in Figure 7.19. Plasma treatment leads to a significant reduction in SW900 cell count, while NHBE cell count is practically unchanged.

Figure 7.19 Selectivity effect of plasma treatment: SW900 cancer cells were detached from the plate in the zone treated with plasma, while no detachment was observed in the treated zone for the normal NHBE cells [22].
Both murine macrophages and B16 melanoma cells were treated with the cold plasma device for 0, 30, 60, and 120 s. Annexin V and 7-AAD staining was performed for flow cytometry analysis at 24 and 48 h after treatment. As seen in Figure 7.20, a clear dose–response to cold plasma treatment is seen in the murine melanoma cells at both 24 and 48 h (P<0.0001), while the treated murine macrophages do not differ from control at either 24 or 48 h (P=0.1350 and 0.1630, respectively). These findings suggest that the cold plasma jet has a more selective effect on murine melanoma cells.
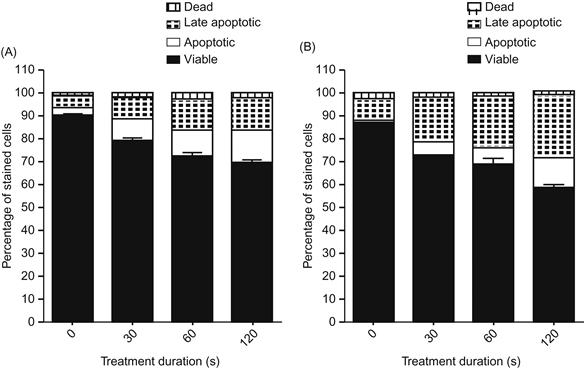
Figure 7.20 Selectivity effect of plasma treatment: B16 melanoma cells treated with the cold plasma device for 0, 30, 60, and 120 s: (A) 24 and (B) 48 h. Annexin V and 7-AAD staining was performed for flow cytometry analysis at 24 and 48 h after treatment. Four-quadrant analysis of the results characterizes the cells as viable (unstained), apoptotic (Annexin V positive), late-apoptotic (double positive), and dead (7-AAD positive) [22].
In order to determine the cold plasma effect in vivo, we applied the cold plasma jet to nude mice bearing subcutaneous bladder cancer tumors (SCaBER). We examined the mouse skin after cold plasma treatment and did not see any damage to the skin after 2–5 min of treatment. Tumor models treated by cold plasma are shown in Figure 7.21. The plasma jet is shown in Figure 7.21A. One can see that a single plasma treatment leads to tumor ablation with neighboring tumors unaffected (see Figure 7.21B). These experiments were performed on 10 mice with the same outcome. We found that tumors of ~5 mm in diameter are ablated after 2 min of single time plasma treatment (see Figure 7.21B and E), while larger tumors decreased in size. Interestingly, ablated tumors did not grow back while partially affected tumors started growing back a week after treatment, although they did not reach the original size even 3 weeks after treatment.
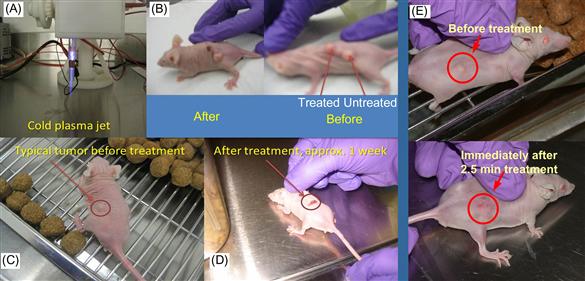
Figure 7.21 (A) Cold plasma device; (B) typical image of mice with three tumors before and after treatment (shown after 24 h); (C and D) typical image of mice with a single tumor before and ~1 week after treatment; (E) tumor before and immediately after 2.5 min treatment with cold plasma jet [22].
Next step is to evaluate the cold plasma device for in vivo efficacy in a murine melanoma model. While tumors eventually recurred, a single transcutaneous cold plasma treatment induced ablation of the tumor through the overlying skin. As demonstrated in Figure 7.22, tumor growth rates were markedly decreased after cold plasma treatment. Notably, this resulted in a markedly improved survival in the treatment group (P=0.0067), with a median survival of 33.5 vs. 24.5 days as shown in Figure 7.23.
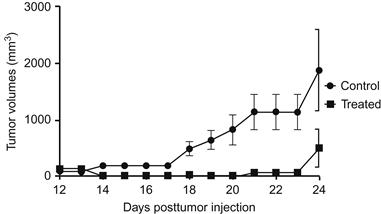
Figure 7.22 Cold plasma treatment effect on the growth of established tumor in a murine melanoma model [22].

Figure 7.23 Cold plasma treatment effect on the mice survival in a murine melanoma model [22].
The skin temperature during plasma treatment was measured using an infrared thermometer to assess whether the cold plasma effect on cancer tissue is associated with thermal damage. Cold plasma treatment produced an increase in skin temperature of ~2°C above room temperature, which is below the temperature needed for thermal damage.
7.3.2 Gene expression analysis
The beta values of all probes on the Illumina BeadChip arrays were subjected to log 10 transformation and then normalized to the average in order to generate a heatmap of selected genes based on unsupervised hierarchical clustering with the Spotfire® software (Somerville, MA). The clustering was based on the unweighted average method using correlation as the similarity measure and ordering by average values. The red color was selected to represent upregulated genes and the green color to represent downregulated genes. Genes were selected for clustering if they were four times upregulated or downregulated after treatment with cold plasma. Figure 7.24 depicts the most upregulated genes (left panel) and the most downregulated genes (right panel) after cold plasma treatments. The list on upregulated and downregulated genes is shown in Table 1 of Ref. [22].
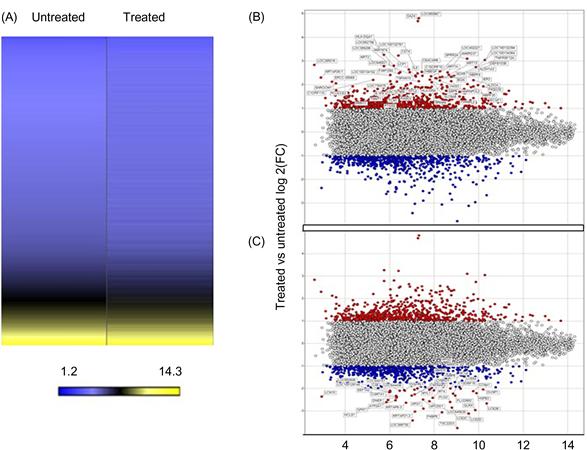
Figure 7.24 (A) A heatmap of the normalized log 2 signal intensity values in the illumina expression array for the untreated and treated sample. The yellow color was selected to represent high log 2 signal intensity values and the color blue to represent low log 2 signal intensity values. (B) Plot of upregulated genes (red) in a treated sample compared to an untreated sample. The values on the Y-axis represent the ratio of treated/untreated log 2 fold change. The values on the X-axis represent the average log 2 signal intensity. (C) Plot of downregulated genes (blue) in a treated sample compared to an untreated sample. The values on the Y-axis represent the ratio of treated/untreated log 2 fold change. The values on the X-axis represent the average log 2 signal intensity. [22].
Differences between genes that were up- or downregulated in treated or untreated cells were analyzed for biological significance using Geneontology (Spotfire®) and Ingenuity Pathway Analysis (IPA®). Differences in gene expression were found to be associated with pathways intimately related to cell adhesion, cell proliferation, growth regulation, and cell death (P<0.05).
The experiments described above demonstrate potent effects of cold plasma treatment on cancerous tissue both in vitro and in vivo. Studies have offered several potential mechanisms for cold plasma’s effect, including development of ROS, RNS, charged particles, heat, pressure gradients, and electrostatic and electromagnetic fields [7,18,22,26,86–90,96]. Notably, plasma has minimal impact on ambient cellular conditions. For instance, media pH-levels remain unchanged after treatment, and some study confirms that thermal effects associated with cold plasma are negligible as it was mentioned above. Beyond the direct external influence of the jet, cold plasma may induce living cells to produce their own ROS/RNS. Thus, described results suggest that multiple pathways involved in cancer processes, including cell adhesion, cell proliferation, growth regulation, and cell death, are selectively deregulated by cold plasma treatment in cancer cells. Some of these pathways may likely be responsible for tumor ablation. Perhaps consequently, it was further demonstrated that an induction of cellular apoptosis in treated cells, as manifested by both expression of cell-surface markers and gene expression, confirmed results of previous studies [7,18,22,26,86–90,97]. Most importantly, these findings are translated to in vivo models of cancer therapy, with marked reductions in tumor volumes and improved survival.
Given these findings, it can be suggested that cold plasma represents a promising new adjunct for cancer therapy, offering the ability to directly target and selectively kill neoplastic tissue. Notably, CAP device provides a method for practical administration of this cancer therapy. Plasma therapy could potentially target internal malignancies via an endoscopic delivery system, thus enabling this technology to serve as either a standalone treatment option or, more realistically, an adjuvant to existing therapies.
In summary, proof-of-principle studies shows new in vitro and in vivo response of cancer cells upon treatment with cold plasma jets. These very surprising preliminary results suggest that the cold plasma jet can selectively ablate some cancer cells (such as melanoma and bladder), while leaving their corresponding normal cells essentially unaffected. The two best known cold plasma effects, plasma-induced apoptosis and the decrease of cell migration velocity [22,96], can have important implications in cancer treatment by localizing the affected area of the tissue and by decreasing metastasis development. Moreover, the selective effect of cold plasma on different cell types suggests that it is possible to find the right conditions with plasma treatment affecting only cancer cells, while leaving normal cells essentially unharmed. Finally, mid-sized tumors in nude mice were destroyed after a 2 min single time treatment by cold plasma without visible thermal damage of the skin. As such, we expect that the development of cold plasma treatment will cause a paradigm shift in cancer therapy. Such promising results warrant further efforts aim in understanding the mechanism of CAP action. Some progress has been achieved in this respect as will be described in the next section.
7.3.3 Targeting the cancer cell cycle by CAP
In this section, the correlation between the changes seen in cell motility observed previously in normal primary skin cells with viability and cell cycle progression under CAP treatment will be discussed. Furthermore, it will be hypothesized that cancer cells are more susceptible to the effects of CAP because a greater percentage of cells are in the S-phase. To test validity of this hypothesis, the normal cells derived from mouse skin as well as two mouse skin cancer cell lines will be treated by CAP.
It should be pointed out that the skin is the largest human organ and includes 15–20% of total body mass. The outer layer of the skin, the epidermis, is composed primarily of keratinizing stratified squamous epithelial cells. Two competing processes sustain the thickness of the epidermis: (i) proliferation and (ii) terminal differentiation of keratinocytes; both processes are driven by specific signaling pathways. Disturbances of cell–matrix, cell–cell adhesion, or terminal differentiation can lead to homeostatic imbalance in various diseases including skin cancers. Reduced terminal differentiation of skin cells allows the cells to continue proliferating and is a common feature of skin cancers [98,99]. Below the responses on CAP treatment of normal primary mouse keratinocytes with those of two well-studied mouse skin cancer cell lines that were derived from normal mouse keratinocytes will be discussed. While the two cell lines consist of transformed keratinocytes, they vary in their ability to induce tumors when injected into mice, a property referred to as tumorigenicity. One line (308) generates benign tumors called papillomas, whereas the other (PAM212) generates carcinomas [64,100,101].
7.3.3.1 The cell cycle
The cancer is defined as a disease in which one cell or the group of cells acquired the ability of uncontrolled indefinite proliferation and to invade distant site and organs. The current somatic mutation theory of carcinogenesis and metastases firmly defines the cancer as a cell-based disease [102]. However, in 1962, some argument existed that cancer should be studied as a problem of organismal disorganization [103]. The overwhelming evidence of the genetic origin of cancer is mutations, i.e., carcinogens (also mutagens) or some deficiencies related to DNA-repair process [104,105]. But still both cancer and normal cells have two fundamental behavioral properties, proliferation and motility. Nowadays it was identified the important role of the microenvironment causing the cancer [106]. The cancer is complicated; tumor development from an “initiating” cell is described by a conceptual model proposed by Nowell in 1986 [107]. It states the selectivity in generation and growth of variant (mutant cells) within the tumor toward more autonomous cells to become dominant subpopulation and, thus, leading the tumor progression. This model was developed from Foulds studies and later confirmed by Heppner et al. studies, where it was demonstrated that the growth and development of the cells inside the tumor is tightly regulated by interaction between the cells and extracellular environment [108]. Here, it is necessary to mention about the cancer immunoediting model, when immune system controls not only tumor quantity but also the tumor quality (immunogenicity), i.e., stresses the dual host-protective and tumor-promoting actions of immunity on developing tumors [109].
Cell proliferation is tightly regulated within tissues. And in normal self-renewal tissue, there is a homeostatic balance, i.e., cell proliferation rate is equal to the cell death rate. In early cancers and during the malignant progression, cell proliferation exceeds the cell death. One of the hallmarks of cancer is the deregulation of the molecular mechanisms controlling cell cycle [110]. The cell cycle is a “life of cell”; it describes the different steps that take place as a cell proliferates (Figure 7.25). The DNA synthesis occurs only in specific period of cell cycle, which is called S-phase, the morphological changes in cell refer to the mitotic phase (M-phase), a phase of the cell division. The gaps between M and S and between M and S phases are called G1 and G2 phases. Cell cycle is shown schematically in Figure 7.25. Nonproliferating cells are in the G1 (ground) phase of the cell cycle. When cells proliferate, they move progressively from G1 to S (synthesis of DNA), G2, and then M (mitosis) phase where they divide. Cells revert back to G1 after S. Cells in G1 may enter quiescence (G0), terminally differentiate, or, in response to specific signals, be induced to proliferate. Most cells in normal adult tissues are in quiescent G0-phase. Between S and G2 and between G2 and M phases, there are what have been called “checkpoints.”
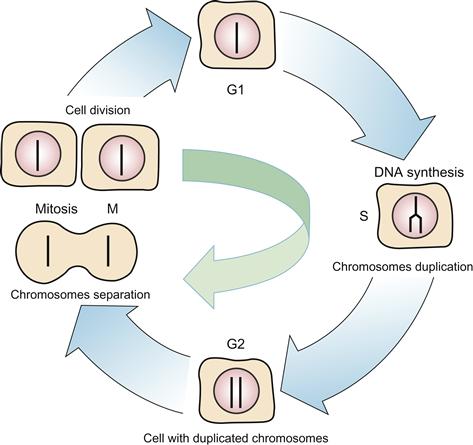
The proper progression through the cell cycle is monitored and controlled by checkpoints. These checkpoints verify whether the processes at each phase of the cell cycle have been accurately completed before progression into the next phase.
Activation of the checkpoints induces the cell cycle arrest by activation of the checkpoints through modulation of a cyclin-dependent kinases (CDKs) activity, a special group of protein kinases with evolutionary conserved function of the cell cycle control. Cell cycle arrest allows cells to repair possible defects through the complex system of DNA-repair enzymes. Only whose cells those DNA has been replicated correctly enter M-phase and divide. If errors are detected, a cell death pathway will be executed [111]. Whereas cells within most tissues of the body proliferate infrequently and are in either G0 or G1, the cancer cells in a tumor or in the circulation are more likely to be in the S-phase of the cell cycle. One way to specifically target cancer cells is to target the S-phase of the cell cycle. This is because cancer cells have mutations that allow them to evade the checkpoints and enter into the S-phase.
7.3.3.2 CAP effect on the cell migration and velocity distribution among the chosen cell population
Let us start with description of the CAP effect on migration of normal and transformed epithelial cells. The right panel of Figure 7.26A–C shows the dependence of cell migration rates on the CAP treatment time. For each time point, ~50–60 cells were analyzed. The cell velocities/migration rates and cell numbers were normalized. Statistical analysis of the data showed that wild-type keratinocytes (WTK) (Figure 7.26A) and PAM212 cells (skin cancer line) (Figure 7.26C) have a statistically significant change in the migration rates beginning 40 s of CAP treatment. The migration rates for WTK cells and PAM212 cells after 60 s of CAP is ~30% and ~20% less than untreated cells; these changes are well identified by velocity distribution function of the cells and become even more statistically significant. The left panel of Figure 7.26A–C shows the probability distribution functions (PDF) of the cell migration rates (distribution of cell velocities) for untreated cells (control, blue) and cells treated with CAP for 60 s (plasma treated, red). The experimental data (~250 cells of each cell type were analyzed for each condition) are fitted with inverse Gaussian distribution, which describes the first passage in Brownian motion with positive drift [112].

Figure 7.26 CAP effect on the cell migration and velocity distribution among the chosen cell population. The dependence of the cells migration rates on the CAP treatment time from 0 to 180 s are shown for WTK, 308, and PAM212 cells (A–C, left panel). SEM (standard error of mean) is shown with an error bars. For each time point ~50–60 cells were analyzed. The difference between groups were considered statistically not significant for P>0.05 (no mark) and for P<0.05 (single star), P<0.01 (double star) and P<0.001 (triple star) are considered significant. The PDF of the cell migration rates (distribution of the cell velocities) for untreated cells (control, blue) and cells treated with CAP for 60 s (plasma treated, red) are shown for WTK, 308, and PAM212 cells (A–C, right panel). The experimental data (~250 cells of each cell type were analyzed for each condition) is fitted with inverse Gaussian distributions. Source: Reprinted with permission from [91]. Copyright (2012) by Macmillan Publishers Ltd.
For normal and transformed (PAM212) cells, longer CAP treatments increased the reduction of cell migration. CAP treatment for ~120 s gave the upper threshold in the cell migration reduction for the chosen time treatment range (see insets in Figure 7.26A and C). Unlike normal and PAM212 cells, 308 cells did not show any significant change in their migration rate after plasma treatment. It is important to note that 308 cells have very slow motility; their average velocity is ~10-fold less than WTK and PAM212 cells.
The cell velocity distribution of WTK cells showed the most apparent negative shift from control under the mild CAP treatment, unlike PAM212 cells. The cells were also treated with helium only for 60 s. No significant differences in migration rates were found (P>0.05, data is shown in Figure 7.29).
The experiments presented in Figure 7.26 indicate that cell migration rates of normal and PAM212 cells are sensitive to CAP. By plotting the data using PDF, data show that after CAP, migration rates of normal and PAM212 cells cluster more tightly indicating reduced variability among cells within the population. To determine whether there were differences in cell viability among adhered normal WTK, 308, and PAM212 cells, an MTT assay was performed.
The MTT assay results are shown in Figure 7.27A–C for WTK, 308, and PAM212 cells, respectively. The assay was performed 4, 24, and 48 h after two threshold regimes of CAP treatment: 60 s (low threshold) and 120 s (upper threshold) were used to identify changes in cell viability. WTK cells viability decreased by 30% and 50% after 60 and 120 s of CAP treatment in ~4 h after treatment. By 24 h, cell viability after CAP recovers after both treatment lengths.

Figure 7.27 Helium does not affect the cell migration and velocity distribution among the chosen cell population. (A–C) The PDF of the cell migration rates (distribution of the cell velocities) for untreated cells (control, blue) and cells treated helium only for 60 s (helium treated, orange) are shown for WTK, 308, and PAM212 cells. The experimental data (~250 cells of each cell type were analyzed for each condition) is fitted with inverse Gaussian distributions. The difference between groups were considered statistically not significant for P>0.05. Source: Reprinted with permission from [91]. Copyright (2012) by Macmillan Publishers Ltd.
The viability of 308 cells was not changed 60 s of CAP treatment but was significantly reduced after 120 s of CAP treatment in ~4 and 48 h (Figure 7.28B). PAM212 cells responded to CAP treatment with a 30% and 40% decrease in viability after 60 and 120 s, respectively 4 h after treatment. While 308 cell viability recovered 24 h after treatment, similar to 308 cells, PAM212 cells showed reduced viability 48 h after 120 s of treatment (Figure 7.28B and C). No viability differences were observed after 60 s of CAP treatment during later ~24 and 48 h observation for all types of cells. Based on these data, CAP treatment for 60 s was chosen. This treatment regime induces a change in cell migration in normal and PAM212 cells and causes no significant effect on cell viability during 24 and 48 h after 60 s treatment, thus allowing determination of the initiation of the CAP effect on the cells. So the following studies were made for 60 s of CAP treatment.

Figure 7.28 Cell viability studies in two threshold regimes. MTT assay was performed on: (A) WTK; (B) 308 cells (papilloma); and (C) PAM212 cells (carcinoma). Control (not treated) is shown in blue, CAP treated for 60 s—in red and CAP treated for 120 s—in gray cells at 0, 4, and 24 h time points. SEM is shown with an error bar. The experiment was repeated three times for each cell type and condition. Three stars denote extremely significant statistical difference (P<0.001), one star—statistically significant difference (P<0.05), data was considered statistically not different for P>0.05. Source: Reprinted with permission from [91]. Copyright (2012) by Macmillan Publishers Ltd.
7.3.3.3 Identification of the cell cycle changes in G2/M-phase
In addition, CAP effect on the cell cycle of normal, 308, and PAM212 cells was studied. Figure 7.29A–C are bright-field images with 10× magnification of WTK, 308, and PAM212 cells morphology, respectively. Figure 7.29D–L shows DNA content measurement of control (untreated) cells in blue and cells treated with CAP for 60 s in red. The cells were analyzed in ~4 h (Figure 7.29D–F), ~24 h (Figure 7.29G–I), and ~48 h (Figure 7.29J–L) after 60 s of CAP treatment. No significant shifts in the G1–G2 peaks positions were observed for all of the cell types. The data were characterized by the fraction of the cells in the G2/M-phase as well as the coefficient of variation (CV) for control (untreated) and CAP treated cells. CAP-induced robust G2/M-cell cycle increases in both carcinoma (Figure 7.29I) and papilloma (Figure 7.29H) cells (two- to threefold increase in ~24 h after CAP treatment), whereas normal keratinocytes (Figure 7.29C) showed a more modest cell cycle increase. This change diminished in ~48 h. The CV (a normalized measure of dispersion of a probability distribution) was used to characterize the data.

Figure 7.29 Identification of the cell cycle change in G2/M-phase. (A–C) Bright-field images of WTK, epidermal papilloma (308 cells), and epidermal carcinoma (PAM212 cells) cells are shown with a magnification 10×. (D–L) show cell cycle studies: Propidium iodide content (horizontal axis) and normalized number of cells (vertical axis) are shown. The controls are shown in blue and cells CAP treated for 60 s are in red. The ratio of the number of cells (treated to untreated) in G2/M-phase with coefficients of variation (CV, in percents) is shown in the right top corner of each figure. (D–F) shows cell cycle measurements in ~4 h; (G–I) in ~24 h; and (J–L) in ~48 h after the CAP treatment for WTK, 308, and PAM212 cells respectively. The data is shown for ~25,000–50,000 cells for each experimental condition. The measurements were repeated two to three times. Source: Reprinted with permission from [91]. Copyright (2012) by Macmillan Publishers Ltd.
For all three time points, wild-type cells showed ~15–20% CV values for the cells in G2/M-phase, while transformed cells had CV value of ~6–10%.
7.3.3.4 Studies of the cell population’s distribution during the cell cycle under CAP treatment
In order to determine if increased proliferation of the cells might result in the above observed G2/M-increase 24 h after CAP treatment, an additional cell cycle analysis was carried out. Cells were treated with the nucleotide analog EdU that is incorporated into DNA as it is being replicated. After staining EdU treated cells with a dye that binds to DNA (propidium iodide), flow cytometry was used to assess the numbers of cells in the three distinct phases of the cell cycle (G0/G1, S, and G2/M) simultaneously for all three cell types; data are shown in Figure 7.30A–F.

Figure 7.30 The cell distribution during the cell cycle after CAP treatment. The detailed studies of the cell cycles for control and CAP treated for 60 s cells are shown. The correlation between DNA content (propidium iodide) and DNA-replicating cells (EdU-component) is shown for: (A and B)—normal cells (WTK); (C and D)—papilloma cells (308 cells); and (E and F)—carcinoma cells (PAM212 cells) in ~24 h after CAP treatment. CV was used to characterize the propidium iodide data (linear scale) and standard deviation (StDev) was used for EdU-data (log scale) in each phase. Fractions of the number of cells in each cell-cycle phase are shown in percents. The data is shown for ~25,000 cells for each experimental condition. The experiments were repeated two to three times. Source: Reprinted with permission from [91]. Copyright (2012) by Macmillan Publishers Ltd.
Results are presented for the time point 24 h after CAP treated cells for 60 s for the control (untreated) cells. As expected, fewer normal cells were in S-phase (~10%) compared to the two cancer cell lines (transformed cells are highly proliferative): ~50% for 308 cells and ~45% for PAM212 cells. No increase in the fraction of cells in the S-phase after CAP treatment was observed for the three cell types: their number either remained the same or decreased. However, we did observe an increase in the ranging of standard deviation value of CAP treated cells in S-phase of around ~20% for all three cell types suggesting that not all cells within the population of cells responded the same to CAP treatment. While there is no significant difference in the numbers of cells in the S-phase of the cell cycle, one can see that the number of cells in the G2/M fraction increased by ~25% for normal cells and two- to threefold for transformed cells.
The increase in the fraction of cells at the G2/M-phase of the cell cycle is accompanied a decrease in the number of cells in the G0/G1 fraction. This study also shows the general trend in the distribution of cells within the cell cycle and indicates that timing of the cell cycle is different for chosen cells.
7.3.3.5 Cell synchronization effect on the G2/M-peak increase
The next experiment was designed to determine whether cells synchronized at the G2/M-phase of the cell cycle and released would also demonstrate an increase in accumulation at the G2/M checkpoint. 308 cells were chosen for these studies because they showed a robust G2/M-peak increase after CAP treatment. On the other hand, 308 cells did not express significant changes in the migration after CAP was applied. This makes 308 cells most appropriate example to distinguish between the cell migration and cell cycle effects of CAP. Cells were synchronized with nocodazole, a drug that interferes with microtubule polymerization and causes mitotic spindle arrest, thereby preventing cells from entering mitosis; the effect is reversed upon its removal. The drug was removed and cells were treated by CAP in ~2 h after removal of nocodazole. Figure 7.31A shows the time dynamics of the cell cycle immediately after nocodazole removal (0 h point), at the ~4 h time point (it is around the time of CAP treatment) and in ~24 h after CAP treatment when G2/M-increase was observed. Figure 7.31B shows the detailed distribution of cells among phases of the cell cycle 24 h time point of the cells pretreated with nocodazole including CAP treatment. Cell synchronization did not impact the G2/M-pause induced by CAP.
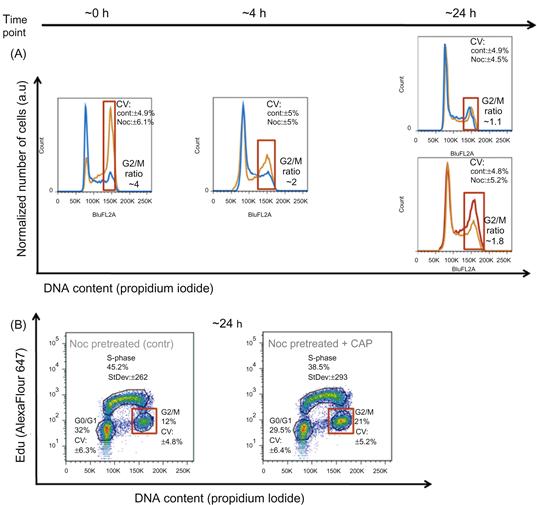
Figure 7.31 Cell synchronization for G2/M-increase studies. 308 cells were synchronized with nocodazole and analysis of the cell cycle was carried out for various time points. (A) shows the time evolution of the 308 cells: the control cells (not treated cells) are shown in blue, the cells pretreated with nocodazole are in orange, and nocodazole pretreated cells which were CAP treated for 60 s—in red. The cell cycle evolution after nocodazole removal is shown at ~0, 4 and 24 h points. The cells were treated with CAP at time point ~2 h after nocodazole removal (the state of the cell cycle for this time point is not shown). The final state of the systems control (not treated cells), cells pretreated with nocodazole only and cells pretreated with nocodazole and treated with CAP is shown for time point ~24 h. The change in ratio between G2/M fractions of the cells at each experimental condition is marked with a red square. (B) shows detailed cell cycle studies of 308 cells for chosen time point ~24 h. The DNA content (propidium iodide, linear scale) and DNA-replicating cells (EdU-component, log scale) characterized by CV (in percents) and StDev (a.u.) values, respectively. The data is shown for ~25,000 cells. The measurements were repeated two to three times. Source: Reprinted with permission from [91]. Copyright (2012) by Macmillan Publishers Ltd.
The CV holds ~around 5–7%, while the fraction of the cells in G2/M-phase doubled in ~24 h after CAP treatment of nocodazole pretreated cells. The cell cycle of cells pretreated with nocodazole only restored to control (not treated) cells profile in ~24 h. The variation of the data spread for cells in S-phase for CAP treated cells was again ~20% more than cells pretreated with nocodazole only. This data also suggested that dynamics of the cell cycle in 308 cells is rapid. Nocodazole caused ~fourfold increase in the number of cells in the G2/M-phase of the cell cycle. When nocodazole is removed, by ~4 h cells begin progressing in synchrony from G2/M to G0/G1 and the ratio of the cells in G2/M-phase falls to ~twofold increase with the accumulated DNA-replicating cells in S-phase. Thus, from this result is not obvious whether or not CAP impacts cells within S-phase or G2/M-phase. However, it can be stated that G2/M-pause after CAP occurs whether or not cells have been synchronized.
7.3.3.6 CAP targets the cell cycle
To directly test whether CAP impacts some cell-cycle phase specifically, experiments were designed to assess the expression of γH2A.X (pSer139) at different phases of the cell cycle. Based on the earlier experimental results shown above, it was surmised that the G2/M-peak increase could be due to effects exerted on cells in the S and/or G2/M phases. It was previously reported in Ref. [22] that CAP based on helium flow may induce ROS response in the cells. Thus, we choose γH2A.X (pSer139) as an oxidative stress reporter of S-phase damage. This histone comprises around ~2–25% of the evolutionarily conserved variant of histone H2A; it goes through a posttranslational modifications in response to ionizing radiation, UV-light, or ROS [113,114]. It can be used in combination with EdU-labeling to determine if the oxidative stress is induced in S-phase [115]. Figure 7.32 shows the results of time-sensitive 308 cell response studies to CAP treatment of 60 s: DNA content in cells, DNA-replicating cells, and γH2A.X expression were measured simultaneously. Figure 7.32A shows the cell cycle dynamics (EdU/DNA content) of 308 cells immediately following and at 4 and 24 h after CAP treatment. Note the very significant change in the S-phase signal (EdU) at ~0 and ~4 h: almost twofold decrease in the median value with decrease of variation range value, while still no significant changes were observed in G0/G1 and G2/M; at the ~24 h time point, the S-phase recovered and the number of cells in G2/M 24 h after CAP treatment was increased. Figure 7.32B–D represent the correlation between γH2A.X signal and DNA content in G0/G1-phase (B); with EdU incorporation to highlight S-phase cells (C), and with DNA content to highlight cells in G2/M-phase (D). There were no significant differences in γH2A.X (pSer139) expression in cells at G0/G1 at any time point (Figure 7.32B). There was an increase in γH2A.X (pSer139) expression (maximum difference Dmax~30% at time point 4 h) correlated with ~twofold decrease in the EdU signal in cells mostly in the S-phase immediately (0 h) and 4 h after CAP treatment (Figure 7.32C). Differences in γH2A.X (pSer139) expression were less apparent 24 h after CAP treatment: G2/M-phase showed some increased variation of γH2A.X (increased ranging value of standard deviation with some increase in the median value) at the time point ~24 h, which correlated with the increase of the number of cells (G2/M-increase, corroborating earlier observations, Figure 7.32D).

Figure 7.32 CAP targets the cell-cycle phase. The time-sensitive studies of the 308 cells cell cycles are shown for the time points ~0, ~4, and ~24 h points after 60 s of CAP treatment. The control (not treated cells) is shown in blue, CAP treated cells are in red. (A) shows the time evolution of the cell cycles (DNA content vs. DNA-replicating cells) of control and CAP treated cell. The changes in EdU and γH2A.X signals are characterized by K-S maximum difference Dmax and Dcr values at the selected time point. (B) shows the correlation between DNA content and γH2A.X reporter for G0/G1 cell phase. (C) shows correlation between DNA-replicating cells (EdU) and γH2A.X for 308 cells in S-phase. (D) shows correlation between DNA content and γH2A.X for the 308 for G2/M-phase for ~0, ~4, and ~24 h time points. Approximately 25,000 cells are shown for each experimental condition. Changes in the fraction of cells between the control (not treated) and CAP treated cells are shown for each cell phase: cell number decreases if the ratio is <1. The statistical description of the signals shown in the (A) is a maximum differences between two distributions in the S-phase with confidence interval 99.9%; in the (B–D) Dcr value is shown: Dcr<1.3581 (P>0.05) is considered not statistically significant and Dcr>1.9526 (P<0.001) is extremely statistically different. Source: Reprinted with permission from [91]. Copyright (2012) by Macmillan Publishers Ltd.
7.3.3.7 On the mechanism of CAP in cancer therapy
In the previous sections, we described how effects of cold plasma on cells depend on the time cells are treated with a specific power, the chemical composition (helium flow based jet), and the number of cells within the population treated that are in the S-phase. Normal skin cells are less likely to be in S-phase of the cell cycle compared to cancer cells. Normal skin cells do not induce tumors when injected into mice; two different cancer-causing cell lines do cause tumors [89]. More tumorigenic cell line (PAM212), like normal cells, also shows reduced migration rates and viability after mild CAP treatment, but the other cell line (less tumorigenic papilloma cells) shows neither reduced migration rates nor reduced cell viability. To determine the underlying causes of these differences, detailed cell cycle assessments were conducted on the CAP treated cells. These data show that CAP affects all stages of the cell cycle, however depending on the phase of the cell cycle in which a cell exists at the outcome of the CAP treatment or the cell response is different. We track only those cells that do not undergo mitosis over the 16 h and 40 min time period; the cells are subjected to time lapse were most likely in G0/G1- or S-phase. Experiments using dermal fibroblasts and epithelial cells suggest that differences in integrin expression and/or activation (conformational changes on the cell surface) cause the cell migration effects induced by CAP [72]. The migration rate of 308 cells is very slow (~10-fold less) compared to normal keratinocytes and PAM212 cells. Despite the fact that CAP had no effect on cell migration in 308 cells, our detailed analyses of the cell cycle and expression of γH2A.X (pSer139) in these cells show that they do respond to CAP treatment. Like normal cells and PAM212 cells, 308 cells undergo transient G2/M-pause after CAP.
The experiments presented show that the phosphorylation of histone γH2A.X was most evident in cells in S-phase (median rise up to ~35%); however, a not-quite mathematically significant increase was also observed in G2/M. The increase of γH2A.X expression correlated with an abrupt decrease in the median value of EdU signal that started immediately after CAP treatment and continuing at the 4 h time point. Thus, CAP causes reduction in progression of cells through S-phase (DNA-replication slows down), induces oxidative damage to DNA, indicated by phosphorylation of histone γH2A.X on serine residue 139, leading to the accumulation of cells at the G2/M checkpoint caused by the DNA damage.
The kinetics of γH2A.X phosphorylation suggests that CAP treatment most likely is not related to double-strand breaks [116] confirming earlier experimental findings. It has also been shown that phosphorylated H2A.X forms nuclear foci at the sites of stalled replication forks in response to exposure of S-phase cells to UV radiation, and chromatin changes or modifications play a role in the replication block pathway [117]. The spectral analysis of CAP jet showed that most of species were excited at the UV range (280–450 nm), providing a possible explanation for induction of S-phase damage; however, ROS stresses have to be taken into account as well. With the mild CAP treatment, only a ~10% decrease in the number of S-phase cells was detected, so this treatment (as MTT also showed) does not kill skin cells effectively. But as shown in Figure 7.32, increasing the treatment length to 120 s decreases the viability of the cells. The fact that most of the reduction appeared in ~48 h could be explained by the initiation of apoptotic pathway in those cells in S-phase which subsequently did not recover.
In ~24 h, restoration of the S-phase of the cell cycle was accompanied by an increase in G2/M-peak, indicating that the CAP treated cells progressed into the G2/M-phase. We did not observe significant differences in G2/M in normal keratinocytes where ~10–15% of cells within the population are in the S-phase; ~40–50% of cancer cells are in the S-phase (DNA synthesis phase).
Figure 7.33 shows schematically how CAP affects various types of cells. The 308 cells are different in many ways from the PAM212 cells despite that fact that both cell lines arose from mouse keratinocytes in the same laboratory at the NCI at the NIH. It would be necessary to study in detail several additional sets of normal and transformed cells before we could definitively conclude that increased susceptibility to CAP correlates with tumorigenicity of the cells. The progression of these two cell types through the cell cycle is different and one should take into account that the strength of the treatment effect correlates with the time point chosen for analysis. However, the data we produce here goes a long way toward proving that mild CAP impacts DNA synthesis and causes a transient cell cycle pause at the G2/M-phase of the cell cycle; and that overall CAP impact on the migration rates, viability, and cell cycle increases on the cancer cells as they are more tumorigenic. It is important to note here that other cancer cell lines and in vivo models tested with the similar CAP treatment conditions showed different resistance and timing for the cell cycle effects, which is determined by their differences.

Figure 7.33 The schematic model of the CAP impact on the cell cycle. (A) is the schematic representation of the cells distribution during the cell-cycle phase for analyzed types of cells: WTK, 308, and PAM212. (B) is schematic of the CAP affect on the cell cycle with consequent cell response. Source: Reprinted with permission from [91]. Copyright (2012) by Macmillan Publishers Ltd.
Homework problems
Section 1
1. Give a definition of cold plasma. What are the different approaches to form cold plasmas? Describe what diagnostic technique can be used for electron density measurements in cold plasmas.
2. Explain concept of “plasma bullets” applied for cold atmospheric plasma jet. What time resolution of high-speed camera is needed to measure “plasma bullets” speed.
3. Explain concept of cell migration. What is the possible mechanism? How plasma treatment can affect cell migration?
4. What is the possible mechanism of selective effect of the cold plasma toward the cancer cells?
5. Explain the effect of cold plasma on the cell cycle. What is the possible contribution of ROS?
References
1. Becker KH, Shoenbach KH, Eden JG. Microplasma and applications. J Phys D. 2006;39:R55–R70.
2. Stoffels E, Kieft IE, Sladek REJ, van den Bedem LJM, van der Laan EP, Steinbuch M. Plasma needle for in vivo medical treatment: recent developments and perspectives. Plasma Source Sci Technol. 2006;15:S169–S180.
3. Fridman G, Friedman G, Gutsol A, Shekhter AB, Vasilets VN, Fridman A. Applied plasma medicine. Plasma Process Polym. 2008;5:503.
4. In: http://usmedinnovations.com.
5. Canady J, Wiley K, Ravo B. Argon plasma coagulation and the future applications for dualmode endoscopic probes. Rev Gastroenterol Disord. 2006;6:1.
6. Stoffels E, Flikweert AJ, Stoffels WW, Kroesen GMW. Plasma needle: a non-destructive atmospheric plasma source for fine surface treatment of (bio)materials. Plasma Source Sci Technol. 2002;11:383.
7. Stoffels E, Sakiyama Y, Graves D. Cold atmospheric plasma: charged species and their interaction with cells and tissues. IEEE Trans Plasma Sci. 2008;36(4):1441–1457.
8. Stalder K, McMillen D, Woloszko J. Electrosurgical plasmas. J Phys D Appl Phys. 2005;38:1728–1738.
9. Laroussi M, Lu X. Room-temperature atmospheric pressure plasma plume for biomedical applications. Appl Phys Lett. 2005;87:113902.
10. Laroussi M, Hynes W, Akan T, Lu X, Tendero C. The plasma pencil: a source of hypersonic cold plasma bullets for biomedical applications. IEEE Trans Plasma Sci. June 2008.
11. Lu X, Jiang Z, Xiong Q, Tang Z, Pan Y. A single electrode room-temperature plasma jet device for biomedical applications. Appl Phys Lett. 2008;151504.
12. Lu X, Jiang Z, Xiong Q, Tang Z, Hu X, Pan Y. An 11 cm long atmospheric pressure cold plasma plume for applications of plasma medicine. Appl Phys Lett. 2008;081502.
13. Mariotti D. Non-equilibrium and effect of gas mixtures in an atmospheric microplasma. Appl Phys Lett. 2008;92:151505.
14. Kolb JF, Mohamed AAH, Price RO, et al. Cold atmospheric pressure air plasma jet for medical applications. Appl Phys Lett. 2008;92:241501.
15. G. Fridman, A. Shereshevsky, M. Peddinghaus, A. Gutsol, V. Vasilets, A. Brooks, et al., Drexel University, Philadelphia, PA, Bio-medical applications of non-thermal atmospheric pressure plasma, AIAA-2006-2902, in: 37th AIAA Plasma Dynamics and Lasers Conference, San Francisco, CA, 2006.
16. Johnson EN, et al. Infectious complications of open type III tibial fractures among combat casualties. Clin Infect Dis. 2007;45(4):409–415.
17. G. Fridman, D. Dobrynin, S. Kalghatgi, A. Brooks, G. Friedman, A. Fridman, Physical and biological mechanisms of plasma interaction with living tissue, in: 36th International Conference on Plasma Science, San Diego, CA, 2009.
18. S. Kalghatgi, A. Fridman, G. Friedman, A. Morss-Clyne, Non-thermal plasma enhances endothelial cell proliferation through fibroblast growth factor-2 release, in: 36th International Conference on Plasma Science, San Diego, CA, 2009.
19. Kong MG, Kroesen G, Morfill G, et al. Plasma medicine: an introductory review. New J Phys. 2009;11:115012.
20. Fridman G, Friedman G, Gutsol A, Shekhter AB, Vasilets VN, Fridman A. Applied plasma medicine. Plasma Process Polym. 2008;5:503–533.
21. Stoffels E, Sakiyama Y, Graves DB. Cold atmospheric plasma: charged species and their interactions with cells and tissues. IEEE Trans Plasma Sci. 2008;36(4):1441–1457 35pp.
22. Keidar M, Walk R, Shashurin A, et al. Cold plasma selectivity and the possibility of a paradigm shift in cancer therapy. British J Cancer. 2011;105:1295–1301.
23. Vandamme M, Robert E, Lerondel S, et al. ROS implication in a new antitumor strategy based on non-thermal plasma. Int J Cancer. 2012;130:2185–2194.
24. Shashurin A, Keidar M, Bronnikov S, Jurjus RA, Stepp MA. Living tissue under treatment of cold plasma atmospheric jet, Appl Phys Lett. 2008;92:181501.
25. Georgescu N, Lupu AR. Tumoral and normal cells treatment with high-voltage pulsed cold atmospheric plasma jets. IEEE Trans Plasma Sci. 2010;38:1.
26. Zirnheld JL, Zucker SN, DiSanto TM, Berezney R, Etemadi K. Nonthermal plasma needle: development and targeting of melanoma cells. IEEE Trans Plasma Sci. 2010;38:948.
27. Vandamme M, Robert E, Pesnel S, et al. Antitumor effect of plasma treatment on U87 glioma xenografts: preliminary results. Plasma Process Polym. 2010;7:264–273.
28. Isbary G, Morfill G, Schmidt H-U, et al. A first prospective randomized controlled trial to decrease bacterial load using cold atmospheric argon plasma on chronic wounds in patients. British J Dermatol. 2010;163:78–82.
29. Kim K, Choi JD, Hong YC, et al. Atmospheric-pressure plasma-jet from micronozzle array and its biological effects on living cells for cancer therapy. Appl Phys Lett. 2011;98:073701 3 pp.
30. Morfill1 GE, Shimizu T, Steffes B, Schmidt H-U. Nosocomial infections—a new approach towards preventive medicine using plasmas. New J Phys. 2009;11:115019 10 pp.
31. Shashurin A, Shneider MN, Dogariu A, Miles RB, Keidar M. Temporary-resolved measurement of electron density in small atmospheric plasmas. Appl Phys Lett. 2010;96(17):171502.
32. Park J, Henins I, Herrmann HW, Selwyn GS, Hicks RF. Discharge phenomena of an atmospheric pressure radio-frequency capacitive plasma source. J Appl Phys. 2001;89:20–28.
33. Lu X, Laroussi M. Dynamics of an atmospheric pressure plasma plume generated by submicrosecond voltage pulses. J Appl Phys. 2006;100:063302 6 pp.
34. Ostrikov K. Colloquium: Reactive plasmas as a versatile nanofabrication tool, Rev Mod Phys. 2005;77:489.
35. Laroussi M. The biomedical applications of plasma: a brief history of the development of a new field of research. IEEE Trans Plasma Sci. 2008;36(4):1612–1614.
36. Shneider MN, Miles RB. Microwave diagnostics of small plasma objects, J Appl Phys. 2005;98:033301.
37. Zhang Z, Shneider MN, Miles RB. Microwave diagnostics of laser-induced avalanche ionization in air, J Appl Phys. 2006;100:074912.
38. Zhang Z, Shneider MN, Miles RB. Coherent microwave rayleigh scattering from resonance-enhanced multiphoton ionization in argon, Phys Rev Lett. 2007;98:265005.
39. Brok WJM, Bowden MD, van Dijk J, van der Mullen JJAM, Kroesen GMW. Numerical description of discharge characteristics of the plasma needle. J Appl Phys. 2005;98(1):013302.
40. Sakiyama Y, Graves DB. Finite element analysis of an atmospheric pressure RF-excited plasma needle. J Phys D Appl Phys. 2006;39(16):3451–3456.
41. Sakiyama Y, Graves DB. Corona-glow transition in the atmospheric pressure RF-excited plasma needle. J Phys D Appl Phys. 2006;39(16):3644–3652.
42. Sakiyama Y, Graves DB. Nonthermal atmospheric rf plasma in one-dimensional spherical coordinates: asymmetric sheath structure and the discharge mechanism. J Appl Phys. 2007;101(7):073306.
43. Shi F, Wang D, Ren C. Simulations of atmospheric pressure discharge in a high-voltage nanosecond pulse using the particle-in-cell Monte Carlo collision model in noble gases. Phys Plasmas 2008.
44. Hong YJ, Lee SM, Kim GC, Lee JK. Modeling high-pressure microplasmas: comparison of fluid modeling and particle-in-cell Monte Carlo Collision modeling. Plasma Proc Polym. 2008;5:583–592.
45. Iza F, Walsh J, Kong MG. From submicrosecond to nanosecond pulsed atmospheric-pressure plasmas. IEEE Trans Plasma Sci. 2009; in press.
46. Xiong Z, Robert E, Sarron V, Pouvesle J-M, Kushner MJ. Dynamics of ionization wave splitting and merging of atmospheric pressure plasmas in branched dielectric tubes and channels. J Phys D. 2012;45:275201.
47. Xiong Z, Kushner MJ. Atmospheric pressure ionization waves propagating through a flexible capillary channel and impinging upon a target. Plasma Source Sci Technol. 2012;21:034001.
48. Shashurin A, Shneider MN, Dogariu A, Miles RB, Keidar M. Appl Phys Lett. 2009;94:231504.
49. Rizzi PA. Microwave Engineering: Passive Circuits Englewood Cliffs, NJ: Prentice Hall; 1988.
50. Liao SY. Microwave Devices and Circuits Englewood Cliffs, NJ: Prentice Hall; 1980.
51. Sutton WH. Microwave Processing of Ceramic Materials, Ceram Bull. 1989;68:376.
52. Shashurin A, Shneider MN, Keidar M. Measurements of streamer head potential and conductivity of streamer column in the cold nonequilibrium atmospheric plasmas. Plasma Source Sci Technol. 2012;21:034006.
53. Raizer YP, Milikh GM, Shneider MN, Novakovski SV. Long streamers in the upper atmosphere above thundercloud, J Phys D Appl Phys. 1998;31:3255.
54. Gurtner G, Werner S, Barrandon Y, Longaker MT. Wound repair and regeneration. Nature. 2008;453:314.
55. Hynes RO. Integrins: a family of cell surface receptors. Cell. 1987;48(4):549–554.
56. Fridman A. Plasma Chemistry New York, NY: Cambridge University Press; 2008; pp. 157–257.
57. Lu X, Cao Y, Yang P, et al. An RC plasma device for sterilization of root canal of teeth. IEEE Trans Plasma Sci. 2009;37(5):668–673.
58. Stoffels E, Kieft IE, Sladek REJ, Van den Bedem LJM, Van der Laan EP, Steinbuch M. Plasma needle for in vivo medical treatment: recent developments and perspectives. Plasma Sources Sci Technol. 2006;15:S169–S180.
59. Zhang X, Li M, Zhou R, Feng K, Yang S. Ablation of liver cancer cells in vitro by a plasma needle. Appl Phys Lett. 2008;92:021502 3 pp.
60. Shashurin A, Stepp MA, Hawley TS, et al. Influence of cold plasma atmospheric jet on surface integrin expression of living cells. Plasma Process Polym. 2010;7:294–300.
61. Shashurin A, Keidar M, Bronnikov S, Jurius RA, Stepp MA. Living tissue under treatment of cold plasma atmospheric jet. Appl Phys Lett. 2008;93:181501.
62. Bokel C, Brown NH. Integrins in development: moving on, responding to, and sticking to the extracellular matrix. Dev Cell. 2002;3(3):311–321.
63. Humphries JD, Byron A, Humphries MJ. Integrin ligands at a glance. J Cell Sci. 2006;119(19):3901–3903.
64. Yuspa SH, Hawley-Nelson P, Koehler B, Stanley JR. A survey of transformation markers in differentiating epidermal cell lines in culture. Cancer Res. 1980;40:4694–4703.
65. Jurjus RA, Liu Y, Pal-Ghosh S, Tadvalkar G, Stepp MA. Primary dermal fibroblasts derived from sdc-1 deficient mice migrate faster and have altered integrin function. Wound Repair Regenerat. 2008; in press.
66. In: http://www.sas.com/.
67. Hynes RO. Integrins: bidirectional, allosteric signaling machines. Cell. 2002;110(6):673–687.
68. LaFlamme SE, Nieves B, Colello D, Reverte CG. Integrins as regulators of the mitotic machinery. Current Opin Cell Biol. 2008;20(5):576–582.
69. Harburger DS, Calderwood DA. Integrin signalling at a glance. J Cell Sci. 2009;122(Pt 2):159–163.
70. Volotskova O, Shashurin A, Stepp MA, Pal-Ghosh S, Keidar M. Plasma-controlled cell migration: localization of cold plasma–cell interaction region. Plasma Med. 2010;1(1):83–93.
71. Clark RAF. The Molecular and Cellular Biology of Wound Repair second ed. New York and London: Plenum Press; 1996; pp. 311–338.
72. Volotskova O, Stepp MA, Keidar M. Integrin activation by a cold atmospheric plasma jet. New J Phys. 2012;14:053019.
73. Gipson IK, Spurr-Michaud S, Argueso P, Tisdale A, Fong NgT, Leigh Russo C. Mucin gene expression in immortalized human corneal–limbal and conjunctival epithelial cell lines. Invest Ophthalmol Visual Sci. 2003;44(6):2496–2506.
74. Mould AP, Askari JA, Barton S, et al. Integrin activation involves a conformational change in the alpha 1 helix of the beta subunit A-domain. J Biol Chem. 2002;277:19800–19805.
75. De Toni-Costes F, Despeaux M, Bertrand J, et al. A new alpha5beta1 integrin-dependent survival pathway through GSK3beta activation in leukemic cells. PLoS One. 2010;23 5(3):e9807.
76. Humphries J, Wang P, Streuli C, Geiger B, Humphries MJ, Ballestrem C. Vinculin controls focal adhesion formation by direct interactions with talin and actin. J Cell Biol. 2007;179(5):1043–1057.
77. Stepp MA. Corneal integrins and their functions. Exp Eye Res. 2006;83:3–15.
78. Bazzoni G, Ma L, Blue ML, Hemler ME. Divalent cations and ligands induce conformational changes that are highly divergent among b1 integrins. J Biol Chem. 1998;273:6670–6678.
79. Danen EHJ, Van Rheenen J, Franken W, et al. Integrins control motile strategy through a Rho–cofilin pathway. J Cell Biol. 2005;169:515–526.
80. Byron A, Morgan MR, Humphries MJ. Adhesion signalling complexes. Current Biol. 2010;20:R1063–1067.
81. Shemesh T, Geiger B, Bershadsky AD, Kozlov MM. Focal adhesion as mechanosensors: a physical mechanism. PNAS. 2005;102:12383–12388.
82. Kong MG, Keidar M, Ostrikov K. Plasmas meet nanoparticles—where synergies can advance the frontier of medicine. J Phys D Appl Phys. 2011;44:174018 14pp.
83. Weisel JW, Nagaswami C, Vilaire G, Bennett JS. Examination of the platelet membrane glycoprotein IIb–IIIa complex and its interaction with fibrinogen and other ligands by electron microscopy. J Biol Chem. 1992;267:16637–16643.
84. Keidar M, Beilis II, Boxman RL, Goldsmith S. Nonstationary macroparticle charging in an arc plasma jet. IEEE Trans Plasma Sci. 1995;23:902–908.
85. Stoffels E, Flikweert AJ, Stoffels WW, Kroesen GMW. Plasma needle: a non-destructive atmospheric plasma source for fine surface treatment of (bio)materials. Plasma Source Sci Technol. 2002;11:383.
86. M. Kong, Plasma medicine—opportunities and challenges for science and healthcare, plenary talk, in: 36th International Conference on Plasma Science, San Diego, CA, 2009.
87. Georgescu N, Lupu AR. Tumoral and normal cells treatment with high-voltage pulsed cold atmospheric plasma jets. IEEE Trans Plasma Sci. 2010;38:1949–1956.
88. Kim JY, Kim SO, Wei Y, Li J. Flexible cold microplasma jet using biocompatible dielectric tubes for cancer therapy. Appl Phys Lett. 2010;96:203701.
89. Vandamme M, Robert E, Pesnel S, et al. Antitumor effect of plasma treatment on U87 glioma xenografts: preliminary results. Plasma Proc Polym. 2010;7:264–273.
90. M. Vandamme, E. Robert, S. Lerondel, V. Sarron, D. Ries, S. Dozias, et al., ROS implication in a new antitumor strategy based on non-thermal plasma, 130 (2012) 2185–2194.
91. Volotskova O, Hawley TS, Stepp MA, Keidar M. Targeting the cancer cell cycle by cold atmospheric plasma. Sci Rep. 2012;2:636.
92. Lord CJ, Ashworth A. The DNA damage response and cancer therapy. Nature. 2012;481:287–294.
93. Connell PP, Hellman S. Advances in radiotherapy and implications for the next century: a historical perspective. Cancer Res. 2009;69:383–392.
94. T. Tsuruo, M. Naito, A. Tomida, N. Fujita, T. Mashima, H. Sakamoto, et al., Molecular targeting therapy of cancer: drug resistance, apoptosis and survival signal, Cancer Sci. 94 (2003) 15–21.
95. Schwartz GK, Shah MA. Targeting the cell cycle: a new approach to cancer therapy. J Clin Oncol. 2005;23:9408–9421.
96. Furchgott RF. Endothelium-derived relaxing factor: discovery, early studies, and identification as nitric oxide (nobel lecture). Angew Chem Int Ed. 1999;38:1870.
97. Kieft IE, Kurdi M, Stoffels E. Reattachment and apoptosis after plasma-needle treatment of cultured cells. IEEE Trans Plasma Sci. 2006;34:1331–1336.
98. Lippens S, Denecker G, Ovaere P, Vandenabeele P, Declercq W. Death penalty for keratinocytes: apoptosis versus cornification. Cell Death Differ. 2005;12:1497–1508.
99. Suter MM, Schulze K, Bergman W, Welle M, Roosje P, Müller EJ. The keratinocyte in epidermal renewal and defence. Vet Dermatol. 2009;20:515–532.
100. Jurjus RA, Liu Y, Pal-Ghosh S, Tadvalkar G, Stepp MA. Primary dermal fibroblasts derived from sdc-1 deficient mice migrate faster and have altered αv integrin function. Wound Rep Reg. 2008;16:649–660.
101. Hennings H, Michael D, Yuspa S. Response of carcinogen-altered mouse epidermal cells to phorbol ester tumor promoters and calcium. J Invest Dermatol. 1987;88:60–65.
102. Sonnenschein C, Soto AM. The death of the cancer cell. Cancer Res. 2011;71:4334–4337.
103. Smithers DW. Cancer: an attack of cytologism. Lancet. 1962;1:493–499.
104. Tannok IF, Hill RP, Bristow RG, Harrington L. The Basic Science of Oncology fourth ed. New York, NY: McGraw-Hill; 1998; pp. 77–100, 167–194, 205–231.
105. Ames BH, Catchcart R, Schwiers E, Hochtein P. Uric acid provides an antioxidant defense in humans against oxidant and radical-caused aging and cancer: a hypothesis. PNAS. 1981;78:6858–6862.
106. Hanahan D, Weinberg RA. Hallmarks of cancer: the next generation. Cell. 2011;144:646–674.
107. Nowell P. Mechanisms of tumor progression. Cancer Res. 1986;46:2203–2207.
108. Heppner GH, Miller FR. The cellular basis of tumor progression. Int Rev Cytology. 1998;177:1–56.
109. Schreiber RD, Old LJ, Smyth MJ. Cancer immunoediting: integrating immunity’s roles in cancer suppression and promotion. Science. 2011;331:1565–1570.
110. Longo DL, Longo D. Harrison’s Hematology and Oncology New York, NY: McGraw-Hill Medical; 2010; pp. 294–318.
111. Malumbres M, Barbacid M. Cell cycle, CDKs and cancer: a changing paradigm. Nat Rev Cancer. 2009;9:153–166.
112. Folks JL, Chhikar RS. The inverse Gaussian distribution and its statistical application—a review. J Royal Stat Soc Ser B. 1978;40(3):263–289.
113. Bonner WM, Redon CE, Dickey JS, et al. GammaH2AX and cancer. Nat Rev Cancer. 2008;8:957–967.
114. Marti TM, Hefner E, Feeney L, Natale V, Cleaver JE. H2AX phosphorylation within the G1 phase after UV irradiation depends on nucleotide excision repair and not DNA double-strand breaks. PNAS. 2006;103:9891–9896.
115. Zhao H, Dobrucki J, Rybak P, Traganos F, Halicka HD, Darzynkiewicz Z. Induction of DNA damage signaling by oxidative stress in relation to DNA replication as detected using “Click Chemistry”. Cytometry Part A. 2011;79A:897–902.
116. Svetlova MP, Solovjeva LV, Tomilin NV. Mechanism of elimination of phosphorylated histone H2AX from chromatin after repair of DNA double-strand breaks. Mutation Res. 2010;685:54–60.
117. Ward IM, Chen J. Histone H2AX is phosphorylated in an ATR-dependent manner in response to replicational stress. J Biol Chem. 2001;276:47759–47762.
118. A. Shashurin, M.N. Shneider, A. Dogariu, R.B. Miles, M. Keidar, Temporary-resolved measurement of electron density in small atmospheric plasmas, Applied Physics Letters 96 (17) (2010) 171502.
119. A. Shashurin, M.N. Schneider, A. Dogariu, R.B. Miles, M. Keidar, Temporal behavior of cold atmospheric plasma jet, Applied Physics Letters 94 (235104) (2009).