Although this book is very Python-centric, we should not forget that the core of Panda3D is written in C++. Additionally, it is possible to extend the engine with our own native libraries. Not only that, but we're even able to drop Python and write our games in pure C++.
Even if we intend to write our games completely in Python, there might be this one occasion coming up in the future where we wished we had read the recipe about using the C++ debugger of Visual Studio 2008. The following recipe will prepare us for this situation, even if it is unlikely to occur.
In this recipe, you are going to debug the C++ code you created in Creating a scene using C++ found in Chapter 2, Creating and Building Scenes. For this to work, you need to add the property sheet containing your project settings to the Debug configuration just as you did for the Release configuration.
To be able to debug the code of the Panda3D engine on top of your own source code, you will need a debug build of the engine. If you want to use the release runtime from the installer package and just want to debug your own code, you need to apply the following workaround to be able to produce a debug build of your program:
- Search for the string
python26_d.lib. - Replace any occurrence of it with
python26.lib.
The Visual Studio 2008 C++ debugger is a powerful tool. Let's see what can be done with it:
- Load the project in Visual Studio 2008 and open the file
main.cpp. - Place a new breakpoint in the line shown in the following screenshot by left-clicking the grey area to the left of the source code editor:

- Right-click the breakpoint and select Condition:

- In the Breakpoint Condition window, tick the Condition checkbox and enter the string win != 0 into the textbox and confirm your input by clicking OK:

- Right-click the breakpoint and select Hit Count:
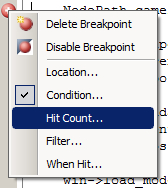
- In the Breakpoint Hit Count window, choose the settings shown in the following screenshot and click OK:

- Right-click the breakpoint again and select When Hit:

- Tick the checkbox next to Print a message: in the When Breakpoint Is Hit window:

- Start the debug session by clicking the toolbar button shown in the following screenshot, or by pressing F5:

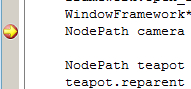
- Wait until the breakpoint is hit. If the program is halted at a breakpoint it is marked with a little arrow:
- Use the toolbar buttons shown next to continue and halt the program, to stop debugging, restart the program, and to step through the code line by line. Click your way through the buttons and watch the results. Your actions may cause the program to stop, which will also cause the debugging session to end. In that case, just start the program again.

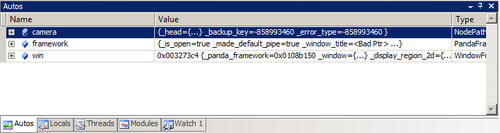
- While stepping through the code, observe the areas at the bottom of the screen. Autos shows recently accessed or changed variables:
- Locals lets you observe all variables in the current local scope:

- The Call Stack area shows which function calls led to the current point of execution:

- Breakpoints lists all active breakpoints as well as the conditions that need to be fulfilled to trigger them:

- The Output area shows the debug text and console output of the program:

Compared to the textmode debugger for Python, presented in the recipe found right before this one, the workflow doesn't differ too much. Basically, it's only the interface that differs drastically.
What we do with the tool is absolutely the same though. We set a breakpoint, define conditions that need to be fulfilled for triggering it, and create an action that prints a diagnostic message to the output window. While we are stepping through the code, we are watching variables as they change in the Autos and Locals windows. The Call Stack window shows us how we got to where we currently are in the program flow, the Breakpoints window is there to manage the breakpoints that are possibly scattered throughout the code of our game or library, and the Output window prints diagnostics and log messages.