Table 20-2 and Table 20-3 provide an overview of different components and their respective logging capabilities.
Table 20-2. UCCP Logging
LOCATION OF LOG | HOW TO ENABLE LOGGING | |
|---|---|---|
Office Communicator | %USERPROFILE% racing | [HKEY_CURRENT_USERSoftwareMicrosoftTracinguccpCommunicator] "EnableFileTracing"= DWORD:00000001 |
Microsoft Office Live Meeting Console | %USERPROFILE% racing | [HKEY_CURRENT_USERSoftwareMicrosoftTracinguccpLiveMeeting] "EnableFileTracing"= DWORD:00000001 |
Office Communicator Attendant | %USERPROFILE% racing | [HKEY_CURRENT_USERSoftwareMicrosoftTracinguccapiAttendant] "EnableFileTracing"= DWORD:00000001 |
Office Communications Server | As configured by Office Communications Server 2007 R2 Logging Tool | Use Office Communications Server 2007 R2 Logging Tool |
Table 20-3. Media Logging
COMPONENT | LOCATION OF LOG | HOW TO ENABLE LOGGING |
|---|---|---|
Office Communicator | %USERPROFILE% racingWPPMedia | [HKEY_CURRENT_USERSoftwareMicrosoftTracingWPPMediaDebugUI] "TraceLevelThreshold" = DWORD:00000101 "WPP_FLAG_S_DEBUGUI_AEC_PCM" = DWORD:00000001 |
Office Live Meeting Console | %USERPROFILE% racingWPPMedia | [HKEY_CURRENT_USERSoftwareMicrosoftTracingWPPMediaDebugUI] "TraceLevelThreshold" = DWORD:00000101 "WPP_FLAG_S_DEBUGUI_AEC_PCM" = DWORD:00000001 |
Office Communicator Attendant | %USERPROFILE% racingWPPMedia | [HKEY_CURRENT_USERSoftwareMicrosoftTracingUcClientAttendant] "EnableTracing" = DWORD:00000001 |
Office Communications Server | As configured by Ofice Communications Server 2007 R2 Logging Tool | Use Office Communications Server 2007 R2 Logging Tool |
Note
In Microsoft Windows Vista, the user account that captures media logs must belong to the local Performance Log Users group.
Both Office Communications Server and Office Communicator use the Windows Trace Pre-processor (WPP) utility that is part of the operating system. The client manages this itself and stores logs based on a check box in the user interface (UI). This also drives one of several registry keys. The server stores logs based on the tracing tool provided in the MMC snap-in. Although these logs are extremely useful, they also contain a great deal of detailed information—much of which might not pertain to any problem or issue that is being investigated or analyzed. The following sections introduce tracing and offer some basic insights into looking through logs. Other sections in this chapter about debugging and diagnostics delve into the more technical details that are included in tracing log files.
As of the Office Communicator 2007 release, Office Communicator logging can be controlled by using the General menu that is accessed by clicking Tools and then Options. Two check boxes in the General dialog box control logging and event log messages. Refer to Figure 20-1 earlier in this chapter to view this dialog box. All protocol messages that are used in the remainder of this section were captured by enabling logging in Office Communicator and gathering protocol messages from the log.
Values under the registry key HKCUSoftwareMicrosoftTracingUccpCommunicator are used for Office Communicator log configuration. Table 20-4 provides an overview of important registry keys that enable Office Communicator logging.
Table 20-4. Trace Settings
REGISTRY KEY | DESCRIPTION | VALUE |
|---|---|---|
EnableFileTracing | Enables and disables Office Communicator tracing | 0 To turn logging off (default) 1 To turn logging on |
MaxFiles | Defines the number of log files that Office Communicator will create when tracing is enabled | 2 Default |
MaxFileSize | Determines how large the log file can get before it is cleared and starts over | 0x800000 (~8.3 MB) Default |
FileDirectory | Determines the directory where log files will be stored | %USERPROFILE%Tracing Default |
Default settings create the log in %USERPROFILE% racingCommunicator-uccapi-0. uccapilog, which is generally located in C:Documents and Settings<username> racing Communicator-uccapi-0.uccapilog on a computer running the Microsoft Windows XP operating system. As previously mentioned, default settings create two log files with up to approximately 8.3 megabytes (MB) of logs for each. After the first file (mentioned earlier) fills up, the second file, Communicator-uccapi-1.uccapilog, is used. After the second file fills up, its content overwrites the first log file, and the second file will clear itself and add new content until it runs out of space and overwrites the first log file again.
Note
Be aware of your logging settings. If logging is run for too long, it can be difficult to find the data that you need, and (if there is a lot of network activity) important data might eventually be overwritten. It is important to limit the time when logging is enabled and to avoid logging during actions that create large amounts of traffic (such as an initial logon) unless necessary. For ease of use during an investigative session, increasing the MaxFileSize value (0 × 2000000 allows for ~33.5 MB) and setting MaxFiles to 1 allows larger amounts of data to be analyzed in a single file.
Learning to effectively view trace files can be an involved process as you learn what to look for and what can be safely ignored. Trace files contain protocol data as well as internal programmer logs that can make them difficult to decipher at first. Using tools such as findstr.exe, grep.exe, and qgrep.exe makes it easier to scan through trace files if you know what you are looking for. For more information about advanced tools for reviewing log files, see the sections titled "Using ClientLogReader" and "Using Snooper" later in this chapter. In general, few problems require searching the raw logs, and using the Snooper or ClientLogReader tools is a much faster way to gather diagnostic information.
Note
If you configure logging to allow it, log files can grow to 20 MB or more for an active client. Logs of this size will not load easily in Notepad. Therefore, other editors should be used such as WordPad, Emacs, or Vi. Tools such as ClientLogReader and Snooper are discussed later in this chapter and are specifically built to interpret and quickly display information from these log files.
The first thing to understand is the structure of the log. The following is an example of one line from the log file.
07/13/2007|11:13:51.203 A38:82C TRACE ::
CUccSubscriptionEventInfo::GetOperationInfo - enter [0x04356808]
The first 10 characters always contain the date, with a "|" character separating it from the next 12 characters that contain the time. A space separates the time and the next field, which is always seven characters and represents the thread that logged the message (normally a single thread). A space separates the thread ID from the next five characters that identify the type of log (for example, TRACE, INFO, WARN, ERROR). A space, two colons (::), and a space then separate the log type from the content of the log. In the previous example, CUccSubsc riptionEventInfo::GetOperationInfo - enter [0x04356808] is the content. Because of this rigid formatting, it is much easier to write scripts and tools to parse the log files.
The TRACE log type is generally only of interest to the product development team and product support. INFO logs are informational and can be of interest, but they can also provide more detail than necessary and create confusion. WARN logs highlight warnings to indicate that a problem might exist or to indicate that an issue might be handled by other components. ERROR logs highlight errors, although some of these errors more closely resemble warnings. Therefore, if the ERROR logs do not make sense, you can probably ignore them. Most problematic errors eventually show up as INFO or ERROR logs that are more meaningful and understandable.
On the Companion Media
To simplify things, the ClientLogReader script or the Snooper tool (which are included on the companion media in the Office Communicator Server 2007 R2 Resource Kit Tools) can both help with reading Office Communicator 2005 and Office Communicator 2007 R2 trace logs instead of having to manually search the log file. The Snooper tool, which is explained later in this chapter, can be launched from the server MMC and is a viewer for server logs. However, it can also load the client trace file to look at protocol messages in a summary and in full view.
When common problems occur, the logs provide useful information. The Practical Extraction and Report Language (PERL) script ClientLogReader from the Office Communications Server 2007 R2 Resource Kit Tools helps diagnose these problems. ClientLogReader has to be run from a computer that has PERL already installed. This tool (also available on the companion media) sifts through the client logs and identifies problem records in a meaningful way. The tool can be used to analyze a log file and point out potential problems as well as to show all protocol messages in full or summary mode. The following examples of using the script (with the resulting data trimmed for brevity) introduce the script’s capabilities and the output that can be expected.
C:Documents and SettingsJeremyTracing>perl clientlogreader.pl -help

Version: 1.0, Last Update: 07JUN2006
USAGE:
perl clientLogReader.pl [-f fileToProcess] [-protocol] [-protocolSummary]
[-tail]
    fileToProcess - if not specified input is taken from standard input
      the file to process - can contain wildcards
    -protocol - SIP protocol messages will all be output along with hints
    -protocolSummary - SIP protocol messages will have start lines displayed
    -tail - log file will be watched if it grows and/or is recreated
EXAMPLE:
  perl clientLogReader.pl -f lcapi*.log -protocolSummary
  perl clientLogReader.pl -f lcapi*.log -protocol
  perl clientLogReader.pl -f lcapi4.log -tail

Look in the README.txt file for this tool for more help and examples

C:Documents and SettingsJeremyTracing> perl clientlogreader.pl
-f Communicator-uccp-0.uccplog WARNING: DNS resolution failed for oldserver.
litwareinc.com because the hostname wasn't found (WSANO_DATA)

C:Documents and SettingsJeremyTracing> perl clientlogreader.pl
    -f Communicator-uccp-0.uccplog -protocol INFO: Incoming from 192.168.1.100:443
(via 192.168.1.103:2780)
$$$begin-message$$$
...
$$$end-message$$$
INFO: Outgoing to 192.168.1.100:443 (via 192.168.1.103:2780)
$$$begin-message$$$
...
$$$end-message$$$
...

C:Documents and SettingsJeremyTracing> perl clientlogreader.pl
    –f Communicator-uccp-0.uccplog -protocolSummary INFO: Outgoing to
192.168.1.100:443 (via 192.168.1.103:2780)
        SUBSCRIBE sip:sip.litwareinc.com:443;transport=tls;lr;ms-route-sig=hu4T8Jd65_
O8xKIjN1aUGxssauUPBSsbQNNOYHwAAA SIP/2.0
INFO: Incoming from 192.168.1.100:443 (via 192.168.1.103:2780)
        SIP/2.0 200 OK
...
The –tail option is not shown in the preceding example, but it enables a log file that is being written by Office Communicator to be analyzed and its output data to be shown as Office Communicator runs. This can be especially useful for detecting problems or protocol failures daily in the summary view that might otherwise be hidden or go unnoticed.
Server tracing changed significantly with the release of Office Communications Server 2007, and logging can now be initiated and configured, and files can be viewed directly from the MMC. The logging infrastructure is now using WPP instead of the flat-file logging component used in the past. This update results in all client and server traces being logged with the same mechanism and enables remote and interactive logging of server components across the topology. It is now also possible to filter by server component as well as by user and server when looking for logs to reduce processing time and the volume of logs created when specific debugging is in process.
You can open the Office Communications Server 2007 R2 Logging Tool by right-clicking the node that corresponds to the server’s short name, clicking Logging Tool, and then clicking New Debug Session, as shown in Figure 20-10.

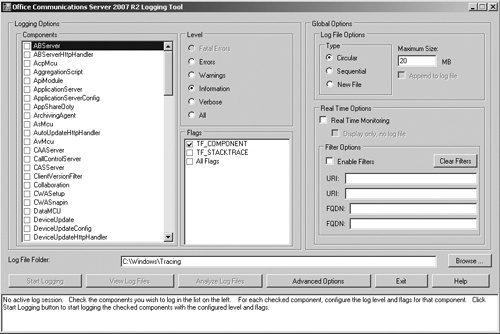
The Logging Tool shown in Figure 20-11 contains a large set of features in one tool to make it easy to learn and then apply across topologies and technologies. The features include:
Starting and stopping logging
Enabling and disabling logging individually by server component
Enabling various logging types (flags) within each server component
Enabling various logging levels within each server component
Controlling logging options
Defining specific log file options, such as recycling type and maximum size
Formatting information for the log prefix, buffering, and clock resolution
Enabling real-time monitoring instead of only log-based mechanisms
Enabling user Uniform Resource Identifier (URI) and server FQDN filtering of protocol logs
Viewing and analyzing the log directly by using the Snooper tool (if the Office Communications Server 2007 R2 Resource Kit Tools have been installed)
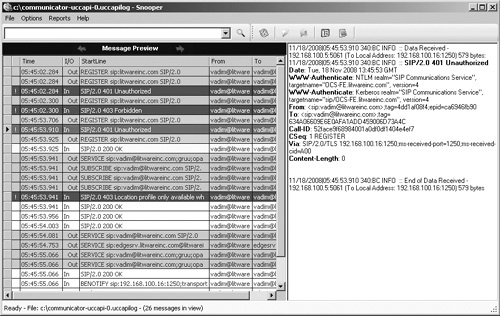
Snooper is included in the Office Communications Server 2007 R2 Resource Kit Tools. It can show protocol summaries and enable full-message text to be displayed. It can load all server and client logs and identify errors by looking up user information in the archiving database (if one exists). Snooper can also look up conferencing and presence reports for individual users and conferences and health reports for MCUs, and it can display users who have more than a specified number of contacts or permission settings. An example of Snooper with a client log loaded is shown in Figure 20-12. For more information about the Snooper tool, see the section titled "Using Snooper" later in this chapter.
After the Office Communications Server 2007 R2 Logging Tool is launched (refer to Figure 20-10 and Figure 20-11 earlier in this chapter), a few steps must be taken to gather a server trace log. In this example, a SIP stack log is collected into a log file. To do this, only the SIPStack component check box should be selected, all levels and flags should be enabled, logging to C:WindowsTracing should be left as the default, and no real-time options should be selected (no active display or filtering of the content). For reference, the Flags section identifies subcomponents that log information if they are enabled, thereby allowing protocol, diagnostic information, connection level, or other details to be logged or ignored (for SIPStack) to prevent the trace logs from being overwhelmed by too much information if a precise area of the server must be investigated. After this configuration is selected, the dialog box should appear, as shown in Figure 20-13.

After the tracing configuration is set, select the Start Logging menu item to begin logging for the server. If you want to, you can enable real-time monitoring to show the log output in a console as it occurs or to show the console output and log to the log file as normal. After the network or communication actions of interest are complete, you can select the Stop Logging menu item to finish logging and prepare the text trace log. Finally, you can click the View Log Files menu and view the text files (in Notepad), or you can click Analyze Log Files to see a summary view of the protocol messages in Snooper. This assumes that the Office Communications Server 2007 R2 Resource Kit Tools are already installed. Note that log files can contain errors and other issues that will not show up in protocol logs, so be aware that the way in which you view the log files can make it easy for you to forget that errors might exist.
Note
Remember that log files larger than 20 MB will not load easily in Notepad and that you will need to use other editors such as WordPad, Emacs, or Vi. Snooper is specifically built to interpret and quickly display information from these log files, but it does not show all of the details that can be seen if the log file is interpreted directly.
The Real Time Monitoring option can enable a text window that shows the logs as they occur, and filters can be enabled to prevent logs that do not pertain to specific users or servers from showing. This capability is useful when working on a busy server because it can reduce the amount of data that scrolls past on the display.
For more information about the Logging Tool, see the product documentation. Most of the remaining features on the Options menu are of interest only during an engagement with product support.
Direct from the Source: Using Trace Filters to Diagnose a Problem on a Busy Server
Senior Software Design Engineer
Logs collected by the Office Communications Server 2007 R2 Logging Tool are valuable but can quickly become very large on a busy server. For example, a Standard Edition Server that hosts thousands of users could log 1 MB or more per second of SIP message data. If the problem being investigated requires logging to be enabled for more than a few minutes, the resultant log files might be several gigabytes in size. Such log files are difficult to view and manipulate and might impact server performance because of the disk space that they consume. Fortunately, most problems can be isolated to one or two users or, in the case of an Edge proxy server, one or two peer servers. The filter options that the Office Communications Server 2007 R2 Logging Tool supports can thus be used to greatly reduce the size of log files on a busy server. The following sections discuss problems that have been seen in customers’ live deployments of Office Communications Server 2007 and its predecessor, Office Live Communications Server 2005 with Service Pack 1 (SP1).
Scenario: Incorrectly Configured Firewall Causes Intermittent Failure of IMs to Users in a Federated Partner
In this scenario, one or more users in a large company have called the help desk and reported intermittent failures when sending and receiving instant messages from users in another company. Routing between the two companies is achieved by federation between their respective Edge proxy servers. The local Edge proxy routes traffic to many federated partners and public IM connectivity (PIC) providers, so hundreds or thousands of SIP messages per second might pass through the Edge proxy.
Simply running the Office Communications Server 2007 R2 Logging Tool on the local Edge proxy will quickly result in very large log files. Instead, enter the FQDN of the Edge proxy server for the federated partner in the first FQDN field under Filter Options and then select the Enable Filters check box, as shown in Figure 20-14.

When logging is started, only SIP messages and related events that originate from, or are destined to, the FQDN of interest appear in the trace log. All other data is ignored, resulting in a small and focused log file. In this particular scenario, the remote Edge proxy server appears to be dropping the Mutual Transport Layer Security (MTLS) connection. This manifests itself as TF_CONNECTION and TF_DIAGNOSTIC messages at the TL_ERROR level in the trace log, as shown in the following example.
TL_ERROR(TF_CONNECTION) [0]0B90.07F8::09/05/2007-07:06:29.805.00000088
$$begin_record
LogType: connection
Severity: error
Text: Receive operation on the connection failed
Local-IP: 10.0.0.13:1142
Peer-IP: 10.0.0.10:5061
Peer-FQDN: sip.contoso.com
Peer-Name: sip.contoso.com
Connection-ID: 0x502
Transport: M-TLS
Result-Code: 0x80072746 WSAECONNRESET
$$end_record
TL_ERROR(TF_DIAG) [0]0B90.07F8::09/05/2007-07:06:31.991.0000008d
$$begin_record
LogType: diagnostic
Severity: error
Text: Message was not sent because the connection was closed
SIP-Start-Line: MESSAGE sip:[email protected];opaque=user:epid:
G-AWNAmf8Vqf8tSG2CexVwAA;gruu SIP/2.0
SIP-Call-ID: a524eda4c75e49e58a3777d0478d49a8
SIP-CSeq: 7 MESSAGE
Peer: sip.contoso.com:5061
$$end_record
Furthermore, the MTLS connection is being dropped at a regular interval of every 30 seconds or so.
TL_ERROR(TF_DIAG) [0]0B90.07F8::09/05/2007-07:07:01.871.00000094
$$begin_record
LogType: diagnostic
Severity: error
Text: Message was not sent because the connection was closed
SIP-Start-Line: MESSAGE sip:[email protected];opaque=user:epid:
G-AWNAmf8Vqf8tSG2CexVwAA;gruu SIP/2.0
SIP-Call-ID: 75e49e58a3777d0478d49aa524eda4c8
SIP-CSeq: 9 MESSAGE
Peer: sip.contoso.com:5061
$$end_record
The most likely cause of this problem is a firewall that is not correctly configured for SIP traffic, thereby causing it to drop connections when they are idle for 30 seconds. This process is typical of many firewalls and load balancers in which the default configuration assumes a protocol such as HTTP rather than SIP.
Microsoft Office Communicator Mobile devices are based on the Microsoft Windows CE operating system. To collect traces, device logging must first be enabled.
To enable logging on Office Communicator Mobile, click Menu, select Options, and then click General. Select Turn On Logging. You can find the log files in the My DeviceTracing folder.
Microsoft Office Communicator Phone Edition devices are based on the Windows CE operating system. To collect traces, device logging must first be enabled and only then can log files be submitted to Office Communications Server 2007 R2 Update Server. Log files cannot be viewed from the device itself, and Office Communications Server 2007 R2 Update Server provides infrastructure for files to be uploaded and then later retrieved for viewing as necessary.
To enable logging on Office Communicator Phone Edition, click the Settings tab and then select the Set Logging option. After logging has been enabled, send log files by selecting Send Logs.
To read the uploaded log files, you must use Readlog.exe, which comes with Windows CE Platform Builder. Log files have a .clg extension, and you can find them in the Office Communications Server 2007 R2 Update Server Logs folder. For more information about Readlog.exe, see http://go.microsoft.com/fwlink/?LinkID=133753.
To extract the contents of the .clg file to a text file, use the -v (verbose) print option when you run Readlog.exe, as shown in the following example:
readlog.exe -v CE_log_file.clg output_file.txt
Office Communicator Phone Edition logs contain the results of the hardware functional tests as well as critical system errors.
Microsoft RoundTable devices are based on the Windows CE operating system. To collect traces, device logging must first be enabled and only then can log files be submitted to Office Communications Server 2007 R2 Update Server.
To enable logging on RoundTable, install the RoundTable Device Management Tool on a local computer and then configure logging by using the provided Microsoft Office InfoPath template (Office InfoPath must be installed before you try to perform this operation). Use Rtmanage.exe to upload this InfoPath configuration template to RoundTable. To send log files from RoundTable to Office Communications Server 2007 R2 Update Server, run the following command line:
rtmanage.exe -m:diag -l:flush
To read uploaded log files, you must use Readlog.exe, which ships with the Windows CE Platform Builder. Log files have a .clg extension, and you can find them on Office Communications Server 2007 R2 Update Server logs share. For more information about Readlog. exe, see http://msdn2.microsoft.com/en-us/library/ms905162.aspx.
To extract the contents of the CLG file to a text file, use the -v (verbose) print option when you run Readlog.exe, as shown in the following example:
readlog.exe -v CE_log_file.clg output_file.txt
RoundTable log files contain the results of the hardware functional tests as well as critical system errors.