The Snooper utility is a tremendous advance for diagnostics when working with the Office Communications Server 2007 R2 product suite and is available as part of Office Communications Server 2007 R2 Resource Kit Tools. Unlike many tools, it has a complete reference manual that is available directly within the tool by clicking Help and then clicking Using Snooper. Snooper is capable of viewing logs from the current client and server components as well as Live Communications Server 2005 flat-file server logs. Snooper summarizes protocol messages, identifies diagnostic and connection-level events, and offers full content for any message that is selected. Snooper is also capable of querying the archiving server and other Structured Query Language (SQL) repositories to gather reports that contain useful overview and detailed information. Snooper can be run remotely for pools, but Standard Edition Servers might have connection errors when logging remotely. If this is the case, Snooper.exe should be run locally on the Standard Edition Server.
Snooper enables searches and complex queries related to specific fields in the message. For example, if the user [email protected] is of interest but only for messages that were sent to [email protected], a search such as from:[email protected] to:vadim@ litwareinc.com would get the protocol messages of interest. When each message is viewed in detail, the matching text in the protocol message is highlighted. A useful search method for Director and Access Edge Server logs is to specify a direction—whether the message is incoming (in) or outgoing (out)—to avoid seeing messages twice. Such a specification might be direction:in. Likewise, to see nonprotocol messages, specifying direction:none allows a view of just these messages (connection events, diagnostic notes, and other messages).
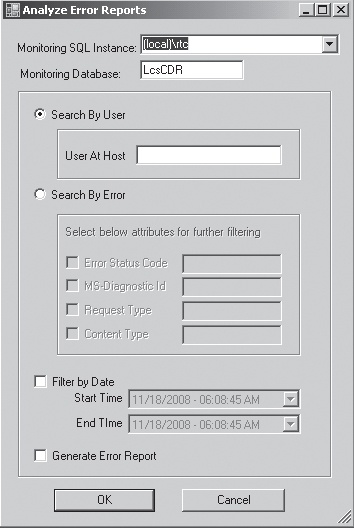
Snooper is also capable of building useful reports based on queries against the SQL repositories maintained by Office Communications Server 2007 R2. The Reports menu offers this functionality, and the Error Analysis option enables an Archiving Server to be queried to gather error reports that have been logged. These records can be filtered by user or by attributes of the error messages and provide an insightful way for IT support to identify problems that a user is experiencing without more information or logs from the users themselves. Gathering overview information for all errors or specific types of errors allows administrators to proactively look at the errors that have been occurring to predict and resolve problems before many users encounter them. The Analyze Error Reports dialog box is shown in Figure 20-15.
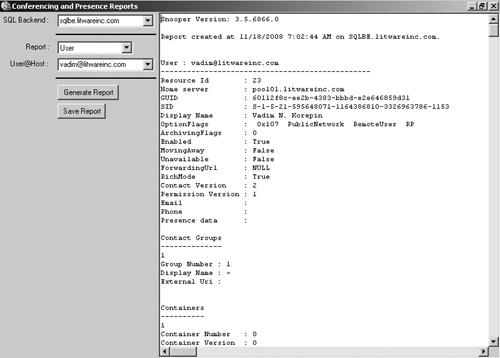
The Conferencing and Presence Reports option provides a variety of useful reports that were not so easily available in the past. Information can be retrieved about users, conferences, MCUs, and diagnostic overview information for the repository. An example of a user query is shown in Figure 20-16. This report contains detailed information about the user, their rights, their contacts and groups, the rich presence information they are publishing, conferences they organized, and conferences to which they are invited.
The conference report shows the current settings as well as the current state of the conference that was queried. The schedule for the conference, the invitee list, the media types allowed in the conference, the active MCUs, the active participant list, and the state of each participant are all shown. This information can be helpful when monitoring a running conference or when diagnosing problems for users when they are connecting to or interacting in a conference.
The MCU Health report identifies all MCUs that are present on the server and provides detailed information about them. Their ID, media type, URL, heartbeat status, number of assigned conferences, and number of connected participants are all displayed. An example of this report is shown in Figure 20-17. Heartbeats to the MCU Factory should generally occur within 15 seconds, but the heartbeat to the Focus depends on the activity level of the MCU.

The diagnostic report identifies overview information about many aspects of the repository in question, but focuses on statistics for record counts as well as the size of the database on the disk and how this space is allocated across internal records. An example of the report in Snooper is shown in Figure 20-18. The following data is presented in the log, with notes in parentheses to explain the usefulness of the information:
Database version (can highlight errors during the update process if the database was not updated)
Database internal statistics along with storage space utilized (helps during maintenance and in understanding what is taking up space if the database grows too large)
List of tables in the database along with record count and data, index, and total size counts
Database size and dynamic database size
Files that make up the database (MDF and LDF files) plus their sizes and growth
Server statistics (helps determine server load in terms of storage space and network activity)
Distribution of contacts across enterprise servers as well as the percentage of contacts that are outside of the enterprise
Number of active endpoints (Office Communicator clients or otherwise)
Maintenance, replication, and expiration tasks and the server on which they are scheduled to run
Number of users with no contacts or permissions (likely idle or have never logged in)
Presence statistics, all with min, max, average, and standard deviation (helps to get a feel for usage and how users compare with each other in terms of usage)
Contacts per user
Container member users per user
Container member domains per user
Cached container members per user
Permissions per user
Prompted subscribers per user
Static publications per user
User-bound publications per user
Time-bound publications per user
Endpoint-bound publications per user
Publication data size per user
Subscribers per user
Category subscriptions per user
Endpoints per user
Conferences per user
Overview of activity (quick view of current usage)
Number of unique users with endpoints
Number of conferences (total and currently active)

Note
Generating the Diagnostic Conferencing and Presence Report can create a large amount of load on database servers. Therefore, during high-activity intervals, it should be done infrequently to prevent creating delays for users. This report effectively locks the database to get a snapshot report, which holds up all traffic on the servers that require a database query from this repository.
Overall, Snooper is a helpful resource for gathering information about the configuration and state of servers and users and is a useful tool for scanning logs that have been collected to analyze them. However, it is always good to start by reviewing the event logs and looking at the MMC overviews for each server because many times the problems have already been identified or will be mentioned. Forgetting to look for event log messages before starting an investigation can waste a great deal of time when the error has already been identified and highlighted to make things easier.