
Chapter 8
Accountability and top performing teams
We started in Chapter 1 at addressing the question of ‘What is a Team?’ and we came up with four defining qualities which teams had. Indeed, by virtue of having these qualities we create what we think of as a top performing team, as opposed to simply a group of people calling themselves a ‘team’. Throughout our investigation we have attempted, unusually, to keep our focus wherever possible on the topic of motivation and it might be a key component of each of these four qualities. Given the limited space in a book of this size, we have had to omit many aspects of Remit, Interdependency, Belief and Accountability that are not specifically motivational, but we persistently return to the importance of motivation in all these domains.
Figure 8.1 shows the final quality or attribute of a top performing team: being accountable. As we said in Chapter 1, this is about being accountable to each other, and also being accountable to the whole organisation.

In the first instance, as we have said, being accountable to each other is primarily about being able to rely on and trust each other. It should be obvious that this issue has, in some important senses, already been covered in various sections of this book. It was raised in Chapter 1; Chapter 5 dealt with the values we insist on, and reliability and trust clearly need to be explicitly so; Chapter 6 dealt with interdependency, which also has trust implications; and finally in Chapter 7 our beliefs, especially in the efficacy of team themselves, affect our ability to trust one another.
What is less evident in what we have covered so far is the accountability to the whole organisation. This, of course, is primarily to prevent independent fiefdoms emerging, turf wars erupting, and that general politicking occurring which saps motivation, detracts from customer service, and leads to confusion, followed by ultimate organisational failure.
Activity 8.1
How do organisations ‘normally’, or ‘typically’, deal with the issue of team accountability? How effective is this? What improvements might you suggest to deal with it?
The usual solutions to accountability are based on improving communication processes and systems; often this means ensuring that the goals and targets, or success criteria, are not lost sight of, as so frequently they are.1 Patrick Lencioni2 identifies three in particular: the publication of Goals and Standards, Simple and Regular Progress Reviews and Team Rewards. Lencioni calls these ‘a few classic management tools that are as effective as they are simple’. And we agree. In fact, we believe in Chapter 2 of this book we have added – motivationally – to what team rewards might be.
But what else – especially motivationally – might lead to greater team accountability? The idea of simple and regular progress reviews is excellent and needs to be extended to include motivation – specifically, how motivationally is our team doing versus the rest of the organisation and other teams? To be able to do this is relatively straightforward through using The Organisational Motivational Map.3
Figure 8.2 shows us the teams within a division of a large organisation. The approximate size, in total, is over 200 staff. What Figure 8.2 shows is the motivational scores of each team set beneath two crucial benchmarks: first, along the top, the overall score for the whole division; second, the Leaders’ team, the score for the senior management team who are managing the six teams below them. It is important to note just where the teams score relative to the 60% score, since falling below 60% puts the team in the second quadrant (or zone, see Figure 2.1), which is ‘Risk’.

Figure 8.2 Motivational quadrant distribution of an organisational division
Activity 8.2
Given the set-up outlined in the previous paragraph, what is the single most important observation or conclusion you would draw from studying Figure 8.2? And is there anything else you would comment on?
The single – and alarming – most important factor in this chart is that the leaders of the teams – the senior management team, in short – are less motivated than the teams themselves! This, as we have often commented in the Mapping Motivation series of books,4 is always a bad sign. Staff take their lead from their leaders, and if the leaders are less motivated, then at some future point employees will revert to being more like them. That is, less motivated; for why be otherwise?
And, of course, the question – why be otherwise? – indicates a lack of accountability on the part of the leaders. Until the Organisational team map threw up this result, they weren’t even aware of the problem, or what its longer term consequences might be. But our energy levels, our motivation, are our responsibility – we have to set an example to those we manage, and hold ourselves accountable to a higher standard than a mere job description.
One other point we might comment on is the fact that all the teams in this example are in the same quadrant: the Boost Zone of 61–80%. The exception is the Leader team at 60%, but that is still so close as to be marginal. What this suggests is good news: that at the least there is a motivational coherence, or approach, running through the whole organisation. Keeping a close eye on motivational variation can help sustain that pattern.
If, then, we take this further, what do these particular teams look like (omitting the whole organisation for now)?
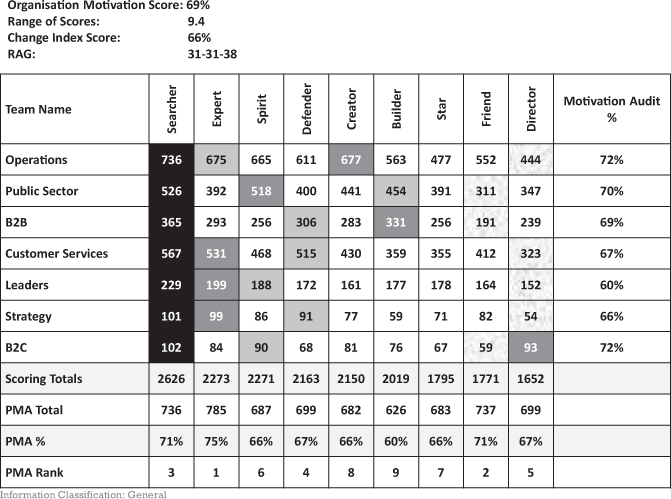
This comparison of team maps now contains some vital and extra5 information which needs explanation. We see three extra rows at the bottom of the chart – called PMA Total, PMA% and PMA Rank – that look unfamiliar. What are they, and what are they telling us? These are available in the Organisational Motivational Map.
First, the ‘PMA Total’ is showing us the combined scores of satisfaction rating for each individual motivator. To make this simple: suppose we had a team of two people, Peter and Susan. Peter’s satisfaction for his Searcher motivator in his profile was 6/10 and Susan’s was 8/10. Then their PMA Total would be 14 (out of 20). Which means that their ‘PMA%’ would be 70% (in other words, the average). Finally, we might ask how that number compared with the other eight satisfaction numbers, and then rank them accordingly: the ‘PMA Rank’. Imagine now, then, that process involving dozens, hundreds or even thousands of people. Indeed, the bigger the number sampled the more accurate and to the point the results are going to be.
To be even clearer: this PMA Rank order is not the same as the Motivational type rank order; for as we see in Figure 8.3, the Searcher is the most important motivator, that is, it is number 1, BUT in terms of its satisfaction it only ranks 3rd!!! This discrepancy (or not) between what the rank order of the motivators is and what the rank order of their satisfaction is, thus throws up the possibility of some fascinating insights into what is going on at team and organisational level. Furthermore, it also leads directly into a form of accountability: specifically, from the team leaders and from the whole organisation (or division).
Activity 8.3
What in your view might be some of the insights or ideas that emerge from contrasting the two rank orders of motivators versus satisfaction?
Perhaps the most important insight to emerge might be whether or not the employees are likely to be engaged, based on their motivators, and whether or not the ones that are most important are actually being satisfied. Given that these are aggregated scores, they are going to be very accurate. Second, are the team leaders and the organisation itself actually targeting their reward strategies effectively? And if not, then potentially, this information could give them precision as to where the real need or want is. Thirdly, at the lower end of the motivational spectrum, where we might encounter what we call ‘hygiene factors’,6 is this exacerbated or ameliorated by the satisfaction ratings? In other words, is there a looming crisis here that the satisfaction ratings might flag up?
Activity 8.4
Given what we have just said, study Figure 8.3 and come up with three key perceptions and three recommendations for action. As you look at these numbers, what are you seeing that might be helpful in improving the performance and capability of these teams? Keep in mind as well that the team maps are a form of accountability.
Three key perceptions that immediately strike one might be: that all seen teams have Searcher as their number one motivator. This suggests a strong corporate ethos and culture informing the long-term as well as the day-to-day running of the organisation. However, there is also a question to be asked: are the motivators too homogenous? In other words, is there enough diversity?
Secondly, and noticeably, however, we find, as we did in the high performing Admin team in Chapter 7, that Director is the lowest motivator collectively; and with four teams it is specifically lowest. (We note, too, in passing one small detail that might need examining: one team, B2C, has the Director motivator as its second highest motivator – how do they interact with the others?)
Finally, and drawing on the new information of PMA scores we have added and expounded, we notice that the rank order of the motivators is not the same as the rank order of the satisfactions. In fact, it is wildly variant. To mention three striking divergences here: The Searcher is only the third satisfied motivator; the lowest motivator, Director, is in fact ranked 5th in terms of satisfaction; and perhaps, most incredible of all, The Friend motivator, ranked 8th, is actually 2nd in terms of job satisfaction!!! So what does this all mean, and what are the recommendations for action that emerge from it?
If we look at Figure 8.4 we get an overview of the data that are in Figure 8.3. We see on the vertical axis the motivators aligned in their hierarchical positions, and along the horizontal axis, we see the nine satisfaction rankings. So that Expert is ranked first overall in terms of its being satisfied. But what does this suggest?

Again, being clear that there is always a certain amount of ambiguity inherent in motivational ‘readings’ or interpretations, this would indicate that although the employees overall are committed most of all to making a difference for the customer/clients that they have, the resources of the organisation are more effectively channeled into training, learning and development opportunities. Now this may be because, strategically, the management quite consciously think that through ‘training’ (understood in its widest sense, which would include ‘L&D’)7 they are best able to satisfy the customers’ needs and so make that difference or fulfil their mission. But notice those small words, ‘this may be’. Of course, it may not be. It may be easier – especially for professional service type people, as these are – to run training courses and complete Personal Development Plans (PDPs) than to undertake the seriously difficult task of satisfying the customer – see Figure 3.1! And it is certainly a lot more straight forward. Let’s keep this issue hanging for a moment.
For if we take this further, drill down on the data to another level, we get to a point where we can answer this issue with more certainty.
Taking the information from Figure 8.4 and then re-processing it in Figure 8.5, we find the following: that the dominant motivational cluster is the G or Growth motivators. This is obvious because we see that two Growth motivators are in the top three, as well as the third one appearing in the second tier or row as 5th most important. Of course, we need only look at Figure 8.3 as well to see the RAG scores are: 31(R)–31(A)–38(G). Definitely, then, Growth motivators dominate this division. But what about the PMA scores: which type of motivators are dominantly satisfied?

A simple way of looking at this would be to remember that being a satisfied motivator is not hierarchical as the motivators themselves are. So we can give points for being 1st (3), 2nd (2), or 3rd (1) to get a sense of what is most significant here,8 as we do in Figure 8.6.
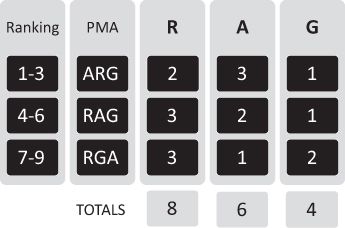
From this we see that although the Growth motivators are more important to the employees, it is the Relationship motivators that are being satisfied more effectively. This suggests – to return to the issue we left hanging – that the management are not consciously implementing a strategy, but rather that the culture itself is determining what is happening. In this sense, the motivational – and so engagement – drive of the teams is less than optimal. Indeed, we need to stop what we are doing and do a thorough review of the whole division/organisation to explore exactly how this has come about and how, exactly, it is manifesting itself.9
But if we now look at what needs addressing immediately, and so answer the second part of our own question, which is, what three recommendations for action would one take, then it seems the following is clear.
The Spirit motivator is in the top three, but its satisfaction rating is only 6th. So, we need to address – using Reward Strategies – how we can loosen the constraints of time and decision-making within the whole division. See the Resources section and Figure 1.8 for more on specific rewards for the Spirit Teams. But three ideas from that list which spring immediately to mind and might be relevant here are:
-
Increase the scope of the Spirit team’s decision-making. Delegate to them, where appropriate. Reduce ‘interference’ in how they work.
-
Let Spirit team members work at home! This is particularly the case where the technology and the role coincide. It is also an increasingly relevant factor following the worldwide Covid-19 Pandemic. 10
-
Allocate 10% of time – one afternoon a week – to allow Spirit teams to work on their own projects and research which may benefit the organisation.
It is perhaps worth mentioning here that these Spirit motivator type of Reward Strategies are highly aligned with the way that many experts think organisational life is going. Professor Gary Hamel,11 for example, points out that it, ‘Turns out you don’t need a lot of top-down discipline when four conditions are met: 1. First-line employees are responsible for results; 2. Team members have access to real-time performance data; 3. They have decision authority over the key variables that influence performance outcomes; 4. There’s a tight coupling between results, compensation, and recognition’. This ‘loosening’ of controls is very Spirit-orientated, but we need to be clear that whereas it may be desirable generally, there are motivator types that require the exact opposite!
Second, Builder is the 6th most important motivator, so it is not really significant; but it is also not insignificant, and when we notice that its satisfaction ranking is 9th, then this is a clear warning that the staff feel underpaid. They have other benefits that are satisfying them – training and development: for example, the Expert – but in the long term this might lead to staff turnover and difficulties in attracting the right calibre of personnel. We need to review our Total Rewards Model – see Figures 2.7 and 2.8. What can we do here?
Third, we must never forget that the first motivator is the first motivator, and as this is only being satisfied at a lower perception level than two others, then this ought to be addressed. How do we reinforce mission, get staff to feel they are making a difference, and in short, address the Remit question? We note that part of the answer is discussed in our Chapter 3; and we note, too, that the comments on the Relationship motivators are also perhaps relevant here – given the low scoring of the Friend, but the high scoring for its satisfaction rating. We might want to ask how that internal bonding might be projected externally to our customers?
If we take all these rather simple things combined, we have a recipe – an experimental recipe – for making a series of small changes which collectively can make a big impact on the performance of the teams, and on their ongoing accountability to the whole organisation. It’s important to say ‘experimental’ recipe because as we constantly emphasize: motivation and how people react to stimuli and interventions can be unpredictable. But doing nothing is not an option: as Zig Ziglar12 commented, ‘People often say that motivation doesn’t last. Well, neither does bathing – that’s why we recommend it daily’.
In this case example the motivational score within six to nine months of the interventions for the whole cohort of seven teams moved from 69% to 73%, a shift of 4%. This sounds small, but over a large number of employees, this is significant; all the more so because as we approach the Optimal Zone of motivation (at 81%) it becomes more difficult to extract more energy from the staff. This is exactly analogous to athletes or sports people. If we have done no exercise whatever, then small steps initially can lead to vast improvements in one’s ability to run the 100 metres. However, as one gets closer and closer to the world record time,13 then gains become more and more difficult. But it is persistence that pays off: we saw in Chapter 7 how Motivational Maps impacted a team over a 7-year period, and this despite a leadership that was less than effective. The prize before us is this: increases in motivation lead to increases in performance, which themselves lead to increases in productivity; ultimately, these increases in productivity will produce – if the organisation has the right strategy for producing, disseminating its products and services – increased profitability.
So seeing how teams, motivationally, compare with each other within an organisation is clearly vitally important in terms not only of performance, but also of accountability. This is easy, inexpensive data to access and to act upon. But if, therefore, comparing teams within an organisation is a form of accountability, so too is tracking the motivational changes for a specific team. We did this in Chapter 7 with the Admin team of ABS Ltd. Let’s now expand these data significantly to see how this helps and what results it might lead to.
The context is an Insurance company in the first decade of this century facing the reality that things have changed. After 30 years of making a profit by simply ‘being there’, the new reality is: changing technology, enhanced customer service expectations, increased competition, and industry consolidation. In other words, an old-school business now seeking to play catch-up. Into this situation a new dynamic MD seeks to develop a high performance culture, delight customers with levels of service exceeding their competitors, drive brand awareness, double the volume of business and increase profitability. This she was able to do (so we will forego discussing results specifically, as we wish to stick with motivational issues) and shortly afterwards there followed a buy-out, another consolidation, and the MD being ‘poached’ to become equally effective elsewhere.
Thus, we are in a fast-moving change environment, which of course has only accelerated since then, although the principles remain the same. Not only has the MD now gone, but along the way there were many changes of staff personnel. One of the primary concerns in July 07 was to retain quality staff and develop them to reverse the attrition rate and its cost to the business. Given that the targets were met over the 3-year period, what does a snapshot of the motivational information tell us?
Activity 8.5
The motivational profiling was to occur every 3 months during the change period. But clearly that didn’t quite go to plan – events intruded. What, though, do the motivational scores over five significant intervals of time tell us? And why might that be even more remarkable if we consider the years in question, especially 2007/8?14 An event that intruded?
What we see of course is what we most want to see: the company is making steady but significant progress in its overall staff motivation, and this is all the more remarkable since it occurred alongside the financial crisis of 2007/8, but which hit them hardest in 2008 as its effects filtered down into the real economy. Part of the reason for choosing this case study, as opposed to more recent ones, is because with the Covid-19 pandemic (I am in lockdown as I write this) proving to be a bigger financial threat than the 2007/8 crisis, it seems relevant to see how a medium-sized15 company coped with this on a motivational level. As we come out of lockdowns, all organisations are going to have to cope with the motivations – or lack thereof – of their staff, and its concomitant, performance. But here it’s not just the 5 percentage points of 57% to 62% that is significant: it is the Zone they cross. 57% is in the Risk Zone (see Figure 2.1), which means that performance is on average ‘good’. However, good here really means ‘average’, even mediocre (see Chapter 2 and Figure 2.6 especially). However, 62% is in the Boost Zone where performance is more likely to be excellent (across the board, as it were). It would be just as significant for the motivational scores to go from 77% to 82%; at which point, the performance leans towards being outstanding, and that obviously would be an ambitious goal for the future.
Despite, therefore, the underlying and precarious economic environment, these motivational results are excellent and pointing in the right direction. Let’s drill down further now, and see from the teams how it is made up. Keep in mind that the teams do not have equal numbers of staff in them, and so the organisational averages are calculated from the individual averages, not the team averages.
Activity 8.6
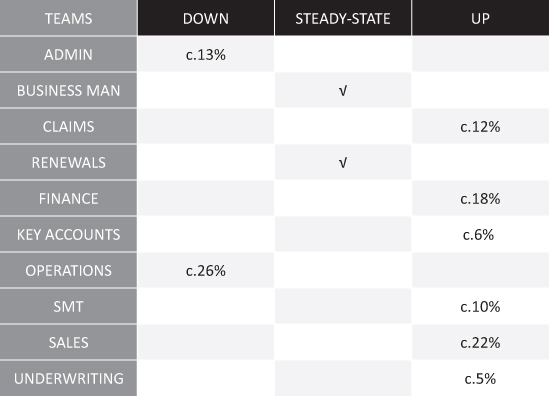
Study Figure 8.8. Which teams are going up motivationally, which are going down, and which are holding their own, or in a kind of ‘steady-state’?
If you have done Activity 8.6, you will find the results extremely interesting. A good way to set them out is in Figure 8.9. Here we can begin to see what is really important.
Activity 8.7
What, then, is really important? How does this layout in Figure 8.9 help us understand what is going on, and how we might develop high performing teams?
The first thing that is really useful about the Figure 8.9 layout is that without even looking at the details, we can clearly see that the overall trend is upwards, and much more decisively than the mere movement from 57–62% (Figure 8.7) indicates. The ‘up’ ticks, as it were, exceed the ‘down’ and ‘steady-state’ combined; and in a rough and ready way, the 39% (13+26) down is more than offset by the 73% (12+18+6+10+22+5) up. We can be much more confident that we are doing some highly effective activities.
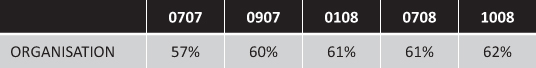
Figure 8.7 Five consecutive organisational motivation scores
Also, we see that there are two problem areas – two problem teams – and so we can focus on them. From a senior management point of view, this is manageable. Change can seem overwhelming16; everything needs doing at once, especially dealing with employees. But here we have it: if we didn’t know already, then the numbers say it all.17 There are some issues in the Admin and Operations teams. Interestingly, this is the reverse of the Admin team in Chapter 7; here, much more typically, Admin is low-status in hierarchical and performance terms. And the Operations team is closely allied with Admin, though hierarchically ‘higher’; effectively, they are ‘expert’ administrators ensuring that the correct documentation, compliance, health and safety, cross-departmental (team) exchanges are coherent, and other issues which lead to behaving in a well-oiled sort of way. Like Admin, they are a cost to the business. Thus, we are establishing a connection between these two departments – teams – that might account for their common motivational down-trend: cost-centres often tend to not be seen as important as profit ones.

* Valid comparison not possible because of re-organisations, changes in personnel, and other factors. In the case of Business Management, this was an entirely new team, led by a new recruit who joined the SMT. At interview, all short-listed candidates completed a Map which was used in the selection process.
Conversely, where is the biggest upward trend? Yippee! In Sales – a dream result for almost any commercial organisation – and performance matched the motivational profile, as sales doubled within the time frame. Sales are important, but are the ‘less’ important teams being left behind? What do the motivators say?
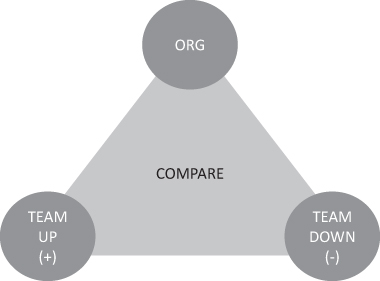
Before we look at the actual motivators, let’s consider the process we call Motivational Triangulation.
What we do in this situation is to take the team with the highest motivational trend, together with the team with the lowest motivational trend, and compare them alongside the organisational results. In this way we cut through the clutter of so much information and get to what might be root issues that we can focus on and analyse effectively.
More specifically, in working on a large change management project with an organisation, we initially benchmark the organisation, in this case MY0707. Then, at agreed periods, we map again after we have made the interventions – coaching, mentoring, consultancy, training etc. – and track how the organisation overall, and the teams specifically, are doing. The triangulation is when we set the most improved and least improved (and that can easily mean, as here, a negative move on the motivation, since change is always resisted)18 against the progress of the organisational motivation. In this way a certain clarity is achieved.
Activity 8.8
By now if you have followed all the Activities in this book, you will be very experienced at spotting the trends that we regard as crucial for helping organisations solve their issues at a deeper level. Figure 8.11, even with all the data from the other teams stripped out, is still a quite complex table. But if you study it, what ‘facts’ scream out as being highly significant? And how do they help us move these teams and this organisation forward?

First, of course, it needs to be said that one does not wait for five Map readings over a near 18-month period in order to take action; action is taken immediately after the first benchmark (MY0707) is taken. But as we look at this, we see a number of very important factors.
First, we notice that, apart from in the 4th time segment, MY0708, there is a hygiene factor in the fact that the Director motivator is lowest. This clearly will pose problems in the long term, even despite a dynamic MD. The action point from it must be that the MD needs to consider the Director motivator as a factor in all future hires, and especially ones to the senior management team.
Second, the persistent presence (except MY0108) of the Builder motivator in the Operations team must represent a serious mismatch between the remit of the team and its likely rewards. Unlike the Sales team, the Operations staff are not on commission or bonuses, and their remuneration is not at the level of other, more ‘prestigious’ or ‘expert’ teams, such as Underwriting. How then can they be satisfied? With the advent of the new MD they expected much, but clearly as the change programme progressed, they became increasingly disappointed. The key issue here is to uncover why the Builder motivator is so persistent; and the answer – revealed through the accompanying coaching programme – proved to be the personal circumstances of two of the members of the team, including its leader.
It is here that great leadership needs to demonstrate itself. An organisation can take the view that this is our pay structure, take it or leave it; or they can personally engage with the people involved. As Binney and Williams19 observed, ‘The personal element is key. When a change agenda shifts from generalities and ‘management speak’ to individual and collective hopes and fears, expressed in people’s own words, then it comes alive and has power’. From this seemingly belated revelation a plan for the team was devised which focused far more on the consequences of successful organisational development, and what that might mean in terms of security, a larger team, and correspondingly bigger rewards. In simple terms, getting them to see the part they were playing in the bigger picture. This worked immediately; we have stopped at MY1008 in order to make the data manageable, but the motivational score for MY0409 for the Operations team was 52%, a significant upturn.
Finally, though much more could be said, MY0708 is obviously a watershed point in the development of the change management programme: the re-entry of the Builder motivator in both the Operations and Sales team, and perhaps most significantly of all, the fact that the Friend motivator has become the lowest motivator for both teams. We see in MY0907 that the change programme is kicking in, at least in an initial phase: The Operations team loses its Expert motivator and the Searcher replaces it – focus on the (internal) customer; whereas the Sales team goes into a major learning phase, which is sustained through all succeeding mapping – indeed, the Sales team experienced a concentrated coaching programme on motivational selling which was quite relentless, because it was so important to the company (doubling turnover). But at MY0708 something extra is happening too: The Director motivator, along with the Builder, is actually moving upwards in both teams. Meaning?
Well, this, of course, is the moment when the financial crisis of 2008 hits the company – the moment of market panic. It’s sell or die; perform or die; all hands to the deck. Over and above the change programme, external events were also impacting the day to day working lives of these teams: Friend being lowest is perhaps not entirely desirable, and we have talked about this in Chapter 7. But taking more responsibility (the Director) and being more accountable in the crisis possible is. But it certainly exhausted the Sales team as their motivation dips – though not drastically – in MY1008. At this point, for both Sales and Operational teams, a coaching programme that also involves personal development, well-being and de-stressing components, is essential.
As we reach the end of this chapter, it’s important to be clear that in discussing accountability we have not exhausted all or every way of ensuring we have it. But we have considered how motivation and Motivational Maps can give us some astonishing insights into it that normally are not available or even thought of as relevant. We hope you will want to use Maps to track the progress of your teams and to hold them accountable. Don’t forget – our first example was of the senior team being accountable for being more highly motivated than most of the other teams!
Notes
1 Colin Hastings writes that, ‘Once teams are involved in their tasks it is very easy for them to lose sight of what they are really trying to achieve. Make sure in the first place that all the team fully understand all the subtleties of what is expected of the team. Secondly, make sure that they constantly come back to the key question: what are we trying to achieve and for whom?’ – Teamworking, The Gower Handbook of Management, Third Edition, Chapter 69 (1992).
2 Patrick Lencioni, The Five Dysfunctions of Teams (Jossey-Bass, 2002).
3 See the Resources section for more on the Motivational Organisational Map.
4 Perhaps the most extensive coverage of this is in Mapping Motivation for Leadership, James Sale and Jane Thomas (Routledge, 2020), Chapter 7: What Leadership Isn’t.
5 This team map first appeared in our Mapping Motivation for Engagement book, James Sale and Steve Jones (Routledge, 2019) as Figure 6.3. However, since it was not relevant to that earlier volume, we omitted the PMA Total, PMA%, and PMA Rank scores. Now we can see the extra insight and power these data bring to our analysis.
6 I use the term ‘hygiene factor’ following the work of Herzberg. Herzberg realised that there were aspects of work which while not motivating in themselves might, through their absence, be de-motivating. For example, nobody is motivated to go to work because of tea and coffee facilities, but if one were to permanently find that the organisation was not interested in providing either refreshments or even a facility where one could make one’s own refreshments, this might become extremely de-motivating over time. Frederick Herzberg, The Motivation to Work, 1959, and One More Time, How do You Motivate Employees? Harvard Business Review, 1968. As an interesting sidebar, Herzberg clearly had a great sense of humour, for he came up with the KITA formula too: this he identified as how not to motivate and influence people; KITA being an acronym for the ‘Kick In The Ass’ approach to management!
7 L&D stands for Learning and Development, and this acronym and variants of it are commonplace as departments within most corporates. An article by Mandy Chapman for the Training Journal recently (7/1/2020) outlined future prospects for L&D post 2020: https://bit.ly/3dGT7hi
8 Another way of doing this would be to add up the RAG PMA scores and compare them: so G = 2105 (736+687+682), A = 2110 (785+626+699), and R = 2119 (699+683+737). This gives the same result. Either way is useful as a tie-breaker if one method produces a drawn result.
9 Doing this now is beyond the scope of top performing teams per se, but tools, techniques and ideas for investigating what is happening here are contained in two of our previous books: Mapping Motivation for Engagement, ibid., and Mapping Motivation for Leadership, ibid. In particular, in the former volume, we recommend studying Chapters 6 (Advanced Ideas for Engaging Managers) and 7 (Motivational Organisational Maps and Strategic Narrative); and in the latter volume, Chapters 4 (Leaders Thinking and Planning) and 5 (Leaders Doing). We especially recommend using The Five Elements cycle model we outline, and starting with the C, or Checking questions.
10 See, ‘How to profit from the shift towards working from home’, Stephen Connolly, MoneyWeek, 3/4/2020. Aside from the specific wants of the Spirit motivator, ‘According to a 2019 survey in the US … 80% of employees would like to be able to do so [work from home] at least some of the time, many more than were actually doing so before the advent of Covid-19’.
11 The Future of Management, Gary Hamel( Harvard Business School Press, 2007).
12 Motivation A Key to Success, Dr Savita Mishra (Lulu, 2017).
13 The current men’s world record at the time of writing this is 9.58 seconds, set by Jamaica’s Usain Bolt in 2009, while the women’s world record of 10.49 seconds set by American Florence Griffith-Joyner in 1988 remains unbroken.
14 Just as this financial institution was waking up to the fact of its eroding position in the market place, and its lack-lustre technology, so the financial crisis of 2007–08, also known as the global financial crisis (GFC), hit. This was a severe worldwide economic crisis and considered by many economists to have been the most serious financial crisis since the Great Depression of the 1930s: https://bit.ly/3cIUpZ7. This of course created a double-whammy for them. Fortunately, they had appointed just the right leader to steer them through this. Hence the motivational scores as well as the results they achieved.
15 They had approximately 80 staff and made a profit of nearly £4M in 2008.
16 And ambiguous: ‘Change projects are ambiguous’, Donald G Krause, The Way of the Leader (Nicholas Brealey Publishing, 1997).
17 As is often the case with consultants or external agencies going into an organisation, senior management is aware that something is ‘up’, but can’t quite put their finger on what it is. This is especially true with the organisational cost centres; in sales or in production, failing targets are highly visible, but with departments – teams – like Administration, the reasons for underperformance can be more difficult to spot.
18 See Mapping Motivation for Engagement, ibid., for more on change resistance, especially Chapter 8 and overcoming it.
19 Leaning into the Future, George Binney and Colin Williams (Nicholas Brealey, 1995).