
Chapter 5: Debugging Kernel Memory Issues – Part 1
There's no doubt about it, C (and C++) is a really powerful programming language, one that allows the developer to straddle both high-level layered abstractions (after all, object-oriented languages such as Java and Python are written in C) as well as to work upon the bare metal, as it were. This is fantastic. Of course, there's a price to pay: the compiler will do only so much. You want to overflow a memory buffer? Go ahead, it doesn't care. Want to peek at or poke an unmapped memory region? No problem.
Well, no problem for the compiler, but big problems for us! This is nothing new really. We mentioned just this in Chapter 2, Approaches to Kernel Debugging. C being a procedural and non-managed programming language (in memory terms), it's ultimately the programmer's responsibility to ensure that runtime memory usage is correct and well behaved.
The Linux kernel is almost entirely written in C (over 98% of the code is in C, as of the time of this writing). You see the potential for problems, right? (In fact, there's a slowly growing effort to begin porting the kernel, or portions of it, to a more memory-safe language such as Rust. See the Further reading section for links on this). In a similar vein, compilers are getting smarter. The Clang/Low Level Virtual Machine (LLVM) compiler – with which you can certainly build the kernel and modules – seems superior to the well-known GNU Compiler Collection or GCC compiler in terms of intelligent code generation, avoiding Out Of Bounds (OOB) accesses, and more. We cover some introductory material on using Clang as well here, though the focus is on the most commonly used GCC compiler. Here, we'll attempt to tackle this all-too-common and stubborn bug source – memory issues! The goal, after all, is to make your code memory safe.
Due to the vast scope of material to be covered on kernel memory debugging, we've split the discussion into two chapters, this one and the next.
In this chapter, we shall focus on and cover the following main topics (look out for detailed coverage of the kernel's SLUB debug framework and catching memory leakage in the next one):
- What's the problem with memory anyway?
- Using KASAN and UBSAN to find memory bugs
- Building your kernel and modules with Clang
- Catching memory defects in the kernel – comparison and notes (Part 1)
Technical requirements
The technical requirements and workspace remain identical to what's described in Chapter 1, A General Introduction to Debugging Software. The code examples can be found within the book's GitHub repository here: https://github.com/PacktPublishing/Linux-Kernel-Debugging. The only thing new in terms of software installation is the usage of the powerful Clang compiler. We cover the details in the Building your kernel and modules with Clang section.
What's the problem with memory anyway?
The introductory paragraphs at the start of this chapter informed you of the annoying fact that though programming in C is like having a superpower (at least for your typical OS/driver/embedded domains), it's a double-edged sword: we humans inadvertently create defects and bugs. Memory bugs, especially, are simply all too common.
In fact, in Chapter 2, Approaches to Kernel Debugging, in the Types of bugs – the memory view section, we mentioned that among the different ways of classifying bug types is the memory view. For easy recollection – and to stress its importance here – I reproduce the short list of common memory corruption bug types:
- Incorrect memory accesses:
- Using variables uninitialized, aka Uninitalized Memory Read (UMR) bugs
- Out-Of-Bounds (OOB) memory accesses (read/write underflow/overflow bugs)
- Use-After-Free (UAF) and Use-After-Return (UAR) (aka out-of-scope) bugs
- Double-free bugs
- Memory leakage
- Data races
- (Internal) Fragmentation
These (except the last) are among the well-understood Undefined Behavior (UB) issues that a process, or even the OS, can blunder into. In this chapter, you'll learn about these issues – with the emphasis being within the kernel/driver code – and, more importantly, how to use various tools and approaches to catch them.
More precisely, within this chapter, we shall focus on the first two: incorrect memory accesses – which include all kinds of common memory bugs: UMR, OOB, UAF/UAR, and double-free. In the following chapter, we'll focus on catching memory defects in slab memory via the SLUB debug framework as well as detecting memory leaks. We'll cover data races and their complexities in Chapter 8, Lock Debugging, (as they are most commonly caused by incorrectly working with locks), and (internal) fragmentation, or wastage, will be mentioned in the next chapter, in the Learning to use the slabinfo and related utilities section.
It's Not Only about Bugs but Also about Security
Human error and C (and C++) create an unfortunate mix at times – bugs! But – and here's a key point – security issues very often tend to be bugs or defects at heart. This is why getting it right in the first place, and/or later hunting down and fixing bugs, is so critical to today's modern production systems and, indeed, the cloud (a huge portion of which is powered via the Linux kernel and its built-in hypervisor component – Kernel Virtual Machine (KVM)). Hackers currently have a pretty wide choice of OS-level exploits to choose from; this is especially true for older kernels. To see what I mean, take a peek here: https://github.com/xairy/linux-kernel-exploitation.
If nothing else, remember: unless you're running the latest stable kernel (which will have the latest bugfix and security patches), and have configured it with security in mind as well, you're asking for trouble! Again, see (much) more on Linux kernel security via a link in the Further reading section.
The goal is to have your project or product achieve memory safety.
Tools to catch kernel memory issues – a quick summary
Let's get to the important thing: what tools and/or approaches are available to you when debugging kernel memory issues? Several exist; among them are the following:
- Directly with dynamic (runtime) analysis, specifically, memory checker tooling:
- Kernel Address Sanitizer (KASAN)
- Undefined Behavior Sanitizer (UBSAN)
- SLUB debug techniques
- Kernel memory leak detector (kmemleak)
- Indirectly with the following:
- Static analysis tools: checkpatch.pl, sparse, smatch, Coccinelle, cppcheck, flawfinder, and GCC
- Tracing techniques
- K[ret]probes instrumentation
- Post-mortem analysis tooling (logs, Oops analysis, kdump/crash, [and K]GDB)
The first bullet point above – the one using which you can more or less directly catch kernel memory defects – is of course what we shall primarily focus on here. Subsequent chapters in this book will cover the indirect techniques mentioned in the second bullet point. So, patience – you'll get there. Also, as implied by the indirect wording, these may or may not help you catch memory bugs.
Okay. I'll attempt to summarize this information with specifics on the tools you can use in the following table. More detailed tables will be presented later in this chapter.
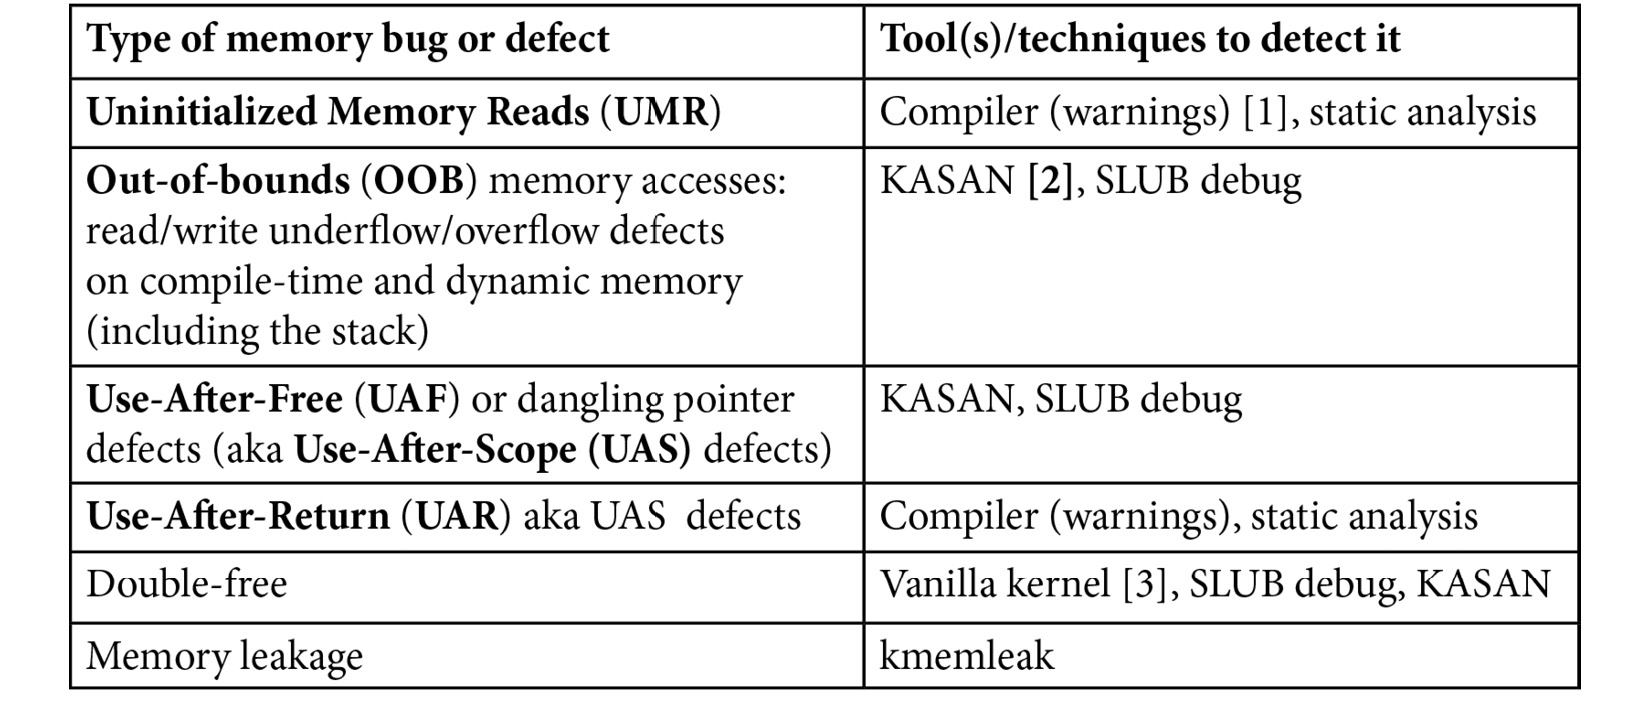
Table 5.1 – A summary of tools (and techniques) you can use to detect kernel memory issues
A few notes to match the numbers in square brackets in the second column:
- [1]: Modern GCC/Clang compilers definitely emit a warning for UMR, with recent ones even being able to auto-initialize local variables (if so configured).
- [2]: KASAN catches (almost!) all of them – wonderful. The SLUB debug approach can catch a couple of these, but not all. Vanilla kernels don't seem to catch any.
- [3]: By vanilla kernel, I mean that this defect was caught on a regular distro kernel (with no special config set for memory checking).
All right! Now you know – in theory – how to catch memory bugs in the kernel or your driver, but in practice? Well, that requires you to learn to use the tool(s) mentioned above and practice! As mentioned already, understanding, configuring, and learning to leverage KASAN and UBSAN (along with using Clang) is the focus of this chapter (SLUB debug and kmemleak will be that of the next one). So, let's get on with it.
Using KASAN and UBSAN to find memory bugs
The Kernel Address Sanitizer (KASAN) is a port of the Address Sanitizer (ASAN) tooling of the Linux kernel. The ASAN project proved to be so useful in detecting memory-related defects that having similar abilities within the kernel was a no-brainer. ASAN is one of the few tools that could detect the buffer overread defect that was at the root of the (in)famous so-called Heartbleed exploit! See the Further reading section for a very interesting XKCD comic link that superbly illustrates the bug at the heart of Heartbleed.
Understanding KASAN – the basics
A few points on KASAN will help you understand more:
- KASAN is a dynamic – runtime – analysis tool; it works while the code runs. This should have you realize that unless the code actually runs (executes), KASAN will not catch any bugs. This underlines the importance of writing really good test cases (both positive and negative), and the use of fuzzing tools to catch rarely-run code paths! More on this in later chapters, but it's such a key point that I am stressing it here as well.
- The technology behind KASAN is called Compile-Time Instrumentation (CTI) (aka static instrumentation). Here, we don't intend to go into the internals of how it works; please see the Further reading section for more on this. Very briefly, when the kernel is built with the GCC or Clang -fsanitize=kernel-address option switch, the compiler inserts assembly-level instructions to validate every memory access. Further, every byte of memory is shadowed (tracked) using 1 byte of shadow memory to track 8 bytes of actual memory.
- Overhead is relatively low (a factor of around 2x to 4x). This is low, especially when compared with dynamic instrumentation approaches such as Valgrind's, where the overhead can easily be 20x to 50x.
Well, in terms of overhead from KASAN, it's really the RAM (more than CPU) overheads that can hurt. It does all depend on where you're coming from. For an enterprise-class server system, using several megabytes of RAM as overhead for KASAN can be considered tolerable. This is likely not the case for a resource-constrained embedded system (your typical Android smartphone, TV, wearable devices, low-end routers, and similar products being good examples). For this key reason, the modern Linux kernel supports three types, or modes, of KASAN implementations:
- Generic KASAN (the one we're referring to and using here, unless mentioned otherwise): High overhead and debug-only.
- Software tag-based KASAN: Medium-to-low overhead on actual workloads. Currently ARM64 only.
- Hardware tag-based KASAN: Low overhead and production-capable. Currently, ARM64 only.
The first is the default and the one to use when actively debugging (or bug hunting). It has the largest relative overhead among the three, but is very effective at bug catching! The software tag-based approach has significantly lower overhead; it's appropriate for testing actual workloads. The third hardware tag-based version has the lowest overhead and is even suitable for production use!
Memory Checking on User-Mode Apps
The ASAN tooling was in fact first implemented (by Google engineers) as a GCC (and soon, Clang) patch for userspace applications. The suite includes ASAN, Leak Sanitizer (LSAN), Memory Sanitizer (MSAN), Thread Sanitizer (TSAN), and Undefined Behavior Sanitizer (UBSAN). They – especially ASAN – are really powerful and are simply a must-use for userspace app memory checking! My earlier book Hands-On System Programming with Linux does cover using ASAN (and Valgrind) in some detail.
In the discussion that follows, I assume that the Generic KASAN mode is being employed, primarily for the purpose of (memory) debugging. Actually, as you'll see in the following section, this is a bit of a moot point as the other tag-based modes are currently only supported on ARM64.
Requirements to use KASAN
Firstly, as KASAN (as well as UBSAN) are compiler-based technologies, which compiler should you use? Both GCC and Clang are supported. You will require a relatively recent version of the compiler to be able to leverage KASAN – as of this writing, you'll need the following:
- GCC version: 8.3.0 or later
- Clang version: Any. For detecting OOB accesses on global variables, Clang version 11 or later is required.
The following table neatly summarizes some key information about KASAN:

Table 5.2 – Types of KASAN and compiler/hardware support requirements
The Kernel and Compilers
Traditionally, the Linux kernel has been very tightly coupled to the GCC compiler; that's slowly changing. Clang is now almost fully supported, and Rust is making an entry. In fact, FYI, Clang is typically used to compile Android Open Source Project (AOSP) kernels. We cover using Clang in the Building your kernel and modules with Clang section.
Next, hardware-wise, KASAN traditionally requires a 64-bit processor. Why? Recall that it uses a shadow memory region whose size is one-eighth of the kernel virtual address space. On an x86_64, the kernel VAS region is 128 TB (as is the user-mode Virtual Address Space (VAS) region). An eighth of this is significant – it's 16 terabytes. So, what platforms does KASAN actually work on? Quoting directly from the official kernel documentation: Currently, Generic KASAN is supported for the x86_64, arm, arm64, xtensa, s390, and riscv architectures, and tag-based KASAN modes are supported only for arm64.
Did you notice? Even ARM – the ARM 32-bit processor – is supported! This is a recent thing, as of the 5.11 kernel. Not only that, as of this writing at least, the lower overhead tag-based KASAN type is supported only for ARM64. Did you pause to wonder, why ARM64? Clearly, it's due to the incredible popularity of Android. Many, if not most, Android devices are powered via an ARM64 core(s) within a System on Chip (SoC). Detecting memory defects on Android – both in userspace and within the kernel – is critical in today's information economy. Thus, tag-based KASAN modes work on this key platform!
In Table 5.2, I highlight Generic KASAN in bold as it's the one we're going to work with here.
Configuring the kernel for Generic KASAN mode
Of course, you need to configure your kernel to support Generic KASAN mode. It's straightforward: enable it by setting CONFIG_KASAN=y. When performing the kernel config (via the usual method, the make menuconfig UI), you'll find the menu option here:
Kernel hacking | Memory Debugging | KASAN: runtime memory debugger
To make it a bit more interesting, let's configure the kernel for KASAN for ARM64:
make ARCH=arm64 menuconfig
The screenshot shows you how it looks (here, we've navigated to the KASAN sub-menu):

Figure 5.1 – Screenshot of kernel config enabling KASAN
Keep the mode as Generic mode. The < Help > button will show you that this corresponds to the kernel config CONFIG_KASAN_GENERIC=y. In fact, this Help display reveals some interesting information:
This mode consumes about 1/8th of available memory at kernel start and introduces an overhead of ~x1.5 for the rest of the allocations. The performance slowdown is ~x3.
Also, here, only because it's the ARM64 architecture, does the kernel config option CONFIG_HAVE_ARCH_KASAN_SW_TAGS get initialized to y:
$ grep KASAN .config
CONFIG_KASAN_SHADOW_OFFSET=0xdfffffd000000000
CONFIG_HAVE_ARCH_KASAN=y
CONFIG_HAVE_ARCH_KASAN_SW_TAGS=y
CONFIG_CC_HAS_KASAN_GENERIC=y
CONFIG_KASAN=y
CONFIG_KASAN_GENERIC=y
[...]
In addition, you can see how the kernel configures the shadow memory region start offset via the value allotted to the kernel config CONFIG_KASAN_SHADOW_OFFSET (it's a kernel virtual address of course) and other configs.
KASAN – Effect on the Build
With CONFIG_KASAN=y, building the kernel source tree by passing the V=1 parameter will show the details: the GCC flags being passed, and more. Here's a snippet of what you'd typically see, focused on the GCC flags passed during the build due to KASAN being enabled:
make V=1
gcc -Wp,-MMD,[...] -fsanitize=kernel-address -fasan-shadow-offset=0xdffffc0000000000 --param asan-globals=1 --param asan-instrumentation-with-call-threshold=0 --param asan-stack=1 --param asan-instrument-allocas=1 [...]
KASAN works essentially by being able to check every single memory access; it does this by using a technique called Compile Time Instrumentation (CTI). Put very simplistically, the compiler inserts function calls (__asan_load*() and __asan_store*()) before every 1-, 2-, 4-, 8-, or 16-byte memory access. Thus, the runtime can figure out whether the access is valid or not (by checking the corresponding shadow memory bytes). Now, there are two broad ways the compiler can perform this instrumentation: outline and inline. Outline instrumentation has the compiler inserting actual function calls (as just mentioned); inline instrumentation achieves the same thing but in a time-optimized manner by directly inserting the code (and not having the overhead of a function call)!
You can set the kernel config option Instrumentation type to either CONFIG_KASAN_OUTLINE (the default) or CONFIG_KASAN_INLINE. It's the typical trade-off: the outline type, the default, will result in a smaller kernel image while the inline type will result in a larger image but is faster (by a factor of 1.1x to 2x).
Also, (especially for your debug kernel), it's worth enabling the kernel config CONFIG_STACKTRACE, so that you also obtain stack traces of the allocation and freeing of affected slab objects in the report when a bug is detected. Similarly, turning on CONFIG_PAGE_OWNER – here within the menu Kernel hacking | Memory Debugging | Track page owner – will get you the stack traces of the allocation and freeing of affected physical pages. It's off by default; you have to boot with the parameter page_owner=on.
Also, when configuring an x86_64 for KASAN, you'll find an additional kernel config regarding vmalloc memory corruption detection. The option shows up like this:
[*] Back mappings in vmalloc space with real shadow memory
This helps detect vmalloc-related memory corruption issues (at the cost of higher memory usage during runtime).
So much for the theory and KASAN kernel config. Do configure and (re)build your (debug) kernel and we're good to give it a spin!
Bug hunting with KASAN
I'll assume that by now you've configured, built, and booted into your (debug) kernel that's enabled with KASAN (as the previous section has described in detail). On my setup – an x86_64 Ubuntu 20.04 LTS guest VM – this has been done.
To test whether KASAN works, we'll need to execute code that has memory bugs (I can almost hear some of you old-timers say "Yeah? That shouldn't be too hard"). We can always write our own test cases but why reinvent the wheel? This is a good opportunity to look at a part of the kernel's test infrastructure! The following section shows you how we'll leverage the kernel's KUnit unit testing framework to run KASAN test cases.
Using the kernel's KUnit test infrastructure to run KASAN test cases
Why take the trouble to write our own test cases to test KASAN when the community has already done the work for us? Ah, the beauty of open source.
The Linux kernel has by now evolved sufficiently to have many kinds of test infrastructure, including full-fledged test suites, built into it; testing various aspects of the kernel is now a matter of configuring the kernel appropriately and running the tests!
With regard to possible built-in test frameworks within the kernel, the two primary ones are the KUnit framework and the kselftest framework. FYI, the official kernel documentation, of course, has all the details. As a start, you can check this one: Kernel Testing Guide: https://www.kernel.org/doc/html/latest/dev-tools/testing-overview.html#kernel-testing-guide – it provides a rough overview of available testing frameworks and tooling (including dynamic analysis) within the kernel.
Again, FYI, there are several other related and useful frameworks: kernel fault injection, notifier error injection, the Linux Kernel Dump Test Module (LKDTM), and so on. You'll find them under the kernel config here: Kernel hacking | Kernel Testing and Coverage.
Again, we don't intend to delve into the details of how KUnit works here; the idea is to merely use KUnit to test KASAN as a practical example at this point. For details on using these test frameworks – it will probably prove useful! – do see the links within the Further reading section.
As a pragmatic thing to do, and to begin getting familiar with it, let's leverage the kernel's KUnit – Unit Testing for the Linux kernel – framework to execute KASAN test cases!
It's really very simple to do. First, ensure your debug kernel is configured to use KUnit: CONFIG_KUNIT=y (or CONFIG_KUNIT=m).
We intend to run KASAN test cases, thus, we must have the KASAN test module configured as well:
CONFIG_KASAN_KUNIT_TEST=m
The kernel's module code for the KASAN test cases we're going to run is here: lib/test_kasan.c. A quick peek will show you the various test cases (there are many of them – 38 as of this writing):
// lib/test_kasan.c
static struct kunit_suite kasan_kunit_test_suite = { .name = "kasan",
.init = kasan_test_init,
.test_cases = kasan_kunit_test_cases,
.exit = kasan_test_exit,
};
kunit_test_suite(kasan_kunit_test_suite);
This sets up the suite of test cases to execute. The actual test cases are in the kunit_suite structure's member named test_cases. It's a pointer to an array of kunit_case structures:
static struct kunit_case kasan_kunit_test_cases[] = {KUNIT_CASE(kmalloc_oob_right),
KUNIT_CASE(kmalloc_oob_left),
[...]
KUNIT_CASE(kmalloc_double_kzfree),
KUNIT_CASE(vmalloc_oob),
{}};
The KUNIT_CASE() macro sets up the test case. To help understand how it works, here's the code for the first of the test cases:
// lib/test_kasan.c
static void kmalloc_oob_right(struct kunit *test)
{char *ptr;
size_t size = 123;
ptr = kmalloc(size, GFP_KERNEL);
KUNIT_ASSERT_NOT_ERR_OR_NULL(test, ptr);
KUNIT_EXPECT_KASAN_FAIL(test, ptr[size + OOB_TAG_OFF] = 'x');
kfree(ptr);
}
Quite intuitively, the actual checking occurs within the KUNIT_ASSERT|EXPECT_*() macros seen above. The first macro asserts that the return from the kmalloc() API doesn't result in an error and isn't null. The second macro, KUNIT_EXPECT_KASAN_FAIL(), has the KUnit code expect failure – a negative test case. This is indeed what should be done here: we expect that writing beyond the right side of the buffer (a write overflow defect) should trigger KASAN to report a failure! I'll leave it to you to study the implementation of these macros if interested.
Furthermore, and quite interestingly, the name and exit members of the kunit_suite structure specify functions to execute before and after each test case is run, respectively. The module leverages this to ensure that the kernel sysctl kasan_multi_shot is temporarily enabled and to set panic_on_warn to 0 (else, only the first invalid memory access would trigger a report and a possible kernel panic!).
Finally, let's try it out:
$ uname –r
5.10.60-dbg01
$ sudo modprobe test_kasan
This will cause all test cases within the KASAN test module to execute! Looking up the kernel log (via journalctl –k or dmesg) will show you the detailed KASAN reports for each of the test cases. As they're voluminous, I show a sampling of the output. The very first test case – KUNIT_CASE(kmalloc_oob_right) – causes KASAN to generate this report (its output is truncated – see more of it below):
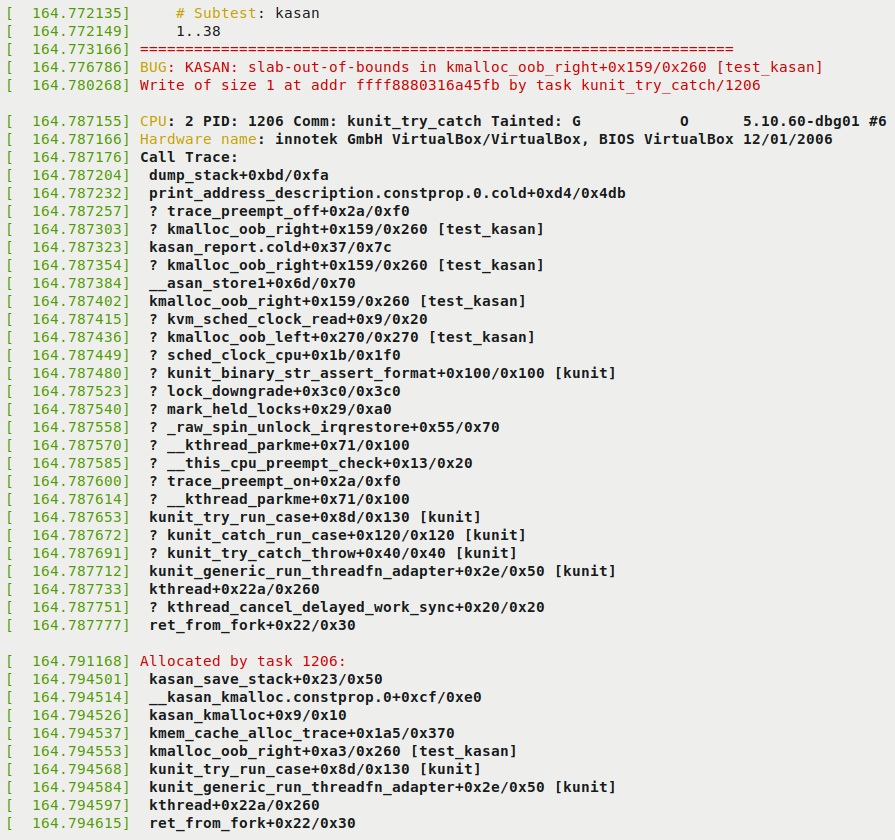
Figure 5.2 – First part of the KUnit KASAN bug-catching example
Notice the following in the preceding screenshot:
- In the first two lines, KUnit shows the test title (as # Subtest: kasan) and that it will run test cases 1..38.
- KASAN successfully, as expected of it, detected the memory defect, the write overflow, and generated a report. The report begins with BUG: KASAN: [...] and the details follow.
- The following lines reveal the root cause: the format that KASAN displays the offending function in is func()+0xoff_from_func/0xsize_of_func, where, within the function named func(), the error occurred at an offset of 0xoff_from_func bytes from the start of the function, and the kernel estimates the function length to be 0xsize_of_func bytes. So here, the code in the kmalloc_oob_right() function, at an offset of 0x159 bytes from the start of it (followed by an educated guess of the function's length as 0x260 bytes), within the kernel module test_kasan (shown within square brackets on the extreme right), attempted to illegally write at the specified address. The defect, the bug, is an OOB write to a slab memory buffer, as seen by the slab-out-of-bounds token:
BUG: KASAN: slab-out-of-bounds in kmalloc_oob_right+0x159/0x260 [test_kasan]
Write of size 1 at addr ffff8880316a45fb by task kunit_try_catch/1206
- The following line reveals the process context within which this occurred (we'll cover the meaning of the tainted flags in the following chapter):
CPU: 2 PID: 1206 Comm: kunit_try_catch Tainted: G O 5.10.60-dbg01 #6
- The next line shows the hardware detail (you can see it's a VM, VirtualBox).
- The majority of the output is the call stack (labeled Call Trace:). By reading it bottom up (and ignoring any lines prefixed with a ?), you can literally see how control came to this, the buggy code!
- The line Allocated by task 1206: and the following output reveals the call trace of the memory allocation code path. This can be very helpful, showing by whom and where the memory buffer was allocated to begin with.
The remainder of the output can be seen in the following screenshot:

Figure 5.3 – Second part of the KUnit KASAN bug-catching example
As CONFIG_PAGE_OWNER=y (as we suggested in the Configuring the kernel for Generic KASAN mode section), the following output turns up as well. It gives you insight into where the faulty-accessed page(s) is located and its ownership:
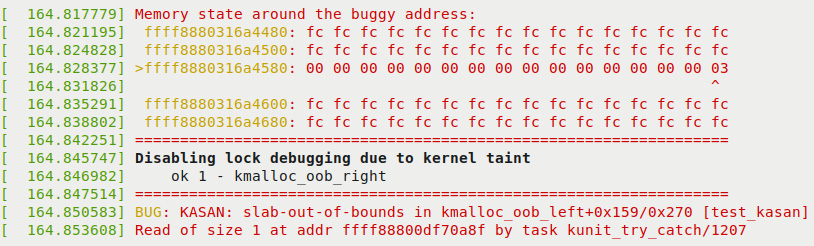
Figure 5.4 – Third (and final) part of the KUnit KASAN bug-catching example
In the preceding screenshot, you can see KASAN justifying itself. It shows the actual memory region where the defect occurred and even points out the precise byte where it did (via the > for the row and ^ for the column symbols)! As a side effect of this bug, the kernel now disables all lock debugging. Further, KUnit says that running this first test case went well: ok 1 - kmalloc_oob_right.
Interpreting this information is important. It helps you drill down to what actually triggered the bug. We do just this in the section that follows!
Interpreting the KASAN shadow memory output
In Figure 5.4, you can see the KASAN shadow memory revealing the defect's cause. We print the key line – the one prefixed with a right arrow symbol >:
>ffff8880318ad980: 00 00 00 00 00 00 00 00 00 00 00 00 00 00 00 03
^
These are the KASAN shadow memory bytes, each one represents 8 bytes of actual memory. The byte 03 is pointed at (by the symbol ^) telling us where the issue lies. What do the bytes 00, 03, and so on, mean? The details follow:
- Generic KASAN assigns one shadow byte to track 8 bytes of kernel memory (think of an 8-byte chunk as a memory granule).
- A granule (an 8-byte region) is encoded as being accessible, partially accessible, part of a red zone, or free.
- The encoding of a memory granule (8-byte region) by shadow byte tracking is done as follows:
- Shadow memory = 00: All 8 bytes are accessible (no error).
- Shadow memory = N (where N can be a value between 1 and 7): The first N bytes are accessible (fine); the remaining (8-N) bytes aren't legally accessible.
- Shadow memory < 0: A negative value implies the entire granule (8 bytes) is inaccessible. The particular (negative) values and their meaning (already freed-up memory, red zone region, and so on) are encoded in a header file (mm/kasan/kasan.h).
So, now you'll realize that the shadow byte 03 implies that the memory was partially accessible. The first 3 bytes (as here, N = 3) were legally accessible; the remaining 5 (8 – 3 = 5) bytes weren't. Let's take the trouble to verify this in detail. This is the line of code that triggers the bug, of course (it's here within the kernel code base):
// lib/test_kasan.c
static void kmalloc_oob_right(struct kunit *test)
[...]
size_t size = 123;
ptr = kmalloc(size, GFP_KERNEL);
[...]
KUNIT_EXPECT_KASAN_FAIL(test, ptr[size + OOB_TAG_OFF] = 'x');
Now, the variable size is set to the value 123 and OOB_TAG_OFF is 0 when CONFIG_KASAN_GENERIC is enabled. So, in effect, the (buggy) code is this:
ptr[123] = 'x';
Now, Generic KASAN's memory granule size is 8 bytes. So, among the 123 bytes allocated, the fifteenth memory granule is the one being written to (as 8 * 15 = 120). The diagram that follows clearly shows the memory buffer and how it's been overflowed:
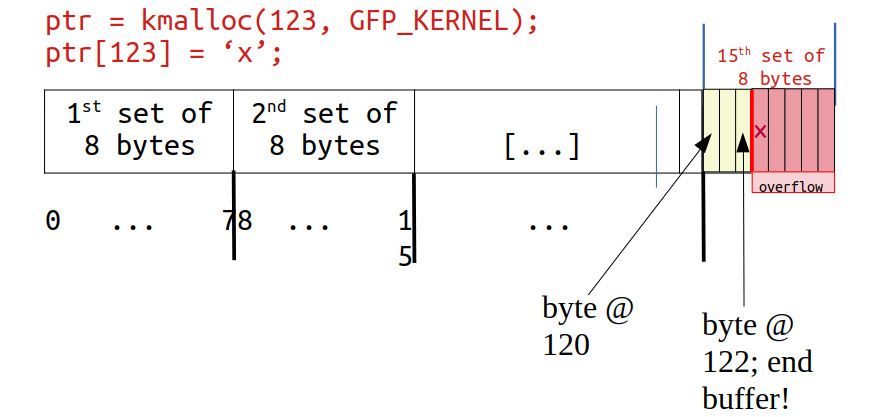
Figure 5.5 – The kmalloc'ed memory (slab) buffer that was overflowed
Check it out: Towards the right end, byte positions 120, 121, and 122 are valid and legal to read/write, but our KUnit KASAN test case deliberately wrote to byte position 123 – 1 byte beyond the end of the slab buffer, a clear OOB write overflow violation, and KASAN caught it! Not only that, as Figure 5.4 and Figure 5.5 clearly show, the kernel is intelligent enough to show the shadow value of 03 here, implying that the first 3 bytes are valid but the remaining 5 aren't – that's precisely the case!
Further, the surrounding bytes are set to the value 0xfc (see Figure 5.4). What does it mean? It's clear from the header – it's a red zone within the kernel SLUB object:
// mm/kasan/kasan.h
#ifdef CONFIG_KASAN_GENERIC
#define KASAN_FREE_PAGE 0xFF /* page was freed */
#define KASAN_PAGE_REDZONE 0xFE /* redzone for kmalloc_large allocations */
#define KASAN_KMALLOC_REDZONE 0xFC /* redzone inside slub object */
#define KASAN_KMALLOC_FREE 0xFB /* object was freed (kmem_cache_free/kfree) */
#define KASAN_KMALLOC_FREETRACK 0xFA /* object was freed and has free track set */
Back to our interpretation of Figure 5.4: The next line (BUG: KASAN: [...]) is just to show you that this continues with the next test case... KASAN has now caught the second test case's bug (KUNIT_CASE(kmalloc_oob_left)). The kernel log contains the same info as for the first defect: the bug summary by KASAN, the output of dump_stack() – the stack(s) call frames, who performed the allocation, the page-ownership info, and the memory state around the buggy access. This continues all the way to the thirty-eighth test case – fantastic!
A quick check of the kernel log shows what we expect – how the kernel's KUnit KASAN test case module has caught all 38 test cases with memory defects:
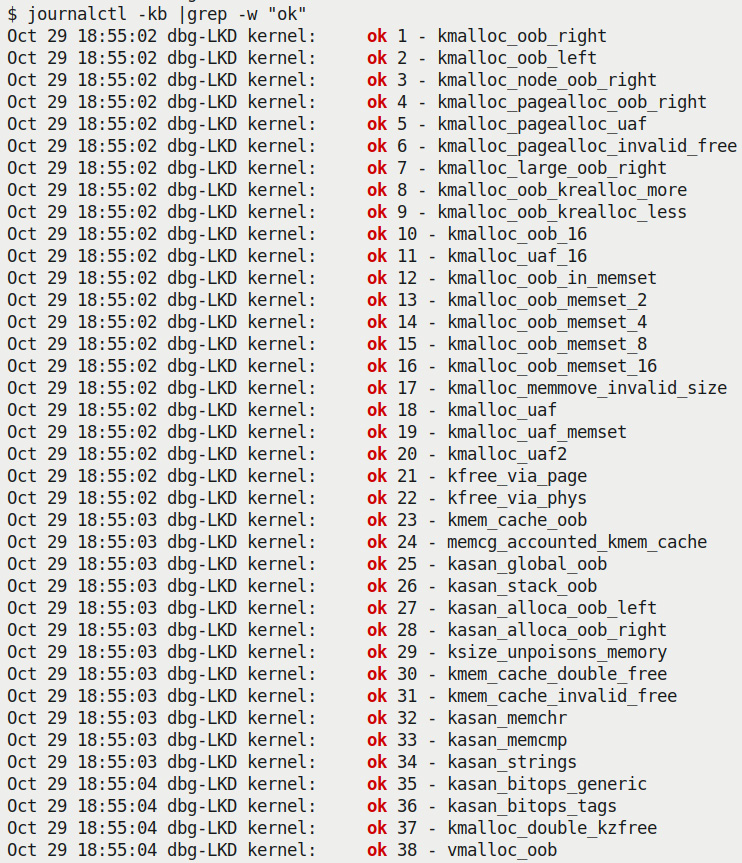
Figure 5.6 – Screenshot showing how the kernel's KUnit KASAN test case module has caught all 38 test cases with memory defects
As can be clearly seen from the preceding screenshot, all 38 test cases are reported as ok (passed).
Exercise
Do perform what we've just done – running the kernel's KUnit KASAN test cases – on your box. Note, from the kernel log, the various KASAN test cases and verify that all ran correctly.
By the way, notice this:
$ lsmod |egrep "kunit|kasan"
test_kasan 81920 0
kunit 49152 1 test_kasan
In my particular case, you can see from the lsmod output that KUnit has been configured as a kernel module.
You can learn how to write your own suite of KUnit test cases. Do see the Further reading section for more on using KUnit!
Remaining tests with our custom buggy kernel module
Did you notice, in spite of having run all the KASAN KUnit test cases, there appear to be a few remaining generic memory defects (as we identified both in Chapter 4, Debug via Instrumentation – Using Kprobes, as well as in the What's the problem with memory anyway? section of this chapter) that the KUnit test cases don't cover?
- The uninitialized memory read (UMR) bug
- The use-after-return (UAR) bug
- Simple memory leakage bugs (we'll discuss memory leakage in more detail later in this chapter)
So, I wrote a kernel module to exercise these test cases (when running the Generic KASAN-enabled debug kernel of course), along with some more interesting ones. To test against KASAN, remember to boot via your custom debug kernel, one that (obviously) has CONFIG_KASAN=y.
Due to space constraints, I won't show the entire code of our test module here (do refer to it on the book's GitHub repo and read the comments therein – you'll find it under the ch5/kmembugs_test folder). To get a flavor of it, let's take a peek at one of the test cases and how it's invoked. Here's the code of the UAR test case:
// ch5/kmembugs_test/kmembugs_test.c
/* The UAR - Use After Return - testcase */
static void *uar(void)
{volatile char name[NUM_ALLOC];
volatile int i;
    pr_info("testcase 2: UAR:
");
for (i=0; i<NUM_ALLOC-1; i++)
name[i] = 'x';
name[i] = '�';
return name;
}
The module is designed to be loaded up via a bash script named load_testmod and the test cases are run interactively (via a bash wrapper script named run_tests). The run_tests script (which you must run as root) displays a menu of available tests and asks you to select any one by typing in its assigned number. You can see a screenshot of the menu – and thus all the test cases you can try out – in Figure 5.8, in the section that follows.
The script then writes this number to our debugfs pseudofile here: /sys/kernel/debug/test_kmembugs/lkd_dbgfs_run_testcase. The debugfs write hook function then receives this data from userspace, validates it, and invokes the appropriate test case routine (via a rather long if-else ladder). This design allows you to test interactively and execute any test case(s) as many times as you wish to.
Here's a code snippet showing how our debugfs module code invokes the preceding uar() test case:
// ch5/kmembugs_test/debugfs_kmembugs.c
static ssize_t dbgfs_run_testcase(struct file *filp, const char __user *ubuf, size_t count, loff_t *fpos)
{char udata[MAXUPASS];
volatile char *res1 = NULL, *res2 = NULL;
[...]
if (copy_from_user(udata, ubuf, count))
return -EIO;
udata[count-1]='�';
    pr_debug("testcase to run: %s
", udata);
/* Now udata contains the data passed from userspace - the testcase # to run (as a string) */
if (!strncmp(udata, "1", 2))
umr();
else if (!strncmp(udata, "2", 2)) {res1 = uar();
       pr_info("testcase 2: UAR: res1 = "%s"
",
res1 == NULL ? "<whoops, it's NULL; UAR!>" : (char *)res1);
} else if (!strncmp(udata, "3.1", 4))
...
Clearly, this – test case #2 – is a defect, a bug. You know that local variables are valid only for their lifetime – while the function's executing. This, of course, is because local (or automatic) variables are allocated on the (kernel mode) stack frame of the process context in execution. Thus, you must stop referencing a local variable once outside the scope of its containing function. We (deliberately) don't! We attempt to fetch it as a return. The trouble is, by that time, it's gone...
Right, before diving into running the test cases (though there's no reason you can't run them right now), we divert into an interesting dilemma: how a known bug (like our UAR one) can at times appear to work perfectly fine.
Stale frames – trouble in paradise
The amazing (or crazy) thing about bugs like this one – the UAR defect – is that the code will sometimes seem to work! How come? It's like this: the memory holding the content of the local (automatic) variable is on the stack. Now, though we colloquially say that the stack frames are allocated on function entry and destroyed on function return (the so-called function prologue and epilogue), the reality isn't quite so dramatic.
The reality is that memory is typically allocated at page-level granularity. This includes the memory for stack pages. Thus, once a page of memory for the stack is allocated, there's usually enough for several frames (this, of course, depends on the circumstances). Then, when more memory for the stack is needed, it's grown (by allocating more pages, downwards, as it's the stack). The system knows where the top of the stack is by having the Stack Pointer (SP) register track this memory location. Also, you'll realize that the so-called "top of the stack" is typically the lowest legal address. Thus, when frames are allocated and/or a function is invoked, the SP register value reduces. When a function returns, the stack shrinks by adding to the SP register (remember, it's a downward-growing stack!). The following diagram is a representation of a typical kernel-mode stack on a (32-bit) Linux system:
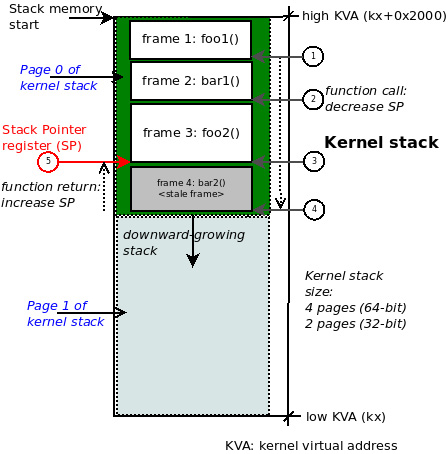
Figure 5.7 – A diagram of a typical kernel-mode stack on 32-bit Linux; function call chain: foo1() -> bar1() -> foo2() -> bar2()
So, it could well happen at some point that stale stack frames (and the corresponding data within them) exist underneath valid frames and could possibly be successfully referenced – without the system throwing a memory fault! – even later.
Carefully study Figure 5.7. As an example, we've shown the kernel-mode stack on a 32-bit Linux system, thus the size of the kernel stack will be 2 pages, typically 8 KB. Now, let's say the process context in execution (within the kernel) invoked these functions in this order (this is the call chain, shown as the circled steps 1 to 4 in the figure):
foo1() bar1() --> foo2() --> bar2()
Imagine we're at the leaf node, function bar2() in this example. It returns (circled step 5 above). This causes the SP register to get incremented back to the address of the call frame representing the function foo2(). So, though it remains intact on the stack, the stack memory of the call frame for function bar2() is now actually invalid! But an incorrect (read buggy) access to it might still succeed.
This should ideally not happen, but hey, it's an imperfect world, right?! The moral here: we require tools – and clear thinking is the best one – to catch tricky bugs such as UAS ones!
Right, back to our test cases! To run the tests, follow these steps:
- Run the following command:
cd <book_src>/ch5/kmembugs_test
- Load it up:
./load_testmod
[...]
This should have the kernel module built and loaded into memory with dmesg showing that the debugfs pseudofile here – <debugfs_mountpt>/test_kmembugs/lkd_dbgfs_run_testcase – has been created.
- Run our bash script to test:
sudo ./run_tests
Following is a screenshot showing that our test_kmembugs module is indeed loaded up (this was done via our load_testmod script), the menu shown via our run_tests script, and our running test case #2 – the UAR bug:

Figure 5.8 – Partial screenshot showing both the build and output of our kmembugs_test LKM
Here's an example screenshot of our test case framework catching the left OOB write buggy access via KASAN:

Figure 5.9 – Partial screenshot showing KASAN catching a buggy left OOB on write to global memory
- Firstly, the compilers, both GCC and Clang, are clever enough to warn us regarding the (here, pretty obvious) bugs. Both the UAR and UMR defects are indeed caught by them (at the precise place in the code where they occur), albeit as warnings! Here's one of the warnings emitted by GCC, clearly with regard to our UAR bug:
<...>/ch5/kmembugs_test/kmembugs_test.c:115:9: warning: function returns address of local variable [-Wreturn-local-addr]
115 | return (void *)name;
| ^~~~~~~~~~~~
This Is Important
It is your job as the programmer to carefully heed all compiler warnings and – as far as is humanely possible! – fix them.
- The script interrogates the kernel config file to see whether your current kernel is configured for KASAN, UBSAN, and KMEMLEAK and displays what it finds. It also shows the path to the debugfs pseudofile where the test case number will be written (in order to invoke that test).
Here's a sample run of the UAR test case:
$ sudo ./run_tests
[...]
(Type in the testcase number to run):
2
Running testcase""2" via test module now...
[ 144.313592] testcase to run: 2
[ 144.313597] test_kmembugs:uar(): testcase 2: UAR:
[ 144.313600] testcase 2: UAR: res1 = "<whoops,'it's NULL; UAR!>"
$
- The output in the kernel log (seen via dmesg above) clearly tells the story: we've executed the UAR test case, and neither the kernel nor KASAN has caught it (if it had, we'd see plenty of complaints in the log!). Our own code checks for the variable res1 being NULL and concludes that a UAR bug occurred. We can do this as we specifically initialized it to NULL and check after it's supposedly set to the string returned by the function uar(); else, we'd have not caught it.
All right, we're now done with several test cases with KASAN enabled. What's KASAN's scorecard like? The following section shows you just this.
KASAN – tabulating the results
What memory corruption bugs (defects) does KASAN actually manage to, and not manage to, catch? From our test runs, we tabulated the results in the table that follows. Do study it carefully, along with the notes that go with it:
.jpg)
.jpg)
Table 5.3 – Summary of memory defect and arithmetic UB test cases caught (or not) by KASAN
You'll find the explanations for the footnote notations seen in the table (such as [C1], [U1], and so on) below.
Test environment
- [1] The test case number: do refer to the source of the test kernel module to see it – ch5/kmembugs_test/kmembugs_test.c, the debugfs entry creation and usage in debugfs_kmembugs.c, and the bash scripts load_testmod and run_tests, all within the same folder.
- [2] The compiler used here is GCC version 9.3.0 on x86_64 Ubuntu Linux. A later section - Using Clang 13 on Ubuntu 21.10 - covers using the Clang 13 compiler.
- [3] To test with KASAN, I had to boot via our custom debug kernel (5.10.60-dbg01) with CONFIG_KASAN=y and CONFIG_KASAN_GENERIC=y. We assume the Generic KASAN variant is being used.
- Test cases 4.1 through 4.4 work both upon static (compile-time allocated) global memory as well as stack local memory. That's why the test case numbers are 4.x in both.
Compiler warnings
- Version: this is for GCC version 9.3.0 on x86_64 Ubuntu:
- [C1] The GCC compiler reports the UMR as a warning:
warning: '<var>' is used uninitialized in this function [-Wuninitialized]
- [C2] GCC reports the potential UAF defect as a warning:
warning: function returns address of local variable [-Wreturn-local-addr]
- [C3] GCC (quite cleverly!) catches the illegal copy_[to|from]_user() here. It figures out that the destination size is too small:
* In function 'check_copy_size',
inlined from 'copy_from_user' at ./include/linux/uaccess.h:191:6,
inlined from 'copy_user_test' at <...>/ch5/kmembugs_test/kmembugs_test.c:482:14:
./include/linux/thread_info.h:160:4: error: call to '__bad_copy_to' declared with attribute error: copy destination size is too small
160 | __bad_copy_to();
| ^~~~~~~~~~~~~~~
- [C1] The GCC compiler reports the UMR as a warning:
- With the Clang 13 compiler (we cover using Clang to build the kernel and modules in the Building your kernel and modules with Clang section), the warnings are pretty much identical as with GCC. In addition, it emits variable 'xxx' set but not used [-Wunused-but-set-variable].
The following section delves into the details – don't miss out!
KASAN – detailed notes on the tabulated results
The footnote notations for KASAN ([K1], [K2], and so on) are explained in detail here. It's really important to read through all the notes, as we've mentioned certain caveats and corner cases as well:
- [K1] KASAN catches and reports the OOB access on global static memory as follows:
global-out-of-bounds in <func>+0xstart/0xlen [modname]
Read/Write of size <n> at addr <addr> by task <taskname/PID>
The report will contain one of Read or Write depending upon whether a read or write buggy access occurred.
- [K2] Here, there are a number of caveats to note:
- The Out-Of-Bounds (OOB) read/write left underflow on the global memory test case is caught only when compiled with Clang version 11 or greater. It isn't even caught by GCC 10 or 11, due to the way its red zoning works.
- KASAN only catches global memory OOB accesses when compiled with Clang 11 and later! Thus, in my test runs with GCC 9.3 and Clang 10, I see it fails to catch the read/write underflow (left OOB) accesses on a global buffer (test cases 4.3 and 4.4)! Here, it does seem to catch the overflow defects on global memory, though you shouldn't take this for granted... (By the way, Clang is pronounced "clang" not "see-lang"). Also, though it's documented as supporting GCC from version 8.3.0 onward, this failed to catch (only) the read/write underflow bug test cases on global memory. Be sure to read the upcoming Compiling your kernel and module with Clang section!
- However, even with GCC 9.3, the way the internal red zoning and padding seems to work, it appears that the first declared global (which variable exactly depends on how the linker sets it up) may not have a left red zone, causing left OOB buggy accesses to be missed... This is why – as a silly workaround for now, until GCC's fixed – we use three global arrays. We pass the middle one as the test buffer to work upon (any but the first) in the test cases. Hopefully, GCC will be fixed - properly red zoned – and any and all OOB accesses are caught. With our particular test runs, the buggy left OOB accesses are caught on global memory, even when compiled with GCC 9.3!
- These observations, caveats, and what-have-you are by their very nature at times a bit iffy. They can end up working in one way on one system and quite another on a differently configured system or architecture. Thus, we heartily recommend you test your workload using an appropriately configured debug kernel with all tools at your disposal, including the usage of more recent compiler technology such as Clang, and the various tools and techniques covered in this book. Yes, it's a lot of work and yes, it's worth it!
- [K3] KASAN catches and reports the OOB access on stack local memory as follows:
stack-out-of-bounds in <func>+0xstart/0xlen [modname]
Read/Write of size <n> at addr <addr> by task <taskname/PID>
- [K4] KASAN catches and reports the OOB access on dynamic slab memory as follows:
BUG: KASAN: slab-out-of-bounds in <func>+0xstart/0xlen [modname]
Read/Write of size <n> at addr <addr> by task <taskname/PID>
- [K5] KASAN catches and reports the UAF defect as follows:
BUG: KASAN: use-after-free in <func>+0xstart/0xlen [modname]
Read/Write of size <n> at addr <addr> by task <taskname/PID>
- [K6] KASAN catches and reports the double-free as follows:
BUG: KASAN: double-free or invalid-free in <func>+0xstart/0xlen [modname]
- In all the above cases, KASAN's report also shows the actual violation in detail along with the process context, (kernel-mode stack) call trace, and the shadow memory map, showing which variable the OOB memory access belongs to (if applicable) as well as the memory state around the buggy address.
Tip – the All-Results-in-One-Place Table
For your ready reference, in Part 2 of this key topic (the next chapter), in the Catching memory defects in the kernel – comparisons and notes (Part 2) section, Table 6.4 tabulates our test case results for our test runs with all the tooling technologies – vanilla/distro kernel, compiler warnings, with KASAN, with UBSAN, and with SLUB debug – we employ in this chapter. In effect, it's a compilation of all the findings in one place, thus allowing you to make quick (and hopefully helpful) comparisons.
Did you notice regarding the kernel's built-in KUnit-based test cases on KASAN that the test_kasan kernel module does not have test cases for these three memory defects – the UMR, UAR, and memory leaks. Why? Simple: KASAN does not catch these bugs! Okay, so now what can we conclude? Well, the KUnit (and other) test suites are often run in an automated fashion where the expected end result is that all viable test cases are passed; in fact, they must pass. This wouldn't have happened had they contained these three defects, so they don't. Now, don't read it wrong – this is simply the way the test suites are designed. There certainly exist other means besides KASAN by which these defects will be caught. Relax – we'll get there and catch them.
Here and now, we're showing that KASAN itself doesn't catch these particular nasty bugs. Later in the book, we'll see which tools do.
FYI, KASAN is a key component to catching difficult-to-find bugs via the fuzzing approach. Syzkaller (aka syzbot) – the de facto powerful Linux kernel fuzzer – requires KASAN to be configured in the kernel! We cover fuzzing briefly in Chapter 12, A few More Kernel Debug Approaches, in the What is fuzzing? section. Be sure to check it out.
Good going – you now know how to leverage the power of KASAN to help catch those tricky memory bugs! Let's now move on to using UBSAN.
Using the UBSAN kernel checker to find Undefined Behavior
One of the serious issues with a language such as C is that the compiler produces code for the correct case, but when the source code does something unexpected or just plain wrong, the compiler often does not understand what to do – it simply and blithely ignores such cases. This actually helps in the generation of highly optimized code at the cost of (possible security) bugs! Examples of this are common: overflowing/underflowing an array, arithmetic defects (such as dividing by zero or overflowing/underflowing a signed integer), and so on. Even worse, at times the buggy code seems to work (as we saw with accessing stale stack memory in the Stale frames – trouble in paradise section). Similarly, bad code might work in the presence of optimization, or not. Thus, cases such as these cannot be predicted and are called Undefined Behavior (UB).
The kernel's Undefined Behavior Sanitizer (UBSAN) catches several types of runtime UB. As with KASAN, it uses Compile Time Instrumentation (CTI) to do so. With UBSAN enabled fully, the kernel code is compiled with the –fsanitize=undefined option switch. The UB caught by UBSAN includes the following:
- Arithmetic-related UB:
- Arithmetic overflow / underflow / divide by zero / and so on...
- OOB accesses while bit shifting
- Memory-related UB:
- OOB accesses on arrays
- NULL pointer dereferences
- Misaligned memory accesses
- Object size mismatches
Some of these defects in fact overlap with what Generic KASAN catches as well. UBSAN instrumented code is certainly larger and slower (by a factor of 2 or 3 times). Still, it's very useful – especially during development and unit testing – to catch UB defects. In fact, enabling UBSAN on production systems is feasible if you can afford the larger kernel text size and processor overheads (on everything besides tiny embedded systems, you probably can).
Configuring the kernel for UBSAN
Within the make menuconfig UI, you'll find the menu system for UBSAN at Kernel hacking | Generic Kernel Debugging Instruments | Undefined behaviour sanity checker.
A screenshot of the relevant menu is seen here:

Figure 5.10 – Partial screenshot of the UBSAN menu for the Linux kernel config
To work with it, you should turn on the following kernel configs: CONFIG_UBSAN, CONFIG_UBSAN_BOUNDS (performs bound checking on array indices for static arrays – very useful!), CONFIG_UBSAN_MISC, and CONFIG_UBSAN_SANITIZE_ALL (you can look up the details for each here: lib/Kconfig.ubsan). Setting CONFIG_TEST_UBSAN=m has the lib/test_ubsan.c code built as a module.
UBSAN – Effect on the Build
With CONFIG_UBSAN=y, building the kernel source tree by passing the V=1 parameter will show the details, the GCC flags being passed, and more. Here's a snippet of what you see focused on the GCC flags passed during the build due to UBSAN being enabled:
make V=1
gcc -Wp,-MMD,[...] -fsanitize=bounds -fsanitize=shift -fsanitize=integer-divide-by-zero -fsanitize=unreachable -fsanitize=signed-integer-overflow -fsanitize=object-size -fsanitize=bool -fsanitize=enum [...]
Hunting down UB with UBSAN
Detecting UB on OOB (static) array accesses (and the like) is where UBSAN shines. Take, for example, our test case #4.4. We define a few static global arrays like this:
static char global_arr1[10], global_arr2[10], global_arr3[10];
Why Declare Three Global Arrays and Not Just One?
Well, as of this writing, there seems to be an issue with the way that the GCC compiler (at least as of version 9.3) sets up red zoning for global data. We observe that the red zone for the first global in a module may not have its left red zone correctly set up, causing the left OOB (underflow) buggy accesses to be missed as a side effect! So, by setting up three global arrays and passing the pointer to any but the first (we set up our test cases to pass the pointer to the second one), KASAN and UBSAN should be able to catch the buggy access! (Do note that the ordering of global variables within a module depends on the linker). This issue does not seem to occur with Clang 11+.
Interestingly, our efforts on this will eventually pay off: due to my reporting the issue – left OOB failing with GCC – as well as pointing out that the kernel's test_kasan module doesn't test for it, Marco Elver (the current KCSAN maintainer) has investigated this and added a patch to include this test case – add globals left-out-of-bounds test – to the test_kasan module (17 Nov 2021 – see here: https://lore.kernel.org/all/[email protected]/T/#u). Further, this book's very able technical reviewer, Chi-Thanh Hoang, has figured out that this is essentially due to GCC's lack of a left red zone (as mentioned above) and added this information to the kernel Bugzilla (https://bugzilla.kernel.org/show_bug.cgi?id=215051). The hope is that GCC maintainers will pick this up and suggest or implement a fix.
Below, we show one of our buggy test cases – the right OOB accesses on global memory – accessing one of these global arrays, incorrectly of course, for both read and write (I only show a portion of its code here). Note that the parameter p is a pointer to a piece of global memory within this module, typically the second one, global_arr2[]:
Here's its invocation via our debugfs hook:
[...] else if (!strncmp(udata, "4.4", 4))
global_mem_oob_left(WRITE, global_arr2);
Here's the (partial) code (note that the // style comments might spill over a line here; in the code they're fine):
int global_mem_oob_right(int mode, char *p)
{volatile char w, x, y, z;
volatile char local_arr[20];
char *volatile ptr = p + ARRSZ + 3; // OOB right
[...]
} else if (mode == WRITE) {*(volatile char *)ptr = 'x'; // invalid, OOB right write
p[ARRSZ - 3] = 'w'; // valid and within bounds
p[ARRSZ + 3] = 'x'; // invalid, OOB right write
local_arr[ARRAY_SIZE(local_arr) - 5] = 'y'; // valid and within bounds
local_arr[ARRAY_SIZE(local_arr) + 5] = 'z'; // invalid, OOB right write
} [...]
Once it detects a buggy access to memory (like the ones above), UBAN displays an error report like this to the kernel log:
array-index-out-of-bounds in <C-source-pathname.c>:<line#>
index <index> is out of range for type '<var-type> [<size>]'
Here's a screenshot showing just this. The right window shows the kernel log. For this case, ignore the top portion of the log – it's part of the error report from KASAN. The remainder – what we're interested in – is from UBSAN:
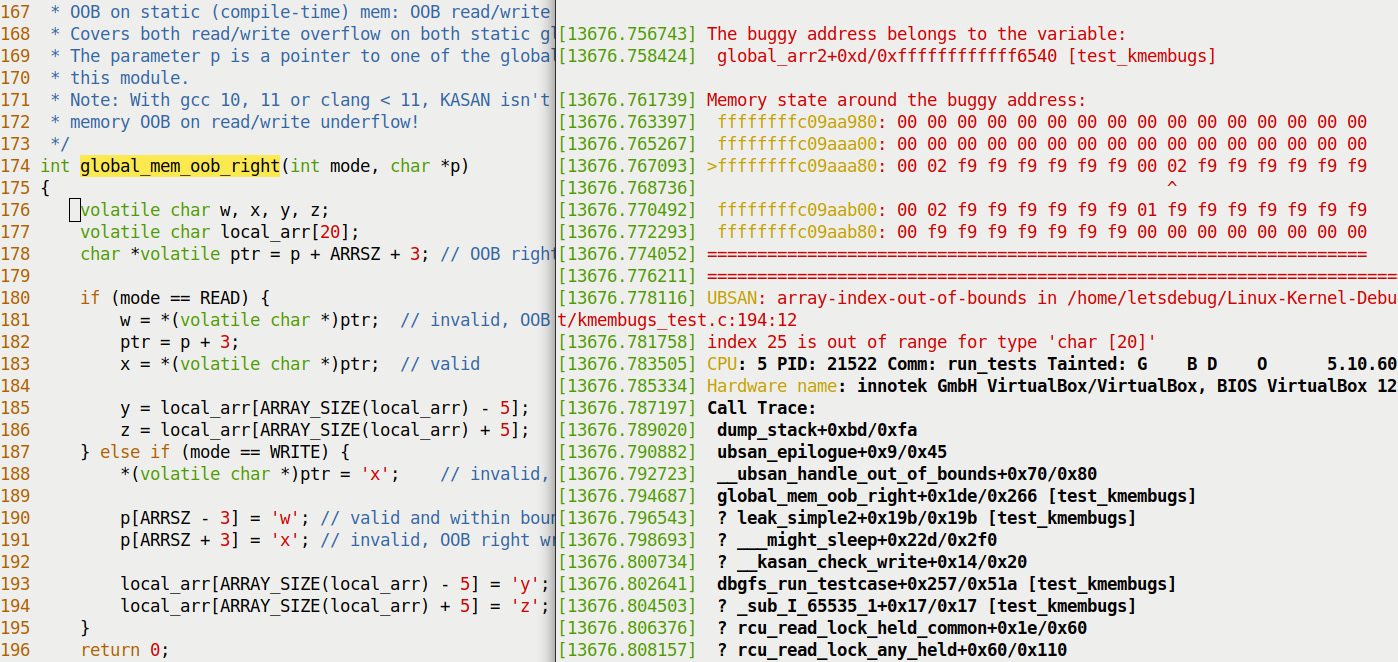
Figure 5.11 – Partial screenshot 1 of 3 showing UBSAN catching the right OOB write to a stack local variable
Here you can see how UBSAN has precisely caught the UB on line 194 – the attempt to write after the end legal index of the local (stack-based) array! Of course, it's entirely possible the line number you see here might change over time due to modifications to the code.
After this, test case # 4.3 intentionally, adventurously – and disastrously – now attempts a read underflow on a local stack memory variable. This too is cleanly caught by UBSAN! The following partial screenshot shows you the juicy bit:

Figure 5.12 – Partial screenshot 2 of 3 showing UBSAN catching the left OOB read on a stack local variable
Again, UBSAN even shows the source filename and line number where the buggy access was attempted!
It's more generic: UBSAN catches memory accesses when the variable in question indexes the static memory array incorrectly – when the index is out of bounds in any manner (left or right, underflow or overflow). It does appear, though, to miss buggy accesses made purely via pointers! KASAN has no issue with this and catches them all.
Just as we saw with KASAN (in the Remaining tests with our custom buggy kernel module section), UBSAN also cannot catch all memory defects. To prove this, we again run our custom buggy kernel module (in ch5/kmembugs_test), with pretty much identical results: even on a UBSAN-enabled kernel, these three bugs – the UMR, UAR, and memory leakage bugs – aren't caught! The following screenshot tells the story (to capture this, I (first) ran the run_tests script for the first three test cases with the --no-clear parameter, in order to preserve the kernel log content):
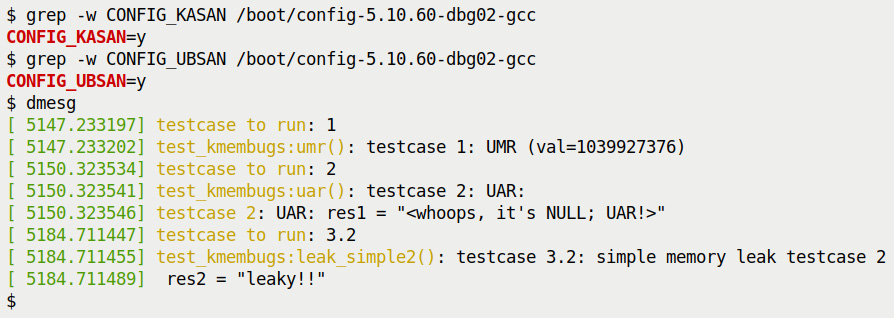
Figure 5.13 – Screenshot 3 of 3: executing the first three – UMR, UAR, and leakage – test cases with our test module reveals that both KASAN and UBSAN (enabled in kernel) don't catch them
Also, don't forget: UBSAN is quite adept at catching arithmetic-related UB too – things such as overflowing or underflowing arithmetic calculations, the well-known Integer OverFlow (IoF) defect, and the divide-by-zero bugs being common and dangerous ones indeed! We mentioned the arithmetic UB that UBSAN can catch at the beginning of this section on UBSAN. We don't delve further into it as our topic is memory defects. To see more of UBSAN in action, you can always read the code of the UBSAN test module within the kernel (lib/test_ubsan.c) and try it out – I encourage you to do so. On a somewhat related note, understanding what unaligned memory access is, how it can cause issues, and how to avoid it is the topic of this kernel documentation page: Unaligned Memory Accesses: https://www.kernel.org/doc/html/latest/core-api/unaligned-memory-access.html#unaligned-memory-accesses.
Okay, let's tabulate the result of our experiments by running various test cases with UBSAN enabled within the kernel. Refer to the following table:
.jpg)
.jpg)
Table 5.4 – Summary of memory defect and arithmetic UB test cases caught (or not) by UBSAN
The following is with respect to the numeric footnotes in the preceding table:
- [1] The test case number: do refer to the source of the test kernel module to see it – ch5/kmembugs_test/kmembugs_test.c, the debugfs entry creation and usage in debugfs_kmembugs.c, and the bash scripts load_testmod and run_tests, all within the same folder.
- [2] The compiler used here is GCC version 9.3.0 on x86_64 Ubuntu Linux. A later section covers using the Clang 13 compiler.
- [3] To test with UBSAN, I booted via our custom production kernel (5.10.60-prod01) with CONFIG_UBSAN=y and CONFIG_UBSAN_SANITIZE_ALL=y.
- Test cases 4.1 through 4.4 work both upon static (compile-time allocated) global memory as well as stack local memory. That's why the test case numbers are 4.x in both.
The following section delves into the details. Don't miss out!
UBSAN – detailed notes on the tabulated results
The footnote notations in the preceding table (such as [U1], [U2], and so on) are explained in detail here. It's important to read through all the notes, as we've mentioned certain caveats and corner cases as well:
- [U1] UBSAN catches and reports the OOB access on global static memory:
array-index-out-of-bounds in <C-source-pathname.c>:<line#>
index <index> is out of range for type '<var-type> [<size>]'
- [U2] When relevant, UBSAN also reports an object size mismatch for [U1] as follows:
object-size-mismatch in <C-source-pathname.c>:<line#>
store to address <addr> with insufficient space for an object of type '<var-type>'
In the preceding cases, UBSAN also reports the actual violation in some detail along with the process context and kernel-mode stack call trace.
Note though, that with KASAN turned off (I rebuilt a test debug kernel with CONFIG_KASAN=n) and UBSAN turned on, the semantics seem a bit different: in this case, I got a segfault only, with, of course, the kernel log clearly showing the source of the bug (by looking up what the instruction pointer register, here, RIP, was pointing to at the time of the fault).
Note
As mentioned earlier, don't forget to look up Table 6.4 in the following chapter, effectively, an all-results-in-one-place comparison table.
Great, now you're much better armed to catch memory bugs with both KASAN and UBSAN! I suggest you first take the time to absorb all this information, read the relevant detailed notes in the later Catching memory defects in the kernel – comparisons and notes (Part 1) section (pertaining to KASAN and UBSAN, at least for now), and practice trying out these test cases on your own. But wait: we saw that some OOB defects are only caught when compiled with Clang 11 or later. This is a key thing. So, let's now learn how to use the modern Clang compiler.
Building your kernel and modules with Clang
Low Level Virtual Machine (LLVM) is the original name given to this modular compiler tooling project. It now doesn't have much to do with traditional virtual machines and is instead a powerful backend for several compilers and toolchains.
Clang (the pronunciation rhymes with "slang") is a modern compiler frontend technology for C-type languages (includes support for C, C++, CUDA, Objective C/C++, and more) and is based on the LLVM compiler. It's considered a drop-in replacement for GCC. Clang currently seems to have a significant advantage over GCC – especially from our point of view – generating superior diagnostics as well as being able to intelligently generate code avoiding OOB accesses. This is critical. It paves the way to superior code. We saw (in the previous section on KASAN) that faulty left-OOB accesses on global memory, not reliably caught by GCC (versions 9.3, 10, and 11), are caught with Clang! The Android project is a key user of Clang, among many others.
Attempting to build your kernel module with Clang while the target kernel itself is compiled via GCC is simply not good enough! You'll have to use the same compiler for both – the underlying ABI needs to be completely consistent (this was one of the many things pointed out to me by Marco Elver when I was puzzled and asked why KASAN failed to catch certain test cases – again, the beauty of open source development). So, the upshot of it all is that we'll have to compile both our kernel and module with Clang 11.
Installing Clang and associated binaries in order to successfully compile your kernel module involves running the following command (on our Ubuntu 20.04 LTS guest):
sudo apt install clang-11 --install-suggests
Further, we seem to require setting up a soft link to llvm-objdump-11 named llvm-objdump (this is likely as I have both Clang 10 and Clang 11 installed simultaneously):
sudo ln -s /usr/bin/llvm-objdump-11 /usr/bin/llvm-objdump
Hang on, a simpler approach follows...
Using Clang 13 on Ubuntu 21.10
For the purpose of using Clang on the kernel and module builds, instead of installing Clang 11 (or later) on Ubuntu 20.04 LTS, it might just be simpler to install Ubuntu 21.10 (I've done so as an x86_64 VM) as it ships with Clang 13 preinstalled. I then built the very same 5.10.60 kernel as a debug kernel, applying a similar debug config as was discussed back in Chapter 1, A General Introduction to Debugging Software, but this time with Clang.
Importantly, to specify using Clang (and not GCC) as the compiler, when building the kernel, set the CC variable to it:
$ time make -j8 CC=clang
SYNC include/config/auto.conf.cmd
*
* Restart config...
* Memory initialization
*
The first time you run this command, the kbuild system detects that with the Clang compiler, certain add-ons now become available and viable to use (that couldn't be used with GCC) and prompts us to configure it:
Initialize kernel stack variables at function entry
> 1. no automatic initialization (weakest) (INIT_STACK_NONE)
2. 0xAA-init everything on the stack (strongest) (INIT_STACK_ALL_PATTERN) (NEW)
3. zero-init everything on the stack (strongest and safest) (INIT_STACK_ALL_ZERO) (NEW)
choice[1-3?]:
Though it would be very useful to take advantage of this auto-initialization of kernel stack variables, I deliberately left it at the default (option 1) in order to check our tooling to catch the UMR defect. Similarly, the build asked the following. Here, I kept the defaults by simply pressing the Enter key. You could change them if you wish to:
Enable heap memory zeroing on allocation by default (INIT_ON_ALLOC_DEFAULT_ON) [Y/n/?] y
Enable heap memory zeroing on free by default (INIT_ON_FREE_DEFAULT_ON) [Y/n/?] y
*
* KASAN: runtime memory debugger
*
KASAN: runtime memory debugger (KASAN) [Y/n/?] y
KASAN mode
> 1. Generic mode (KASAN_GENERIC)
choice[1]: 1
[...]
Back mappings in vmalloc space with real shadow memory (KASAN_VMALLOC) [Y/n/?] y
KUnit-compatible tests of KASAN bug detection capabilities (KASAN_KUNIT_TEST) [M/n/?] m
[...]
Once built, perform the usual remaining steps, not forgetting to add the CC=clang environment variable to the command line:
sudo make CC=clang modules_install && sudo make CC=clang install
When done, reboot and ensure you boot into your spanking new Clang-built debug kernel! Verify with the following:
$ cat /proc/version
Linux version 5.10.60-dbg02 (letsdebug@letsdebug-VirtualBox) (Ubuntu clang version 13.0.0-2, GNU ld (GNU Binutils for Ubuntu) 2.37) #4 SMP PREEMPT Wed ...
Now, let's move on to building our kernel module with Clang:
cd <book_src>/ch5/kmembugs_test
make CC=clang
That's it – I've conditionally embedded this setting of the CC variable into our load_testmod bash script, based on which compiler was used to build the current kernel. Also, FYI, to distinguish between our custom debug kernel built with Clang and GCC, the former's uname -r output shows up as seen here, 5.10.60-dbg02, whereas the latter's name shows up as 5.10.60-dbg02-gcc.
Exercise
I'll leave it as an exercise to you to build both a (debug) kernel as well as our test_kmembugs.ko kernel module with Clang and run the test cases.
With this, we complete the first part of our detailed coverage on understanding and catching memory defects within the kernel! Great going. Let's complete this chapter with a kind of summarization of the many tools and techniques we've used so far.
Catching memory defects in the kernel – comparisons and notes (Part 1)
As we've already mentioned in this chapter, the following table tabulates our test case results for our test runs with all the tooling technologies/kernels – vanilla/distro kernel, compiler warnings, and with KASAN and UBSAN with our debug kernel – we employed in this chapter. In effect, it's a compilation of all our findings so far in one place, thus allowing you to make quick (and hopefully helpful) comparisons:
1.jpg)
1.jpg)
Table 5.5 – Summary of various common memory defects and how various technologies react in catching them (or not)
Of course, the explanations of the footnotes within this table (such as [C1], [K1], [U1], and so on) can be found in the earlier relevant section.
So, here's a very brief summary:
- KASAN catches pretty much all OOB buggy memory accesses on global (static), stack local, and dynamic (slab) memory. UBSAN doesn't catch the dynamic slab memory OOB accesses (test cases 4.x and 5.x).
- KASAN does not catch the UB defects (test cases 8.x); UBSAN does catch (most of) them.
- Neither KASAN nor UBSAN catch the first three test cases – UMR, UAR, and leakage bugs, but the compiler(s) generate warnings and static analyzers (cppcheck) can catch some of them. (We in fact cover using a static analyzer to catch this tricky UAR bug in Chapter 12, A few more kernel debugging approaches in the Examples – using cppcheck, checkpatch.pl for static analysis section).
- The kernel kmemleak infrastructure catches kernel memory leaks allocated by any of k{m|z}alloc(), vmalloc(), or kmem_cache_alloc() (and friends) interfaces.
Regarding the preceding table, a few remaining notes now follow...
Miscellaneous notes
A few more points regarding Table 5.5:
- [V1]: The system could simply Oops, hang here, or even appear to remain unscathed, but that's not really the case... Once the kernel is buggy, the system is buggy.
- [V2]: Please see the explanation for this detailed in the following chapter, in the Running SLUB debug test cases on a kernel with slub_debug turned off section
A quick note on a KASAN alternative, especially for production systems, follows.
Introducing KFENCE – Kernel Electric-Fence
The Linux kernel has recent tooling named Kernel Electric-Fence (KFENCE). It's available from kernel version 5.12 onward (very recent, as of this writing).
KFENCE is described as a low-overhead sampling-based memory safety error detector of heap use-after-free, invalid-free, and out-of-bounds access errors.
It has recently added support for both x86 and ARM64 architectures with hooks to both the SLAB and SLUB memory allocators within the kernel. Why is KFENCE useful when we already have KASAN (which seems to overlap in function with it)? Here are a few points to help differentiate between them:
- KFENCE has been designed for use in production systems; KASAN's overhead would be too high for typical production systems and is suitable only on debug / development systems. KFENCE's performance overhead is minimal – close to zero.
- KFENCE works on a sampling-based design. It trades precision for performance, thus, with sufficiently lengthy uptime, KFENCE is almost certain to catch bugs! One way to have a really long total uptime is by deploying it across a fleet of machines.
- In effect, KASAN will catch all memory defects, but at a rather high performance cost. KFENCE also can catch all memory defects, at virtually no performance cost, but it takes time (very long uptimes are required, as it's a sampling-based approach). Thus, to catch memory defects on debug and development systems, use KASAN (and KFENCE, perhaps); to do the same on production systems, use KFENCE.
To enable KFENCE, set CONFIG_KFENCE=y (note, though, that as it's very recent, this config option isn't present in the 5.10 kernel series we work upon in this book). You can see more options and fine-tune them based on options present in the lib/Kconfig.kfence file.
We refer you to the details (including setup, tuning, interpreting error reports, internal implementation, and more) in the official kernel documentation page on KFENCE here: https://www.kernel.org/doc/html/latest/dev-tools/kfence.html#kernel-electric-fence-kfence.
A final point: with the 5.18 kernel (the latest stable one as of this writing), a new stricter memcpy() API family (covering the memcpy(), memmove() and memset() APIs), compile-time bounds checking kernel feature, has been introduced. It internally uses the compiler fortification feature (the kernel config is called CONFIG_FORTIFY_SOURCE). This being turned on helps catch a large class of typical buffer overflow defects within the kernel! Read more in LWN article here: Strict memcpy() bounds checking for the kernel: https://lwn.net/Articles/864521/.
Summary
With a non-managed programming language such as C, a trade-off exists: high power and the ability to code virtually anything you can imagine but at a significant cost. With memory being managed directly by the programmer, slipping in memory defects – bugs! – of all kinds, is rather easy to do, even for experienced folk.
In this chapter, we covered many tools, techniques, and approaches in this regard. First, you learned about the different (scary) types of memory defects. Then, we delved into how to use various tools and techniques to identify them and thus be able to fix them.
One of the most powerful tools in your arsenal for detecting memory bugs is KASAN. You learned how to configure and use it. We first learned how to use the kernel's built-in KUnit test framework to run memory test cases for KASAN to catch. We then developed our own custom module with test cases and even a neat way to test, via a debugfs pseudofile and custom scripts.
Catching UB with UBSAN came next. You learned how to configure it and leverage it to catch these kinds of defects, often overlooked, leading to not only buggy headaches but even security holes in production systems!
We learned that while GCC is solid and has been around for decades, a newer compiler, Clang, is in fact proving more adept at generating useful diagnostics (on our C code) and catching bugs that even GCC can miss! You saw how to use Clang to build the kernel and your modules, helping create more robust software, in effect.
As we covered these tools and frameworks, we tabulated the results, showing you the bugs a given tool can (or cannot) catch. To then summarize the whole thing, we built a larger table with columns covering all the test cases and all the tools – a quick and useful way for you to see and compare them (Table 5.5)! Note that we'll add to this table in the following chapter! Finally, we mentioned that the (very recent) KFENCE framework can (should) be used on production systems, in lieu of KASAN. The 5.18 kernel's CONFIG_FORTIFY_SOURCE config will likely be a big help as well.
So, congrats on completing this rather long – and really important – first chapter on catching memory bugs in kernel space! Do take the time to digest it and practice all you've learned. When set, I encourage you to move on to the next chapter where we'll complete our coverage on catching kernel memory defects.
Further reading
- Rust in the Linux kernel?
- Rust in the Linux kernel, Apr 2021, Google security blog: https://security.googleblog.com/2021/04/rust-in-linux-kernel.html
- Let the Linux kernel Rust, J Wallen, July 2021, TechRepublic: https://www.techrepublic.com/article/let-the-linux-kernel-rust/
- Linus Torvalds weighs in on Rust language in the Linux kernel, ars technica, Mar 2021: https://arstechnica.com/gadgets/2021/03/linus-torvalds-weighs-in-on-rust-language-in-the-linux-kernel/
- Linux kernel security:
- Several links and info here, from my Linux Kernel Programming book's Further reading section: https://github.com/PacktPublishing/Linux-Kernel-Programming/blob/master/Further_Reading.md#kernel_sec
- How a simple Linux kernel memory corruption bug can lead to complete system compromise, Jann Horn, Project Zero, Oct 2021: https://googleprojectzero.blogspot.com/2021/10/how-simple-linux-kernel-memory.html
- Undefined Behavior (UB) – what is it?
- Very comprehensive: A Guide to Undefined Behavior in C and C++, Part 1, John Regehr, July 2010: https://blog.regehr.org/archives/213
- What Every C Programmer Should Know About Undefined Behavior #1/3, LLVM blog, May 2011: http://blog.llvm.org/2011/05/what-every-c-programmer-should-know.html
- KASAN – the Kernel Address Sanitizer:
- Official kernel documentation: The Kernel Address Sanitizer (KASAN): https://www.kernel.org/doc/html/latest/dev-tools/kasan.html#the-kernel-address-sanitizer-kasan
- [K]ASAN internal working: https://github.com/google/sanitizers/wiki/AddressSanitizerAlgorithm
- The ARM64 memory tagging extension in Linux, Jon Corbet, LWN, Oct 2020: https://lwn.net/Articles/834289/
- How to use KASAN to debug memory corruption in an OpenStack environment: https://www.slideshare.net/GavinGuo3/how-to-use-kasan-to-debug-memory-corruption-in-openstack-environment-2
- Android AOSP: Building a pixel kernel with KASAN+KCOV: https://source.android.com/devices/tech/debug/kasan-kcov
- FYI, the original V2 KASAN patch post: [RFC/PATCH v2 00/10] Kernel address sainitzer (KASan) - dynamic memory error deetector., LWN, Sept 2014: https://lwn.net/Articles/611410/
- UBSAN:
- The Undefined Behavior Sanitizer – UBSAN: https://www.kernel.org/doc/html/latest/dev-tools/ubsan.html#the-undefined-behavior-sanitizer-ubsan
- Improving Application Security with UndefinedBehaviorSanitizer (UBSan) and GCC, Meirowitz, May 2021: https://blogs.oracle.com/linux/post/improving-application-security-with-undefinedbehaviorsanitizer-ubsan-and-gcc
- Clang 13 documentation: UndefinedBehaviorSanitizer: https://clang.llvm.org/docs/UndefinedBehaviorSanitizer.html
- Android AOSP: Integer Overflow Sanitization: https://source.android.com/devices/tech/debug/intsan
- Kernel built-in test frameworks:
- KUnit – Unit Testing for the Linux Kernel: https://www.kernel.org/doc/html/latest/dev-tools/kunit/index.html#kunit-unit-testing-for-the-linux-kernel
- Linux Kernel Selftests: https://www.kernel.org/doc/html/latest/dev-tools/kselftest.html#linux-kernel-selftests
- KFENCE: official kernel documentation (only from ver 5.12): https://www.kernel.org/doc/html/latest/dev-tools/kfence.html#kernel-electric-fence-kfence
With regard to the 5.18 mainline kernel: Strict memcpy() bounds checking for the kernel, Jon Corbet, July 2021: https://lwn.net/Articles/864521/
- Though it's with respect to userspace, useful: Memory error checking in C and C++: Comparing Sanitizers and Valgrind, Red Hat Developer, May 2021: https://developers.redhat.com/blog/2021/05/05/memory-error-checking-in-c-and-c-comparing-sanitizers-and-valgrind.