
Chapter 4: Debug via Instrumentation – Kprobes
A kernel probe (kprobe) is one of the powerful weapons in our debug/performance/observability armory! Here, you'll learn what exactly it can do for you and how to leverage it, with the emphasis being on debug scenarios. You will find that there's a so-called static and a dynamic probing approach to using them... We'll also cover using a way to figure out the return value of any function via a kernel return probe (kretprobe)!
Along the way, you'll learn what the Application Binary Interface (ABI) is and why it's important to know at least the basics of the processor ABI.
Don't miss delving into the section on dynamic kprobes or kprobe-based event tracing, as well as employing the perf-tools and (especially) the modern eBPF BCC frontends – it makes it all so much easier!
In this chapter, we're going to cover the following main topics:
- Understanding kprobes basics
- Using static kprobes – traditional approaches to probing
- Understanding the basics of the ABI
- Using static kprobes – demo 3 and demo 4
- Getting started with kretprobes
- Kprobes – limitations and downsides
- The easier way – dynamic kprobes or kprobe-based event tracing
- Trapping into the execve() API – via perf and eBPF tooling
Understanding kprobes basics
A kernel probe (Kprobe, kprobe, or simply probe) is a way to hook or trap into (almost) any function in the kernel proper or within a kernel module, including interrupt handlers. You can think of kprobes as a dynamic analysis/instrumentation toolset that can even be used on production systems to collect (and later analyze) debugging and/or performance-related telemetry.
To use it, kprobes have to be enabled in the kernel; the kernel config CONFIG_KPROBES must be set to y (you'll typically find it under the General architecture-dependent options menu). Selecting it automatically selects CONFIG_KALLSYMS=y as well. With kprobes, you can set up three – all optional – types of traps or hooks. To illustrate, let's say you want to trap into the kernel function do_sys_open() (which is the kernel function invoked when a userspace process or thread issues the open(2) system call; see the System calls and where they land in the kernel section for more details). Now, via the kernel kprobes infrastructure, you can set up the following:
- A pre-handler routine: Invoked just before the call to do_sys_open().
- A post-handler routine: Invoked just after the call to do_sys_open().
- A fault-handler routine: Invoked if, during the execution of the pre or post handler, a processor fault (exception) is generated (or if kprobes is single-stepping instructions); often, a page fault can occur triggering the fault handler.
They're optional – it's up to you to set up one or more of them. Further, there are two broad types of kprobes you can register (and subsequently unregister):
- The regular kprobe: via the [un]register_kprobe[s]() kernel APIs
- A return probe or kretprobe: via the [un]register_kretprobe[s]() kernel APIs, providing access to the probed function's return value
Let's first work with the regular kprobe and come to the kretprobe a bit later... To trap into a kernel or module function, issue the kernel API:
#include <linux/kprobes.h>
int register_kprobe(struct kprobe *p);
The parameter, a pointer to struct kprobe, contains the details; the key members we need to be concerned with are the following:
- const char *symbol_name: The name of the kernel or module function to trap into (internally, the framework employs the kallsyms_lookup() API – or a variation of it – to resolve the symbol name into a kernel virtual address (KVA), and store it in a member named addr). There are a few limitations on which functions you can and cannot trap into (we cover this in the Kprobes – limitations and downsides section).
- kprobe_pre_handler_t pre_handler: The pre-handler routine function pointer, called just before addr is executed.
- kprobe_post_handler_t post_handler: The post-handler routine function pointer, called just after addr is executed.
- kprobe_fault_handler_t fault_handler: The function pointer to a fault handling routine, which is invoked if executing addr causes a fault of any kind. You must return the value 0 to inform the kernel that it must actually handle the fault (typical) and return 1 if you handled it (uncommon).
Without going into the gory details, it's interesting to realize that you can even set up a probe to a specified offset within a function! This is achieved by setting the offset member of the kprobe structure to the desired value (watch out though: the offset should be used with care, especially on Complex Instruction Set Computing (CISC) machines).
Once done, you're expected to release the trap or probe (often on module exit), via the unregister routine:
void unregister_kprobe(struct kprobe *p);
Failing to do so will cause a kernel bug(s) and freeze when that kprobe is next hit; a resource leak failure of a sort.
How Do Kprobes Work under the Hood?
Unfortunately, this topic lies beyond the scope of this book. Interested readers can certainly refer to the excellent kernel documentation, which explains the fundamentals of how kprobes actually work: Concepts: Kprobes and Return Probes: https://www.kernel.org/doc/html/latest/trace/kprobes.html#concepts-kprobes-and-return-probes.
What we intend to do
This kind of methodology to set up a probe – where, if any change in the function to be probed or in the output format is required, it requires a recompile of the module code – is called a static kprobe. Is there any other way? Indeed there is: modern Linux kernels have the infrastructure – mostly via the deep ftrace and tracepoints framework, called dynamic probing or kprobe-based event tracing. There's no C code to write and deal with and no recompile necessary!
In the following sections, we'll show you different ways of setting things up, going from the traditional "manual" static kprobes interface approaches to the more recent and advanced dynamic kernel probes/tracepoints approach. To make this interesting, here's how we'll go about writing a few demos, most of which will trap into the kernel file open code path:
- Demo 1 - Traditional and manual approach – simplest case: attaching a static kprobe, hardcoding it to trap into the open system call; code: ch4/kprobes/1_kprobe
- Demo 2 - Traditional and manual approach: attaching a static kprobe, slightly better than our Demo 1, softcoding it via a module parameter (to the open system call); code: ch4/kprobes/2_kprobe
- Demo 3 - Traditional and manual approach: attaching a static kprobe via a module parameter (to the open system call), plus retrieving the pathname to the file being opened (useful!); code: ch4/kprobes/3_kprobe
- Demo 4 - Traditional, semi-automated approach: a helper script generates a template for both the kernel module C code and the Makefile, enabling attaching a static kprobe to any function specified via the module parameter; code: ch4/kprobes/4_kprobe_helper
- Next, we'll take a quick look at what a return probe is – the kretprobe – and how to use it (static).
- Modern, easier, dynamic event tracing approach: attaching a dynamic kprobe (as well as a kretprobe) to both the open and the execve system calls, retrieving the pathname to the file being opened/executed
- Modern, easier, and powerful eBPF approach: tracing the file open and the execve system calls.
Great – we'll begin with the traditional static kprobes approaches. Let's get going!
Using static kprobes – traditional approaches to probing
In this section, we'll cover writing kernel modules that can probe a kernel or module function in the traditional manner – statically. Any modifications will require a recompile of the source.
Demo 1 – static kprobe – trapping into the file open the traditional static kprobes way – simplest case
Right, let's see how we can trap into (or intercept) the do_sys_open() kernel routine by planting a kprobe. This code snippet will typically be within the init function of a kernel module. You'll find the code for this demo here: ch4/kprobes/1_kprobe:
// ch4/kprobes/1_kprobe/1_kprobe.c
#include "<...>/convenient.h"
#include <linux/kprobes.h>
[...]
static struct kprobe kpb;
[...]
/* Register the kprobe handler */
kpb.pre_handler = handler_pre;
kpb.post_handler = handler_post;
kpb.fault_handler = handler_fault;
kpb.symbol_name = "do_sys_open";
if (register_kprobe(&kpb)) { pr_alert("register_kprobe on do_sys_open() failed!
");return -EINVAL;
}
pr_info("registering kernel probe @ 'do_sys_open()'
");
An interesting use of kprobes is to figure out (approximately) how long a kernel/module function takes to execute. To figure this out… come on, you don't need me to tell you!:
- Take a timestamp in the pre-handler routine (call it tm_start). We can use the ktime_get_real_ns() routine to do so.
- As the first thing in the post-handler routine, take another timestamp (call it tm_end).
- (tm_end – tm_start) is the time taken (do peek at our convenient.h:SHOW_DELTA() macro to see how to correctly perform the calculation).
The pre- and post-handler routines follow. Let's begin with the pre-handler routine:
static int handler_pre(struct kprobe *p, struct pt_regs *regs)
{PRINT_CTX(); // uses pr_debug()
spin_lock(&lock);
tm_start = ktime_get_real_ns();
spin_unlock(&lock);
return 0;
}
Here's our post-handler:
static void handler_post(struct kprobe *p, struct pt_regs *regs, unsigned long flags)
{spin_lock(&lock);
tm_end = ktime_get_real_ns();
PRINT_CTX(); // uses pr_debug()
SHOW_DELTA(tm_end, tm_start);
spin_unlock(&lock);
}
It's pretty straightforward, right? We grab the timestamps and the SHOW_DELTA() macro calculates the difference. Where is it? In our convenience header file (named – surprise, surprise! – convenient.h). Similarly, the PRINT_CTX() macro defined there gives us a nice one-line summary of the state of the process/interrupt context in the kernel that executed the macro (details on interpreting this follows). The spinlock is used, of course, for concurrency control – as we're operating on shared writable data items.
As the comment next to the PRINT_CTX() macro says, it internally uses pr_debug() to emit output to the kernel log. Hence, it will only appear if either of the following apply:
- The symbol DEBUG is defined.
- More usefully, DEBUG is deliberately left undefined (as is typical in production) and you make use of the kernel's dynamic debug facility to turn on/off these prints (as discussed in detail in Chapter 3, Debug via Instrumentation – printk and Friends in the Using the kernel's powerful dynamic debug feature section).
A sample fault handler is defined too. We don't do anything much here, merely emit a printk specifying which fault occurred, leaving the actual fault handling – a complex task – to the core kernel (here, we simply copy the fault handler code from the kernel tree: samples/kprobes/kprobe_example.c):
static int handler_fault(struct kprobe *p, struct pt_regs *regs, int trapnr)
{ pr_info("fault_handler: p->addr = 0x%p, trap #%dn", p->addr, trapnr);
/* Return 0 because we don't handle the fault. */
return 0;
}
NOKPROBE_SYMBOL(handler_fault);
Notice a couple of things here:
- The third parameter to the fault handler callback, trapnr, is the numerical value of the trap that occurred; it's very arch-specific. For example, on x86, 14 implies it's a page fault (similarly, you can always look up the manual for other processor families to see their values and the meaning).
- The NOKPROBE_SYMBOL(foo) macro is used to specify that the function foo cannot be probed. Here, it's specified so that recursive or double faults are prevented.
Now that we've seen the code, let's give it a spin!
Trying it out
The test.sh and run bash scripts (within the same directory) are simple wrappers (run is a wrapper over the wrapper test.sh!) to ease testing these demo kernel modules. I'll leave it to you to check out how they work:
$ cd <lkd-src-tree>/ch4/kprobes/1_kprobe ; ls
1_kprobe.c Makefile run test.sh
$ cat run
KMOD=1_kprobe
echo "sudo dmesg -C && make && ./test.sh && sleep 5 && sudo rmmod ${KMOD} 2>/dev/null ; sudo dmesg"
sudo dmesg -C && make && ./test.sh && sleep 5 && sudo rmmod ${KMOD} 2>/dev/null ; sudo dmesg
$
The run wrapper script invokes the test.sh wrapper script (which performs insmod and sets up the dynamic debug control file to enable our debug printks). We allow the probe to remain active for 5 seconds – plenty of file open system calls, resulting in the invocation of do_sys_open() and our resulting pre- and post- handlers running, can happen in that time span.
Let's give our first demo a spin on our x86_64 Ubuntu VM running our custom production kernel:
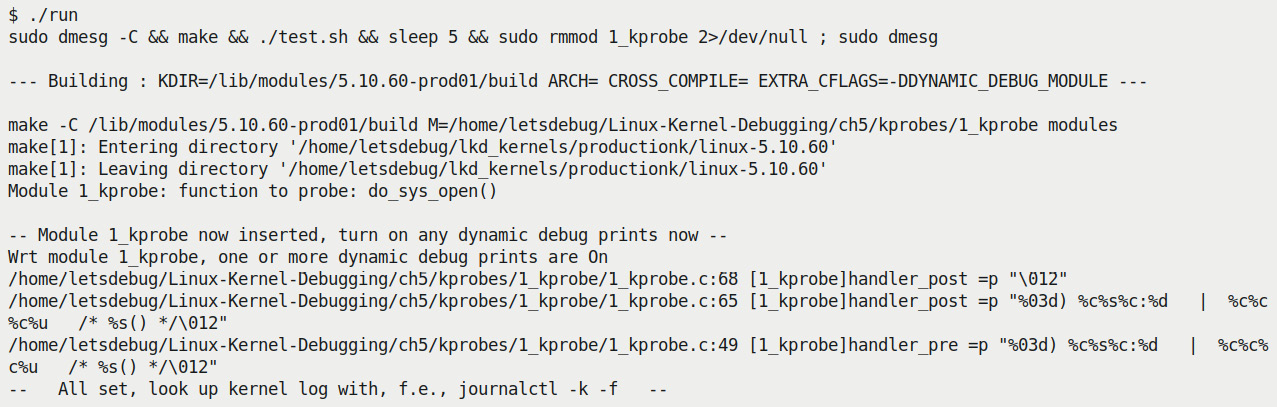
Figure 4.1 – Kprobes demo 1 – invoking the run script
You can see that the run script (invoking the test.sh script) sets things up... About 5 seconds later, here's a snippet of the output seen via sudo dmesg:
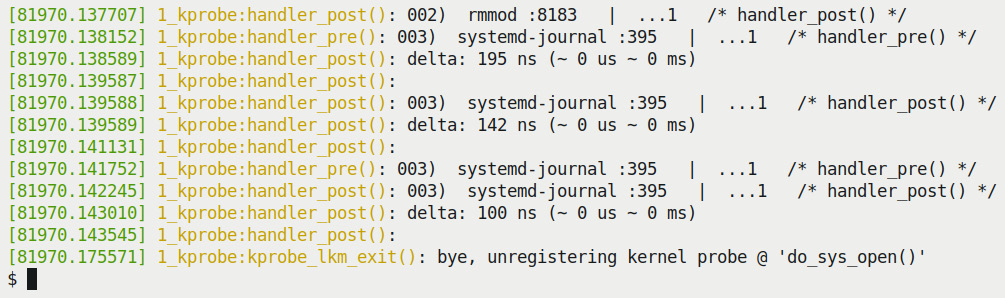
Figure 4.2 – Kprobes demo 1 – partial dmesg output
Great! Our static kprobe, being hit both before and after entering the do_sys_call() kernel function, executes the pre- and post-handlers in our module and produces the prints you see in the preceding screenshot. We need to interpret the PINT_CTX() macro's output.
Interpreting the PRINT_CTX() macro's output
In Figure 4.2, notice the useful output we obtain from our PRINT_CTX() macro (defined within our convenient.h header). I reproduce three of the relevant lines here, color-coding them to help you clearly understand them:

Figure 4.3 – Kprobes demo 1 – pre- and post-handler sample kernel printk output
Let's get into what these three lines of output are:
- First line: Output from the pre-handler routine's PRINT_CTX() macro.
- Second line: Output from the post-handler routine's PRINT_CTX() macro.
- Third line: The delta – the (approximate, usually pretty accurate) time it took for do_sys_open() to run – is seen in the post-handler as well. It's fast, isn't it?!
- Also notice: The dmesg timestamp (the time from boot in seconds.microseconds – don't completely trust its absolute value though!) and – due to our enabling the debug printks and the fact that it employs the pr_fmt() overriding macro – the module name:function_name() is also prefixed. For example, here, the latter two lines are prefixed with the following:
1_kprobe:handler_post():
Further, the following screenshot shows you how to fully interpret the output from our useful PRINT_CTX() macro:
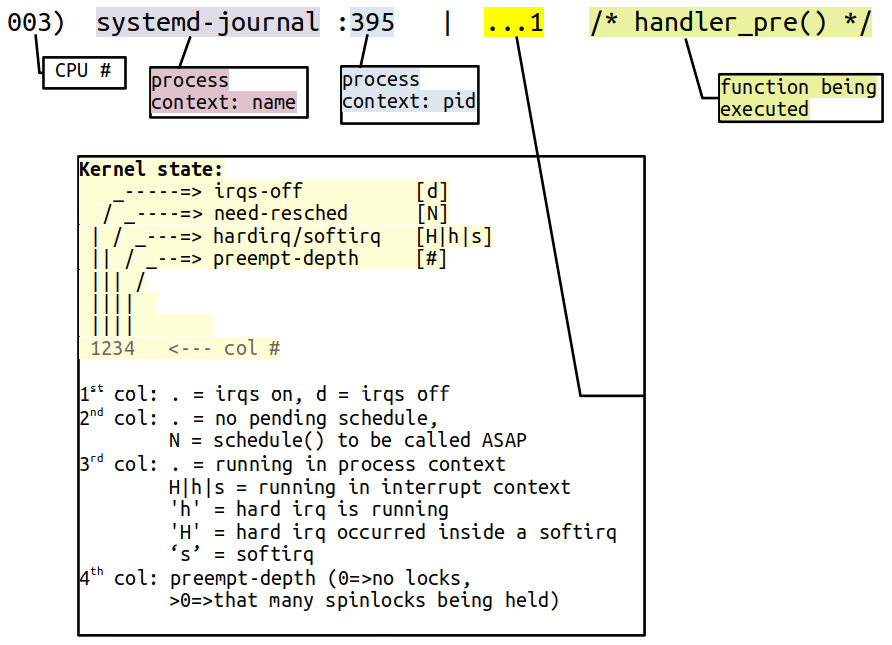
Figure 4.4 – Interpreting the PRINT_CTX() macro output
Do ensure you carefully study and understand this. It can be very useful in deep debug situations. (In fact, I've mostly mimicked this well-known format from the kernel's ftrace infrastructure's latency format display. It's explained in the ftrace documentation here as well: https://www.kernel.org/doc/Documentation/trace/ftrace.txt, under the heading Output format.)
Ftrace and the latency trace info fields
Worry not, we'll tackle ftrace in detail in Chapter 9, Tracing the Kernel Flow. Within it, the Delving deeper into the latency trace info section covers the interpretation of the so-called latency trace info fields in great detail. As a point of interest, ask yourself: what if the PRINT_CTX() macro runs in an interrupt context? What will be the values for the process context name and Process Identifier (PID) fields in that case? The short answer – it will be whichever process (or thread) happened to be caught in (preempted/interrupted by) the interrupt!
Importantly, actually try this out yourself – and the following demo modules! It will go a long way in helping you experiment and learn how to use kprobes effectively.
The kprobes Blacklist – You Can't Trap This!
A few kernel functions cannot be trapped into via the kprobes interfaces (mainly because they're used internally within the kprobe implementation). You can quickly check which these are – they're available in the blacklist pseudofile here: <debugfs-mount>/kprobes/blacklist (the debug filesystem (debugfs) is typically mounted under /sys/kernel/debug, of course). The kernel documentation discusses this and other kprobe limitations here: https://www.kernel.org/doc/html/latest/trace/kprobes.html#kprobes-features-and-limitations. Do check it out.
You can even do cool (read dangerous) things such as modify parameters in the pre-handler! Careful though – it can result in freezes or even outright kernel panic if done incorrectly. This could be a useful thing for testing – a way to, for example, inject deliberate faults... While on this, FYI, the kernel has a sophisticated fault injection framework; more on this in a later chapter.
Demo 2 – static kprobe – specifying the function to probe via a module parameter
Our second kprobes demo is quite similar to the first, but it differs as follows.
One, we now add and make use of two module parameters – a string one for the name of the function to probe, and an integer determining verbosity:
// ch4/kprobes/2_kprobe/2_kprobe.c
#define MAX_FUNCNAME_LEN 64
static char kprobe_func[MAX_FUNCNAME_LEN];
module_param_string(kprobe_func, kprobe_func, sizeof(kprobe_func), 0);
MODULE_PARM_DESC(kprobe_func, "function name to attach a kprobe to");
static int verbose;
module_param(verbose, int, 0644);
MODULE_PARM_DESC(verbose, "Set to 1 to get verbose printks (defaults to 0).");
The kprobe_func module parameter is useful! It allows us to pass any (valid) function as the probe target, avoiding hardcoding it. Of course, we now set the symbol_name member of the kprobe structure to the parameter:
kpb.symbol_name = kprobe_func;
In addition, the module's init code checks that the kprobe_func string is non-null.
The verbose parameter, if set, has the post-handler routine invoke the PRINT_CTX() macro. In this demo, we have our test.sh wrapper set the module parameters as follows:
// ch4/kprobes/2_kprobe/test.sh
FUNC_TO_KPROBE=do_sys_open
VERBOSE=1
[...]
sudo insmod ./${KMOD}.ko kprobe_func=${FUNC_TO_KPROBE} verbose=${VERBOSE} || exit 1One issue you'll quickly notice with kprobes instrumentation (indeed, it's quite common to many kinds of instrumentation and tracing) is the sheer volume of printks that can get generated! With a view to limiting it (thus trying to mitigate the overflow of the kernel ring buffer), we introduce a macro named SKIP_IF_NOT_VI. If defined, we only log information in the pre- and post-handlers when the process context is the vi process (of course, it's just a demo; feel free to change it to whatever's suitable or undefine it):
#ifdef SKIP_IF_NOT_VI
/* For the purpose of this demo, we only log information when the process context is 'vi' */
if (strncmp(current->comm, "vi", 2))
return 0;
#endif
That's pretty much it. I leave it to you to try it out. (Don't forget to run vi so that some output's captured!).
Exercise
As a small exercise:
a) Try passing other functions to probe via the module parameter kprobe_func.
b) Convert the hardcoded SKIP_IF_NOT_VI macro into a module parameter.
Well, great, you now know how to write (simple) kernel modules that leverage the kernel's kprobes framework. To be able to go deeper within a typical debugging context, it is necessary to understand more in-depth things... Things such as how the processor's General Purpose Registers (GPRs) are typically used, how the processor interprets a stack frame and passes function parameters, and so on... This is the domain of the Application Binary Interface, the ABI! The following section helps you gain an introduction to it, information that can prove extremely valuable during a deep debug session. Read on!
Understanding the basics of the Application Binary Interface (ABI)
In order to gain access to the parameters of a function, you have to first understand at least the basics of how the compiler arranges for the parameters to be passed. At the level of the assembly (assuming the programming language is C), you'll realize that it's really the compiler that generates the required assembly that actually implements the function call, parameter passing, local variable instantiation, and return!
But how does the compiler manage to do this? Compiler authors need to understand how the machine works... Obviously, all of this is very arch-specific; the precise specification as to how exactly function calling conventions, return value placement, stack and register usage, and so on, is provided by the microprocessor documentation called the ABI document.
Briefly, the ABI conveys the underlying details at the level of the machine concerning the following:
- CPU register usage
- Function procedure calling and return conventions
- Precise stack frame layout in memory
- The details regarding data representation, linkage, object file formats, and so on
For example, x86-32 processors always use the stack to store the parameters to a function before issuing the CALL machine instruction. On the other hand, ARM-32 processors use both CPU GPRs as well as the stack (details follow).
Here, we shall only focus on one primary aspect of the ABI – the function calling conventions (and related register usage) on a few key architectures:
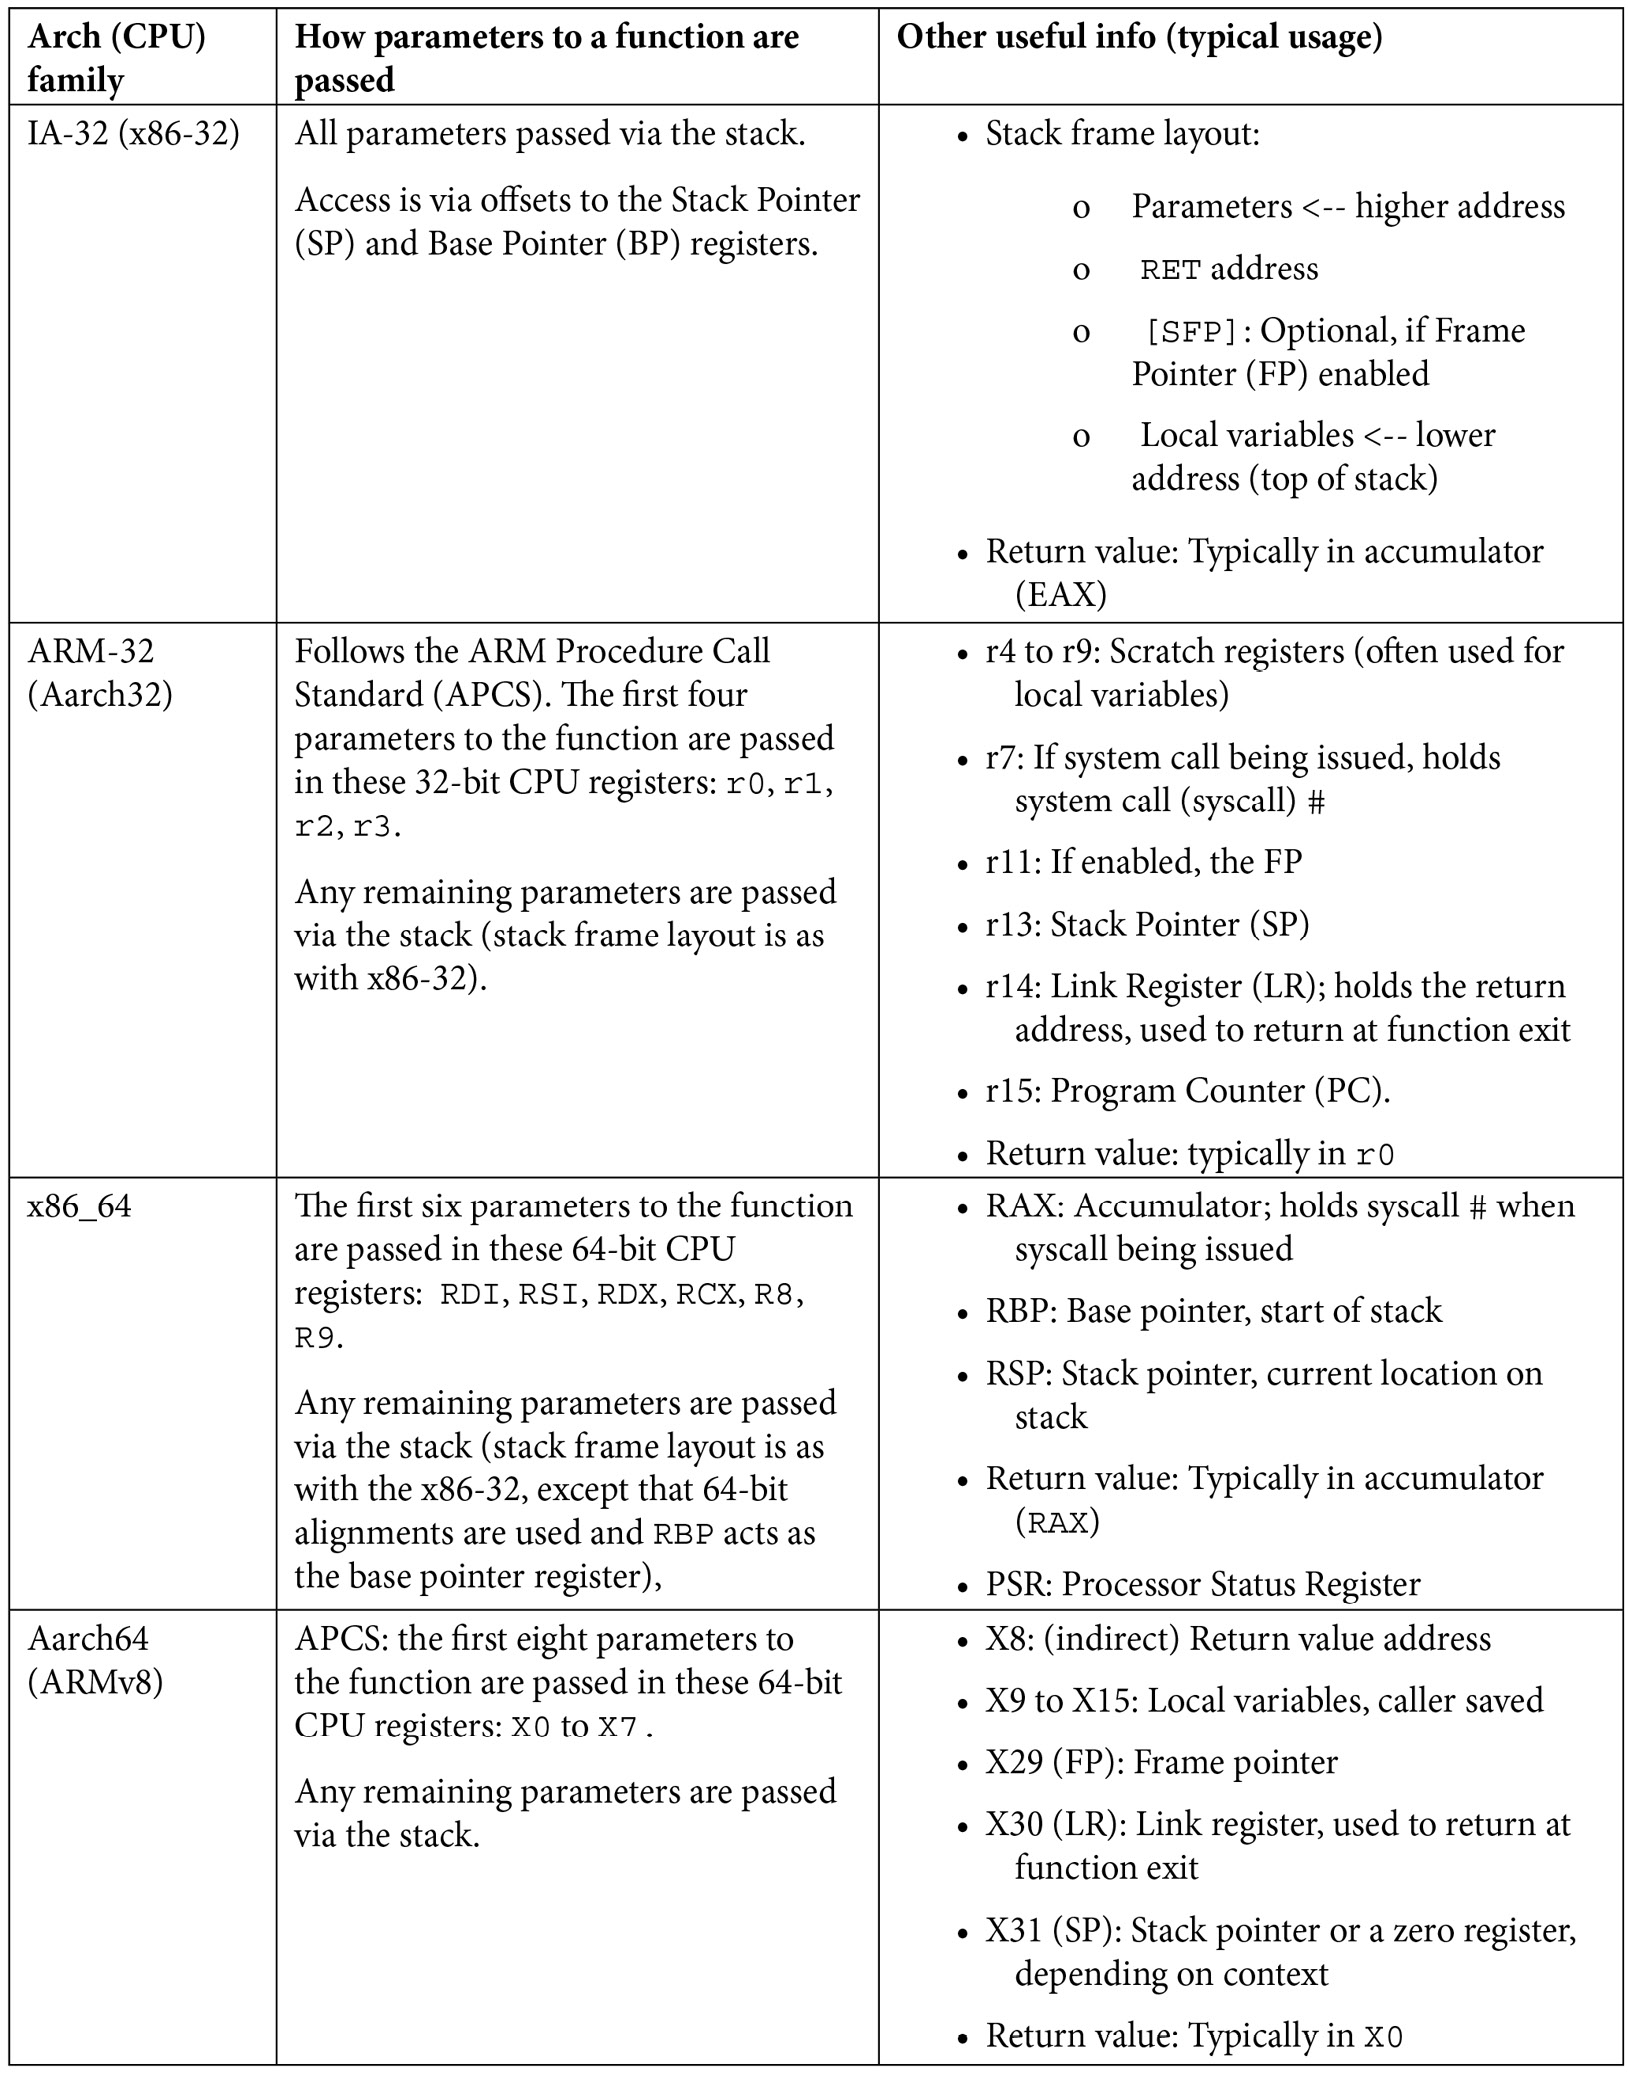
Table 4.1 – Summary of function call and register usage ABI information for a few processor families
A couple of additional points:
- Pretty much all modern processors have a downward-growing stack – the stack grows from higher virtual addresses to lower virtual addresses. If interested (and I recommend you to be!), do look up more details in the blog article mentioned just after these points. Things are not always simple: in the presence of compiler optimization, the details seen in Table 4.1 might not hold (for example, on the x86-32, gcc and Windows FASTCALL piggyback the first two function parameters into registers ECX and EDX). So, do check and recheck – Your Mileage May Vary (YMMV)...
- The ABI details mentioned here apply to how the C compiler (gcc/clang) typically works, thus for the C language, using integer or pointer parameters (not floating-point arguments or returns). Also, we won't go into more detail here (callee/caller-saved registers, the so-called red zone optimization, exception cases, and so on). Refer to the Further reading section for further links.
Links to the ABI documentation for various processor families and its basic details can be found in this (my) blog article: APPLICATION BINARY INTERFACE (ABI) DOCS AND THEIR MEANING: https://kaiwantech.wordpress.com/2018/05/07/application-binary-interface-abi-docs-and-their-meaning/.
Now that we have at least basic knowledge of the processor ABI and how the compiler (gcc/clang) uses it on Linux, let's put our newfound know-how to use. In the following section, we'll learn how to do something pretty useful – determine the pathname of the file being opened via our kprobe-based open system call trap. More generally, we'll learn in effect how to retrieve the parameters of the trapped (probed) function!
Using static kprobes – demo 3 and demo 4
Continuing to work via the traditional static kprobes approach (recall: the word static implies any change will require a code recompile), let's learn to do more with kprobes – useful and practical stuff that really helps when debugging. Retrieving the parameters of the probed function certainly qualifies as being a very useful skill!
The two demo programs that follow (demos 3 and 4), will show you how to do precisely this, with demo 4 using an interesting approach – we'll generate our kprobe C code (and Makefile file) via a bash script. Let's work on and understand these demos!
Demo 3 – static kprobe – probing the file open syscall and retrieving the filename parameter
You'll agree, I think, that the second demo is better than the first – it allows the passing of any function to be probed (as a module parameter). Now, continuing with our example of probing do_sys_open(), you've seen (from the first two demos) that we can indeed probe it. In a typical debugging/troubleshooting scenario, though, this isn't nearly enough: being able to retrieve the parameters of the probed function can be really important, and can prove to be the difference between figuring out the root cause of the issue or not.
Tip
The underlying cause of many bugs is the incorrect passing of parameters (often an invalid or corrupted pointer). Take care – check and recheck your assumptions!
In line with our demos, this is the signature of the to-be-probed routine, do_sys_open():
long do_sys_open(int dfd, const char __user *filename, int flags, umode_t mode);
Gaining access to its parameters within the pre-handler can be tremendously helpful! The previous section on the basics of the ABI focused on how precisely to do this. We'll end up demonstrating that we can gain access to and print the pathname to the file being opened – the second parameter, filename.
Jumper probes (jprobes)
There's a set of kernel interfaces that enable direct access to any probed function's parameters – it's called a jumper probe (jprobe). However, the jprobe interfaces were deprecated in the 4.15 kernel, the rationale being that you could gain access to a probed (or traced) function's parameters in other, simpler ways – essentially by leveraging the kernel's tracing infrastructure.
We do cover the basics of using the kernel tracing infrastructure to do various useful things at different points in this book. Here, look out for capturing parameters the manual way in the material that follows, and a much simpler automated way in the section on kernel event tracing within this chapter: The easier way – dynamic kprobes or kprobe-based event tracing. It's worth mentioning that, if your project or product uses a kernel version below 4.15, leveraging the jprobes interfaces can be a useful thing indeed!. Here's the kernel doc on this: https://www.kernel.org/doc/html/latest/trace/kprobes.html?highlight=kretprobes#deprecated-features.
So, let's leverage our knowledge of the processor ABI, and now, in this, our third kprobes demo, gain access to the probed function's second parameter, the file being opened. Interesting stuff, right? Read on!
Retrieving the filename
Here's a few snippets from the code of our third demo (obviously, I won't show everything here due to space constraints – please install and look it up from the book's GitHub repo). Let's pick up the action at a key portion of the code, the kernel module's pre-handler code path:
// ch4/kprobes/3_kprobe/3_kprobe.c
static int handler_pre(struct kprobe *p, struct pt_regs *regs)
{char *param_fname_reg;
Notice the parameters to the pre-handler:
- First, a pointer to the kprobe structure
- Second, a pointer to a structure named pt_regs
Now, this struct pt_regs structure is of interest to us: it encapsulates – obviously in an arch-specific manner – the CPU registers. Its definition is thus within an arch-specific header file. Let's consider, as an example, that you're going to run this kernel module on an ARM-32 (AArch32) based system (for example, on a Raspberry Pi 0W or the BeagleBone Black). The pt_regs structure for ARM-32 is defined here: arch/arm/include/asm/ptrace.h (and/or in arch/arm/include/uapi/asm/ptrace.h). For ARM (AArch32), the processor's CPU registers are held in the array member named uregs. The ptrace.h header has a macro:
#define ARM_r1 uregs[1]
From the ABI for ARM-32 (refer to Table 4.1), we know that the first four parameters (arguments) to a function are passed in CPU GPRs r0 to r3. The second parameter is thus piggy-backed into the register r1; hence, our code to gain access to it is this:
#ifdef CONFIG_ARM
/* ARM-32 ABI:
* First four parameters to a function are in the foll GPRs: r0, r1, r2, r3
* See the kernel's pt_regs structure - rendition of the CPU registers here:
https://elixir.bootlin.com/linux/v5.10.60/source/arch/arm/include/asm/ptrace.h#L135
*/
param_fname_reg = (char __user *)regs->ARM_r1;
#endif
In a completely analogous fashion, for the x86 and AArch64, we use conditional compilation based on the CPU architecture to retrieve the value for the second parameter into our local variable param_fname_reg as follows:
#ifdef CONFIG_X86
param_fname_reg = (char __user *)regs->si;
#endif
[...]
#ifdef CONFIG_ARM64
/* AArch64 ABI:
* First eight parameters to a function (and return val) are in the foll GPRs: x0 to x7 (64-bit GPRs)
* See the kernel's pt_regs structure - rendition of the CPU registers here:
https://elixir.bootlin.com/linux/v5.10.60/source/arch/arm64/include/asm/ptrace.h#L173
*/
param_fname_reg = (char __user *)regs->regs[1];
#endif
Clearly (as Table 4.1 reveals), on the x86_64, the second parameter is held in the [R]SI register, and in the register X1 on the ARM64 (AArch64); our code retrieves it per the ABI!
Now it's simply a matter of emitting a printk to reveal the name of the file being opened. But hang on... the intricacies of programming in the kernel imply that you cannot simply retrieve the memory at the pointer referred to by our local variable param_fname_reg. Why not? Careful, it's a pointer to userspace memory (and we're running in kernel space), hence, we employ the strncpy_from_user() kernel API to bring it (copy it) into kernel memory space in our already-allocated kernel buffer fname (which we allocate in the module's init code path via kzalloc()):
if (!strncpy_from_user(fname, param_fname_reg, PATH_MAX))
return -EFAULT;
pr_info("FILE being opened: reg:0x%px   fname:%s
",
(void *)param_fname_reg, fname);
As an interesting aside, only when we test this kernel module on our debug kernel does the strncpy_from_user() function throw a warning printk:
BUG: sleeping function called from invalid context at lib/strncpy_from_user.c:117
The line of code at this point (lib/strncpy_from_user.c:117 in the 5.10.60 kernel, as seen) is the might_fault() function. A bit simplistically, this function checks if the kernel config CONFIG_PROVE_LOCKING or CONFIG_DEBUG_ATOMIC_SLEEP is enabled, it calls the might_sleep() routine; the comments for this routine (include/linux/kernel.h) clearly tell the story – it's a debug aid, checking that a sleep does not occur in any kind of atomic context:
/**
* might_sleep - annotation for functions that can sleep
* this macro will print a stack trace if it is executed in an atomic
* context (spinlock, irq-handler, ...). Additional sections where blocking is
* not allowed can be annotated with non_block_start() and non_block_end()
* pairs.
* This is a useful debugging help to be able to catch problems early and not be bitten later when the calling function happens to sleep when it is not supposed to.
*/
I've highlighted the key part of the comment. We find that both CONFIG_PROVE_LOCKING and CONFIG_DEBUG_ATOMIC_SLEEP are enabled in our debug kernel; that's why this warning is emitted. Well, here and now, we can't do much about it; we simply leave it at that – a warning to be acknowledged, a "To Do" on our list.
There, it's done; the remainder of the module code is mostly identical to that of our 2_kprobe module, so we'll skip showing it here. Let's perform a sample run by executing our wrapper run script. As before (in the 2_kprobe demo), to cut down on the volume, we only emit printks when the process context is vi. The final sudo dmesg from our wrapper script reveals the kernel log buffer content. The screenshot here (Figure 6.5) shows the trailing portion of the output:
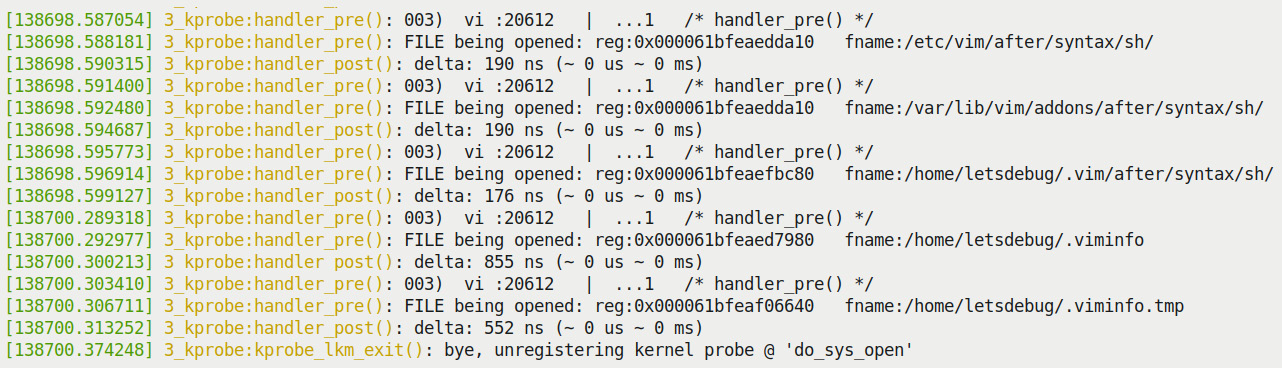
Figure 4.5 – Trailing portion of the dmesg kernel log buffer output from the 3_kprobe demo on an x86_64 VM (filtered to show only vi process context)
Look at the preceding screenshot. The pathname of the file being opened – the second parameter to the probed function do_sys_open() – is clearly displayed!
Trying it out on a Raspberry Pi 4 (AArch64)
For a bit of variety and fun, I also ran this kernel module on a Raspberry Pi 4 running a 64-bit Ubuntu system (thus fully configured to exploit its AArch64 – arm64 – architecture). We build the module and then insmod it:
rpi4 # sudo dmesg –C; insmod ./3_kprobe.ko kprobe_func=do_sys_open ; sleep 1 ; dmesg|tail -n5
[ 3893.514219] 3_kprobe:kprobe_lkm_init(): FYI, skip_if_not_vi is on, verbose=0
[ 3893.525200] 3_kprobe:kprobe_lkm_init(): registering kernel probe @ 'do_sys_open'
The printks clearly show that the (new) module parameter skip_if_not_vi is on by default, implying that only the vi process context – when it opens files – will be captured by our module. Okay, let's do an experiment: let's change it by modifying the parameter on the fly, a useful thing. First, though, don't forget to dynamically turn on all our debug prints:
rpi4 # echo -n "module 3_kprobe +p" > /sys/kernel/debug/dynamic_debug/control
rpi4 # grep 3_kprobe /sys/kernel/debug/dynamic_debug/control
<...>/3_kprobe.c:98 [3_kprobe]handler_pre =p "%03d) %c%s%c:%d | %c%c%c%u /* %s() */�12"
<...>/3_kprobe.c:158 [3_kprobe]handler_post =p "%03d) %c%s%c:%d | %c%c%c%u /* %s() */�12"
rpi4 #
Now we query and then modify the module parameter skip_if_not_vi to the value 0:
rpi4 # cat /sys/module/3_kprobe/parameters/skip_if_not_vi
1
rpi4 # echo –n 0 > /sys/module/3_kprobe/parameters/skip_if_not_vi
Now, all file open system calls are trapped via our module. The following screenshot reveals this (you can clearly see both the dmesg and the systemd-journal processes opening various files):

Figure 4.6 – Partial screenshot showing our 3_kprobe running on a Raspberry Pi 4 (AArch64), displaying all files being opened
Good, it runs flawlessly here as well – thanks to our taking the AArch64 architecture into account in our module code (recall the #ifdef CONFIG_ARM64 ... lines within the 3_kprobe.c module code)!
Voilà! We have the names of all files being opened. Make sure you try this out yourself (at least on your x86_64 Linux VM).
Demo 4 – semi-automated static kprobe via our helper script
This time, we'll make it more interesting! A shell (bash) script (kp_load.sh) takes parameters – including the name of the function we'd like to probe and, optionally, the kernel module that contains it (if the to-be-probed function lives within a kernel module). It then generates a template for both the kernel module C code and the Makefile, enabling attaching a kprobe to a given function via a module parameter.
Due to a scarcity of space, I won't attempt to show the code of the script and the kernel module (helper_kp.c) here; just its usage. Of course, I'd expect you to browse through the code (ch4/kprobes/4_kprobe_helper) and try it out.
The helper script will first perform a few sanity checks – it first verifies that kprobes is indeed supported on the current kernel. Running it (as root) without parameters has it display its usage or help screen:
$ cd ch4/kprobes/4_kprobe_helper
$ sudo ./kp_load.sh
[sudo] password for letsdebug: xxxxxxxxxxxx
[+] Performing basic sanity checks for kprobes support... OK
kp_load.sh: minimally, a function to be kprobe'd has to be specified (via the --probe=func option)
Usage: kp_load.sh [--verbose] [--help] [--mod=module-pathname] --probe=function-to-probe
--probe=probe-this-function : if module-pathname
is not passed, then we assume the function to be
kprobed is in the kernel itself.
[--mod=module-pathname] : pathname of kernel
module that has the function-to-probe
[--verbose] : run in verbose mode;
shows PRINT_CTX() o/p, etc
[--showstack] : display kernel-mode
stack, see how we got here!
[--help] : show this help
screen
$
Let's do something interesting – probe the system's network adapter's hardware interrupt handler. The steps that follow perform this, using our kp_load.sh helper script to actually get things done (Platform: Ubuntu 20.04 LTS running our custom production kernel (5.10.60-prod01) on an x86_64 guest VM):
- Identify the network driver on the device (on my system, its the enp0s8 interface). The ethtool utility can interrogate a lot of low-level details on the network adapter. Here, we use it to query the driver that's driving the Network Interface Card (NIC) or adapter for the enp0s8 interface:
# ethtool -i enp0s8 |grep -w driver
driver: e1000
The -i parameter to ethtool specifies the network interface. Further, lsmod verifies the e1000 device driver is indeed present in kernel memory (as it's been configured as a module):
# lsmod |grep -w e1000
e1000 135168 0
- Find the e1000 driver's code location within the kernel and identify the hardware interrupt handler function. Most (if not all) Ethernet Original Equipment Manufacturers' (OEMs') NIC device driver code is within the drivers/net/ethernet folder. The e1000 network driver resides here as well: drivers/net/ethernet/intel/e1000/.
Okay, here's the code that sets up the network adapter's hardware interrupt:
// drivers/net/ethernet/intel/e1000/e1000_main.c
static int e1000_request_irq(struct e1000_adapter *adapter)
{
struct net_device *netdev = adapter->netdev;
irq_handler_t handler = e1000_intr;
[…]
err = request_irq(adapter->pdev->irq, handler,
irq_flags, netdev->name, netdev);
[…]
(FYI, here's the convenient link to the code online: https://elixir.bootlin.com/linux/v5.10.60/source/drivers/net/ethernet/intel/e1000/e1000_main.c#L253. Bootlin's online kernel code browser tooling can be a life saver!)
We can see that the hardware interrupt (hardirq) handler routine is named e1000_intr(); this is its signature:
static irqreturn_t e1000_intr(int irq, void *data);
Its code is here: https://elixir.bootlin.com/linux/v5.10.60/source/drivers/net/ethernet/intel/e1000/e1000_main.c#L3745). Cool!
- Let's probe it via our helper script:
# ./kp_load.sh --mod=/lib/modules/5.10.60-prod01/kernel/drivers/net/ethernet/intel/e1000/e1000.ko --probe=e1000_intr --verbose --showstack
Do carefully check and note the parameters we've passed to our kp_load.sh helper script. It runs... In the following screenshot, you can see how our helper script performs its sanity checks, validates the function to probe (and even shows its kernel virtual address via its /proc/kallsyms entry). It then creates a temporary folder (tmp/), copies in the C LKM template file (helper_kp.c), renaming it appropriately within there, generates the Makefile file (using a shell scripting technique called a HERE document), switches to the tmp/ folder, builds the kernel module, and then loads it into kernel memory (via insmod). Whew!:

Figure 4.7 – Screenshot showing the kp_load.sh helper script executing and loading up the custom kprobe LKM
- I save the kernel log to a file (journalctl –k > myklog), remove the LKM from kernel memory, and open the log file in the vi editor; the output is pretty large. Here's a partial screenshot (Figure 4.8), capturing our custom kprobe's pre-handler routine's printk, the output from our PRINT_CTX() macro, and mostly, the output from the dump_stack() routine! The last two lines of output are from the kprobe's post handler routine:
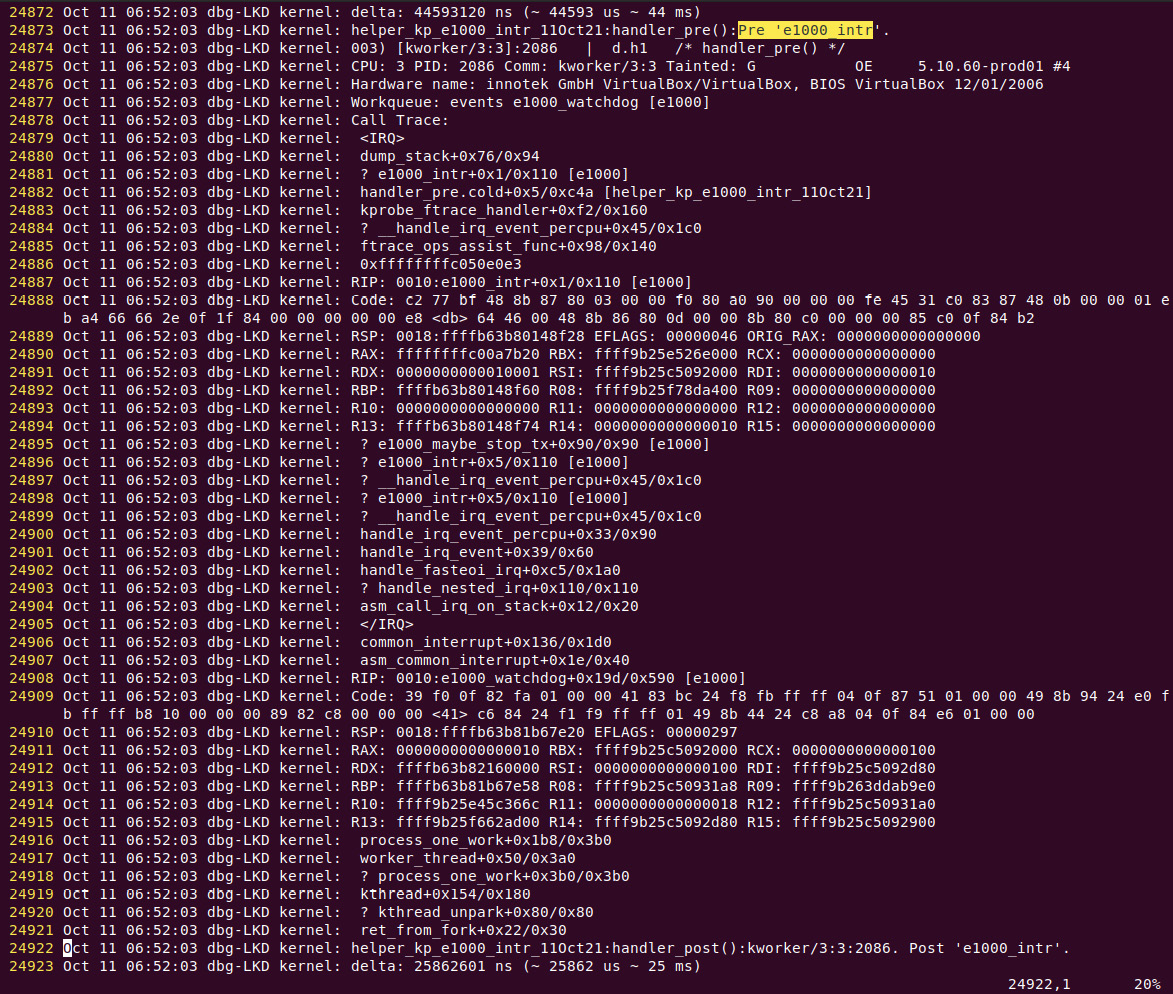
Figure 4.8 – (Partial) screenshot showing output from the kernel log as emitted by our helper script's custom kprobe within the pre-handler routine; the last two lines are from the post handler
Interesting! Our custom autogenerated kprobe has achieved this!
Don't fret regarding how exactly to interpret the kernel-mode stack right now; we shall cover all this in detail in the coming chapters. For now, I'll point out the following key things with regard to Figure 4.8 (ignoring the line number and the first five columns on the left):
- Line 24873: Output from our custom generated kprobe: as the verbose flag is set, a debug printk shows the call site – helper_kp_e1000_intr_11Oct21:handler_pre():Pre 'e1000_intr'.
- Line 24874: Output from our PRINT_CTX() macro – 003) [kworker/3:3]:2086 | d.h1 /* handler_pre() */. The four-character d.h1 sequence is interpreted per Figure 4.4: hardware interrupts are disabled (off), we're currently running in the hardirq context (of course we are, the probe is on the NIC's interrupt handler) and a (spin)lock is currently held.
- Lines 24875 to 24921: Output from the dump_stack() routine; useful information indeed! For now, just read it bottom-up, ignoring all lines that begin with a ?. Well, one key point: in this particular case, do you notice that there are actually two kernel-mode stacks on display here?
- The upper portion is within the <IRQ> and </IRQ> tokens. This tells us it's the IRQ stack – a special stack region used to hold stack frames when a hardware interrupt is being processed (this is an arch-specific feature known as interrupt (or IRQ) stacks; most modern processors use it).
- The lower portion of the stack, after the </IRQ>, is the regular kernel-mode stack. It's typically the (kernel) stack of the process context that happened to get rudely interrupted by the hardware interrupt (here, it happens to be a kernel thread named kworker/3:3).
Interpreting kthread names
By the way, how do you interpret kernel thread names (such as the kworker/3:3 kthread seen here)? They're essentially cast in this format: kworker/%u:%d[%s] (kworker/cpu:id[priority]).
Refer to this link for more details: https://www.kernel.org/doc/Documentation/kernel-per-CPU-kthreads.txt.
Nice, using the helper script does make things easier. There's a price to pay, of course – there's always a trade-off (as with life): our helper_kp.c LKM's C code template remains hardcoded for any and every probe we set up using it.
Now you know how to code static kprobes; more so, how you can leverage this technology to help you carefully instrument – and thus debug – kernel/module code, even on production systems! The other side of the coin is the kretprobe. Let's jump into learning how to use it.
Getting started with kretprobes
At the outset of this chapter, you learned how to use the basic kprobes APIs to set up a static kprobe (or two). Let's now cover an interesting counterpart to the kprobe – the kretprobe, allowing us to gain access to any (well, most) kernel or module function's return value! This – being able to dynamically look up a given function's return value – can be a gamechanger in a debug scenario.
Pro Dev Tip
Don't assume: If a function returns a value, always check for the failure case. One day it could fail – yes, even the malloc() or the kmalloc() APIs! Fail to catch the possible failure and you'll be flailing to figure out what happened!
The relevant kretprobe APIs are straightforward:
#include <linux/kprobes.h>
int register_kretprobe(struct kretprobe *rp);
void unregister_kretprobe(struct kretprobe *rp);
The register_kretprobe() function returns 0 on success and, in the usual kernel style (the 0/-E convention), a negative errno value on failure.
Tip – errno Values and Their Meaning
As you'll know, errno is an integer found in every process's uninitialized data segment (more recently, it's constructed to be thread-safe by employing the powerful Thread Local Storage (TLS) Pthreads feature, implemented via the compiler and the usage of the __thread keyword in the variable declaration). When a system call fails (typically returning –1), the programmer can query the error diagnostic by looking up errno. The kernel (or underlying driver) will return the appropriate negative errno integer. glibc glue code will set it to positive by multiplying it by –1. It serves as an index into a 2D array of English error messages, which can be conveniently looked up via the [p]error(3) or strerror(3) glibc APIs.
I often find it useful to be able to quickly look up a given errno value. Use the userspace headers /usr/include/asm-generic/errno-base.h (covers errno values 1 to 34) and /usr/include/asm-generic/errno.h (covers errno values 35 to 133), as of this writing.
For example, if you notice that a kernel/module function's return value is –101 in a log file, the corresponding positive errno value can be looked up; here, it's: #define ENETUNREACH 101 /* Network is unreachable */
The kretprobe structure internally contains the kprobe structure, allowing you to set up the probe point (the function to return the probe) via it. In effect, the probe point will be rp->kp.addr (where rp is the pointer to the kretprobe structure, kp the pointer to the kprobe structure, with the address being typically figured out via rp->kp.symbol_name – set to the name of the function to be probed). The rp->handler is the kretprobe handler function; its signature is this:
int kretprobe_handler(struct kretprobe_instance *ri, struct pt_regs *regs);
Just as with kprobes, you will receive all CPU registers within the handler function via the second parameter, the pt_regs structure. The first parameter, the kretprobe_instance structure, holds (among other housekeeping fields), the following:
- ri->ret_addr: The return address
- ri->task: The pointer to the process context's task structure (which encapsulates all attributes of the executing task)
- ri->data: A means to gain access to a per-instance private data item
But what about the main feature, the return value from the probed function? Ah, recall our discussion on the processor ABI (in the Understanding the basics of the Application Binary Interface (ABI) section): the return value is again placed into a processor register, the particular register being of course very arch-specific. Table 4.1 shows you the relevant details. But hang on, you don't have to manually look it up. There's an elegant, simpler way – a macro:
regs_return_value(regs);
This macro is a hardware-agnostic abstraction, separately defined for each processor family, that provides the return value from the appropriate register (the registers being passed via struct pt_regs *regs of course)! For example, here's the essential implementation of regs_return_value() on the following architectures (CPUs):
- ARM (AArch32) is: return regs->ARM_r0;
- A64 (AArch64) is: regs->regs[0]
- x86 is: return regs->ax;
It just works.
The kernel community has provided sample source code for some select kernel features; this includes the kprobe and kretprobe. Here are some relevant snippets from the sample code for the kretprobe (found here within the kernel code base: samples/kprobes/kretprobe_example.c) via the following bullet points:
- A module parameter func enables us to pass any function to probe (ultimately, for obtaining its return value, the whole point here):
static char func_name[NAME_MAX] = "kernel_clone";
module_param_string(func, func_name, NAME_MAX, S_IRUGO);
MODULE_PARM_DESC(func, "Function to kretprobe; this module will report the function's execution time");
- The kretprobe structure definition:
static struct kretprobe my_kretprobe = {
.handler = ret_handler,
.entry_handler = entry_handler,
.data_size = sizeof(struct my_data),
/* Probe up to 20 instances concurrently. */
.maxactive = 20,
};
Let's now delve into this kretprobe structure:
- handler: The member that specifies the function to run when the function we're probing completes, enabling us to fetch the return value; it's the return handler.
- entry_handler: The member that specifies the function to run when the function we're probing is entered; it gives you a chance to determine whether the return will be collected:
- If you return 0 (implying success), the return function – handler – will be called upon the return of the probed function.
- If you return non-zero, the k[ret]probe does not even happen; in effect, it gets disabled for this particular function instance (the official kernel doc here gives you the in-depth details on the entry handler and private data fields: https://www.kernel.org/doc/html/latest/trace/kprobes.html?highlight=kretprobes#kretprobe-entry-handler).
- maxactive: Used to specify how many instances of the probed function can be simultaneously probed; the default is the number of CPU cores on the box (NR_CPUS). If the nmissed field of the kretprobe structure is positive, it implies you missed that many instances (you can then increase maxactive). Again, the kernel doc here gives you the in-depth details: https://www.kernel.org/doc/html/latest/trace/kprobes.html?highlight=kretprobes#how-does-a-return-probe-work.
- In the module initialization code path, plant the return probe:
my_kretprobe.kp.symbol_name = func_name;
ret = register_kretprobe(&my_kretprobe);
- Here's the actual return handler code (skipping details):
static int ret_handler(struct kretprobe_instance *ri, struct pt_regs *regs)
{
unsigned long retval = regs_return_value(regs);
struct my_data *data = (struct my_data *)ri->data;
[...]
delta = ktime_to_ns(ktime_sub(now, data->entry_stamp));
pr_info("%s returned %lu and took %lld ns to execute ", func_name, retval, (long long)delta);
return 0;
}
I've highlighted (in bold) the key lines – where the return address is obtained and printed.
- In the module cleanup code path, the kretprobe is unregistered (and the missed instances count is displayed):
unregister_kretprobe(&my_kretprobe);
pr_info("kretprobe at %p unregistered ", my_kretprobe.kp.addr);
/* nmissed > 0 suggests that maxactive was set too low. */
pr_info("Missed probing %d instances of %s ", my_kretprobe.nmissed, my_kretprobe.kp.symbol_name);
Do try it out...
Kprobes miscellany
A couple of remaining things to mention while on this topic of k[ret]probes:
- One, you can even set up multiple kprobes or kretprobes with a single API call, as follows:
#include <linux/kprobes.h>
int register_kprobes(struct kprobe **kps, int num);
int register_kretprobes(struct kretprobe **rps, int num);
As you might expect, these are convenience wrappers calling the underlying registration routine in a loop. The unregister_k[ret]probes() routine counterparts are used to unregister the probes. We won't delve further into those here.
- Two, a kprobe or kretprobe can be temporarily disabled via the following:
int disable_kprobe(struct kprobe *kp);
int disable_kretprobe(struct kretprobe *rp);
And later re-enabled via the corresponding and analogous enable_k[ret]probe() APIs. This can be useful: a way to throttle the amount of debug telemetry being logged.
Inner Workings
If you'd like to delve into the inner workings of how kprobes and kretprobes are internally implemented, the official kernel documentation covers it here: https://www.kernel.org/doc/Documentation/kprobes.txt. Check out the Concepts: Kprobes and Return Probes section.
Now that you know how to use both kprobes and kretprobes, it's also important to understand that they have some inherent limitations, even downsides. The following section covers just this.
Kprobes – limitations and downsides
We do realize that no single feature can do anything and everything – in the words of Frederick J Brooks (in his incomparable book The Mythical Man Month): "there is no silver bullet".
As we've seen, certain kernel/module functions cannot be probed, including the following:
- Functions marked with the __kprobes or nokprobe_inline annotation.
- Functions marked via the NOKPROBE_SYMBOL() macro.
- The pseudofile /sys/kernel/debug/kprobes/blacklist holds the names of functions that can't be probed. (Incidentally, our ch4/kprobes/4_kprobe_helper/kp_load.sh script checks this against the function attempting to be probed). Also, some inline functions might not be able to be probed.
There's more to note on the point of using k[ret]probes on production systems due to the possibility of stability issues; the next section throws some light on this.
Interface stability
We know that kernel APIs can change at any point (this is a given with kernel development and maintenance in any case). So, you can imagine a situation where your kernel module sets up kprobes for some functions, say, x() and y(). In a later kernel release though, there's no telling what will happen – these functions might be deprecated, or their signatures (and thus parameters and return type) might change, leading to your k[ret]probe kernel module requiring constant maintenance. (Honestly, this is pretty much a given.)
A bit more on this last point. An important word of caution: it can be dangerous – from a stability and security viewpoint – to include third-party kernel modules on production systems, especially (and obviously), on mission-critical ones. Their presence can also void the warranty given by the OS vendors (such as Red Hat, SUSE Linux Enterprise Server (SLES), Canonical, and so on). DevOps people are in general extremely wary of letting untested code into production systems, let alone kernel modules; they won't exactly be thrilled when you insert them.
Also, kprobes can cause kernel instability when attached to high-volume code paths (such as scheduling, interrupt/timer, or networking code). Avoid them, if possible. If not, at least mitigate the risk by reducing printk usage and using printk rate-limiting APIs (we covered rate-limiting the printk in the previous chapter).
How will I know if a certain kernel (or module) function runs very often? The funccount utility – via either the perf-tools[-unstable] package or the more recent eBPF tools packages – can profile and show you high-volume code paths within the kernel. (The utility script is typically named funccount-perf or funccount-bpfcc, depending on what you have installed.)
A modern, cleaner, and far more efficient approach to the static kprobe (or kretprobe) is to employ tracing mechanisms that are already built into the kernel fabric, and are thus tested and production-ready. These include using dynamic kprobes or kprobe-based event tracing (frontends such as kprobe-perf take advantage of these), kernel trace points (provided via ftrace), perf and eBPF frontends, and so on. They're also simply a lot easier to use; they don't require C coding and deep knowledge of kernel internals, and they're DevOps/sysad friendly as well! Let's get started exploring them!
The easier way – dynamic kprobes or kprobe-based event tracing
Similar, but much superior, to how I built a small script in demo 4, to make it easier for us to hook into any kernel function via kprobes, there is a package called perf-tools (or perf-tools-unstable). The creator and lead author is Brendan Gregg. Within the useful tools you'll find in this package, a bash script named kprobe (or kprobe-perf) is a fantastic wrapper, easily letting us set up kprobes (and kretprobes)!
Assuming you've installed the package (we specified it back in Chapter 1, A General Introduction to Debugging Software), let's go ahead and verify it's there and then run the script (by the way, on my x86_64 Ubuntu 20.04 LTS system, the package name is perf-tools-unstable and the script is called kprobe-perf):
# dpkg -l|grep perf-tools
ii perf-tools-unstable 1.0.1~20200130+git49b8cdf-1ubuntu1 all DTrace-like tools for Linux
# file $(which kprobe-perf)
/usr/sbin/kprobe-perf: Bourne-Again shell script, ASCII text executable
#
Great; let's run it and see its help screen (you will eventually need to run it as root, so I just do so here):
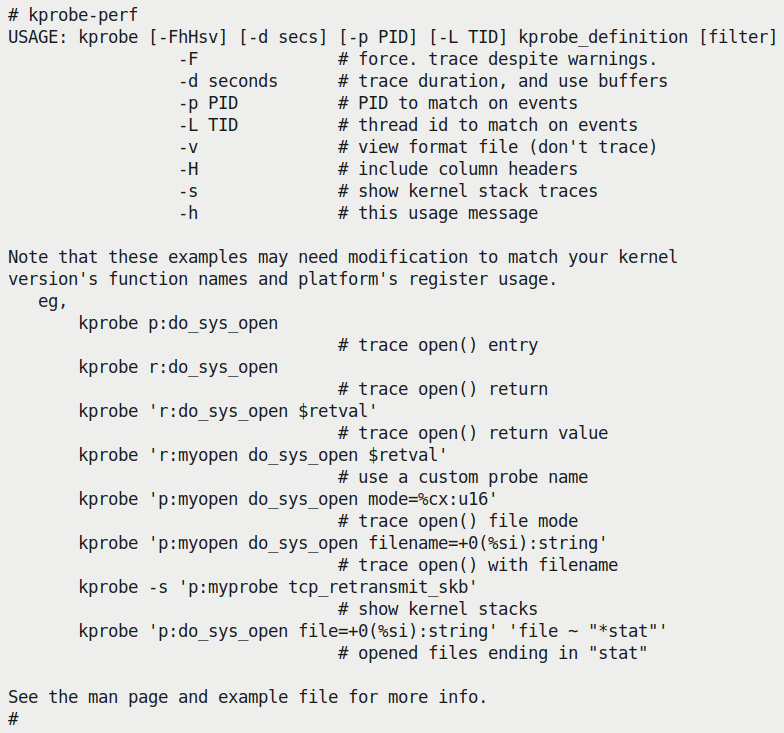
Figure 4.9 – Screenshot showing the help screen of the kprobe-perf script
The help screen does a great job of summing up how you can use this useful utility; do refer to its man page (as well as an online examples page here: https://github.com/brendangregg/perf-tools/blob/master/examples/kprobe_example.txt).
I recommend you first try out a few examples similar to those shown in Figure 4.9.
Next, and without further ado, let's leverage this powerful script to very easily do what we so painstakingly progressed to in the earlier four demos: set up a kprobe on do_sys_open() and print the pathname of the file being opened (as our earlier example in Figure 4.5 shows!):
# kprobe-perf 'p:do_sys_open file=+0(%si):string'
Tracing kprobe do_sys_open. Ctrl-C to end.
kprobe-perf-8171 [002] ...1 9159.540104: do_sys_open: (do_sys_open+0x0/0xf0) file="/etc/ld.so.cache"
kprobe-perf-8171 [002] ...1 9159.540259: do_sys_open: (do_sys_open+0x0/0xf0) file="/lib/x86_64-linux-gnu/libc.so.6"
kprobe-perf-8171 [002] ...1 9159.542030: do_sys_open: (do_sys_open+0x0/0xf0) file=(fault)
kprobe-perf-8171 [002] ...1 9159.542818: do_sys_open: (do_sys_open+0x0/0xf0) file="trace_pipe"
irqbalance-676 [000] ...1 9162.010699: do_sys_open: (do_sys_open+0x0/0xf0) file="/proc/interrupts"
irqbalance-676 [000] ...1 9162.011642: do_sys_open: (do_sys_open+0x0/0xf0) file="/proc/stat"
[...]^C
Notice the syntax:
- The 'p:do_sys_open' sets up a kprobe on the do_sys_open() kernel function.
- On the x86_64, the ABI tells us that the [R]SI register holds the second parameter to the function (recall Table 4.1) – in this case, it's the pathname of the file being opened. The script employs the syntax +0(%si):string to display its content as a string (prefixed with file=).
As easy as that! To minimally test it, I ran ps in another terminal window; immediately the kprobe-perf script dumped lines like this:
ps-8172 [000] ...1 9164.231685: do_sys_open: (do_sys_open+0x0/0xf0) file="/lib/x86_64-linux-gnu/libdl.so.2"
ps-8172 [000] ...1 9164.232582: do_sys_open: (do_sys_open+0x0/0xf0) file="/lib/x86_64-linux-gnu/libc.so.6"
ps-8172 [000] ...1 9164.233758: do_sys_open: (do_sys_open+0x0/0xf0) file="/lib/x86_64-linux-gnu/libsystemd.so.0"
ps-8172 [000] ...1 9164.234776: do_sys_open: (do_sys_open+0x0/0xf0) file="/lib/x86_64-linux-gnu/librt.so.1"
[...]
ps-8172 [000] ...1 9164.248680: do_sys_open: (do_sys_open+0x0/0xf0) file="/proc/meminfo"
ps-8172 [000] ...1 9164.249511: do_sys_open: (do_sys_open+0x0/0xf0) file="/proc"
ps-8172 [000] ...1 9164.260290: do_sys_open: (do_sys_open+0x0/0xf0) file="/proc/1/stat"
ps-8172 [000] ...1 9164.260854: do_sys_open: (do_sys_open+0x0/0xf0) file="/proc/1/status"
[...]
...and plenty more... You can literally gain insight into how ps works by doing this! (In fact, the wonderful strace utility – it traces all system calls issued by a process – can approach this level of detail as well! Don't ignore it.)
The point here of course is to simply show you how much easier it is to get the same valuable information – internally leveraging the kernel's kprobes framework and knowledge of the processor ABI – using this tool.
Further, the output format that the kprobe-perf script uses is as follows:
# _-----=> irqs-off
# / _----=> need-resched
# | / _---=> hardirq/softirq
# || / _--=> preempt-depth
# ||| / delay
# TASK-PID CPU# |||| TIMESTAMP FUNCTION
# | | | |||| | |
ps-8172 [000] ...1 9164.260854: do_sys_open: (do_sys_open+0x0/0xf0) file="/proc/1/status"
It's familiar, with good reason: it's again that of ftrace, and very similar to what we did with our PRINT_CTX() macro (recall Figure 4.4).
As you probably guessed, the kprobe-perf script, to get the job done, somehow sets up a kprobe; this is indeed easily verified by looking up the kprobes/list pseudo-file under your debugfs mount point. While the preceding command was running, I ran this in another terminal window:
# cat /sys/kernel/debug/kprobes/list
ffffffff965d1a60 k do_sys_open+0x0 [FTRACE]
Clearly, a kprobe was set up on the do_sys_open() kernel function.
Kprobe-based event tracing – minimal internal details
So, how does the kprobe-perf script set up a kprobe? Ah, here's the really interesting thing: it does so by leveraging the kernel's ftrace infrastructure, which internally tracks key events within the kernel. This is known as the kernel's event tracing framework, and within it, the kprobes events framework. It can be considered to be a subset of the larger ftrace kernel system; that's why you see [FTRACE] to the right of the kprobes/list line! (We cover ftrace in depth in Chapter 9, Tracing the Kernel Flow.)
The kprobe events code was introduced into the kernel back in 2009 by Masami Hiramatsu. Essentially, via it, the kernel can toggle the tracing of select (with a few limitations) kernel functions.
Internally speaking, here's the bare minimum information on how a kprobe is set up: within the debugs tracing folder (typically here: /sys/kernel/debug/tracing/), there will exist a directory named events (this is assuming the kernel config CONFIG_KPROBE_EVENTS=y; it typically is, even on distro and many production kernels). Under it, there are folders representing various subsystems and/or well-known event classes that the kernel's event tracing infrastructure tracks.
Using the event tracing framework to trace built-in functions
The kernel's event tracing infrastructure also mirrors these tracepoints at this location: /sys/kernel/tracing. This can be particularly useful when, on a production system, debugfs is kept invisible (as a security measure).
Let's peek into it:
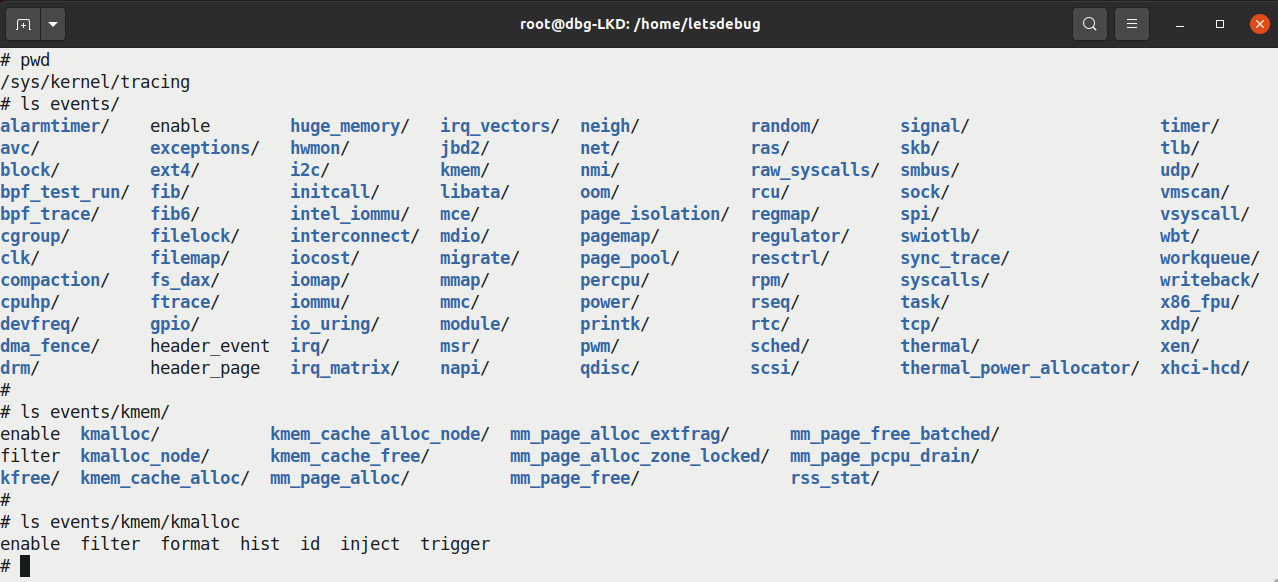
Figure 4.10 – Screenshot showing the kernel's event tracing - (pseudo) files and folders under /sys/kernel/tracing/events
All right, a huge number of event classes and subsystems can be easily and readily traced!
Take, for example, the common kernel memory allocator routine, the really popular kmalloc() slab API. In Figure 4.10, you can see the pseudo-files corresponding to tracing kmalloc() at the bottom (within the events/kmem/kmalloc directory).
Here, the format pseudofile really has the details on what gets reported (and how it's internally looked up); it essentially represents a structure that the kernel maintains and has the ability to look up. (Running kprobe-perf with the –v option switch will show you this format file and won't perform tracing.)
Writing 1 to the enable pseudo-file enables tracing and it runs under the hood. You can see the resulting output by reading the pseudo-file named /sys/kernel/[debug]/tracing/trace (or trace-pipe; reading from trace_pipe keeps a watch on the file, similar to doing a tail –f on a file – useful indeed).
Let's try this out. We'll give it a quick spin (here, on a Raspberry Pi 0W):

Figure 4.11 – Truncated screenshot showing an example of easily tracing the kmalloc() routine
Voilà; and so easily achieved! Every single kmalloc() invocation – invoked by either the kernel or a module – is traced. The precise printk format specifier that details the kmalloc information (the content you see from kmalloc: call site=… onwards) is specified by the events/kmem/kmalloc/format pseudo-file.
Once done, turn the probe off with the following:
rpi # echo 0 > events/kmem/kmalloc/enable
And empty the kernel trace buffer with the following:
rpi # echo > trace
(By the way, event tracing via the enable pseudo-file is just one way to use the kernel's powerful event tracing framework; do refer to the official kernel documentation for more here: Event Tracing: https://www.kernel.org/doc/html/latest/trace/events.html#event-tracing.)
So, think about this: Figure 4.10 shows us the automatically available tracepoints that the kernel makes available – in effect, the built-in kernel tracepoints. But what if you need to trace a function that isn't within there (in effect, that's not present under /sys/kernel/[debug]/tracing/events)? Well, there's always a way – the coverage of the next section!
Setting up a dynamic kprobe (via kprobe events) on any function
To set up a kprobe dynamically on any given kernel (or module) function (with a few exceptions, as mentioned in the Kprobes – limitations and downsides section), let's learn how to employ the kernel's dynamic event tracing framework and what's christened the function-based kprobes feature.
You should realize, though, that the kprobe can only be set up if the function to be probed is either of the following:
- Present in the kernel global symbol table (can be seen via /proc/kallsyms)
- Present within the ftrace framework's available function list (here: <debugs_mount>/tracing/available_filter_functions)
What if the function to be probed is within a kernel module? That's no problem: once the module is loaded into kernel memory, the internal machinery will ensure that all symbols are by now part of the kernel's symbol table, and will thus be visible within /proc/kallsyms; view it as root, of course. In fact, the section that follows shows precisely this.
To set up a dynamic kprobe, do as follows:
- Initialize the dynamic probe point:
# cd /sys/kernel/debug/tracing
If, for whatever reason, this doesn't work – typically if debugfs is invisible on a production kernel (or ftrace is disabled), then change it to the following:
# cd /sys/kernel/tracing
Then set up the dynamic kprobe as follows:
echo "p:<kprobe-name> <function-to-kprobe> […]" >> kprobe_events
The p: specifies you're setting up a (dynamic) kprobe. The name following the : character is any name you wish to give this probe (it will default to the function name if you don't pass anything). Then, put a space and the actual function to probe. Optional arguments can be used to specify more stuff – querying the probed function's parameter values being typical! We'll learn more as we go along...
Tip
On production systems that are configured with the kernel config option CONFIG_DEBUG_FS_DISALLOW_MOUNT=y – rendering the debugfs filesystem effectively invisible – the debugfs filesystem won't even have a mount point. In cases like this, make use of the /sys/kernel/tracing location (as shown earlier) and perform the dynamic kprobe work from therein.
Let's set this up with our usual example. Set up a simple kprobe (with no additional info, such as open file pathname, generated) on the do_sys_open() function:
echo "p:my_sys_open do_sys_open" >> kprobe_events
Now that it's set up, under the /sys/kernel/[debug]/tracing/events folder, you will now find a (pseudo) folder named kprobes; it – /sys/kernel/[debug]/tracing/events/kprobes/ – will contain any and all dynamic kprobes that have been defined:
# ls -lR events/kprobes/
events/kprobes/:
total 0
drwxr-xr-x 2 root root 0 Oct 9 18:58 my_sys_open/
-rw-r--r-- 1 root root 0 Oct 9 18:58 enable
-rw-r--r-- 1 root root 0 Oct 9 18:58 filter
events/kprobes/my_sys_open:
total 0
-rw-r--r-- 1 root root 0 Oct 9 18:59 enable
-rw-r--r-- 1 root root 0 Oct 9 18:58 filter
-r--r--r-- 1 root root 0 Oct 9 18:58 format
[…]
- The probe is disabled by default; let's enable it (as root):
echo 1 > events/kprobes/my_sys_open/enable
Now it's enabled and running, you can look up the trace data by simply doing the following:
cat trace
[…]
cat-192796 [001] .... 392192.698410: my_sys_open: (do_sys_open+0x0/0x80) file="/usr/lib/locale/locale-archive"
cat-192796 [001] .... 392192.698650: my_sys_open: (do_sys_open+0x0/0x80) file="trace"
gnome-shell-7441 [005] .... 392192.777608: my_sys_open: (do_sys_open+0x0/0x80) file="/sys/class/net/wlo1/statistics/rx_packets"
[…]
Doing a cat trace_pipe allows you to watch the file, feeding data as it becomes available – a very useful thing while using dynamic kprobe events interactively. Or, you can perhaps do something like this to save it to a file:
cp /sys/kernel/tracing/trace /tmp/mytrc.txt
- To finish, first write 0 to the enable file to disable the kprobe and then do this to destroy it:
echo 0 > events/kprobes/my_sys_open/enable
echo "-: <kprobe-name>" >> kprobe_events
Alternatively, doing the following:
echo > /sys/kernel/tracing/kprobe_events
… clears all probe points.
So, here, let's disable and destroy our custom dynamic kprobe my_sys_open as follows:
echo 0 > events/kprobes/do_sys_open/enable
echo "-:my_sys_open" >> kprobe_events
Once all dynamic probe points (kprobes) are destroyed, the /sys/kernel/[debug]/tracing/events/kprobe_events pseudo-file itself disappears.
Further, doing echo > trace empties the kernel trace buffer of all its trace data.
Even more in-depth details on how to use this powerful dynamic kprobes-based event tracing are beyond the scope of this book; I refer you to the excellent kernel documentation here: Kprobe-based Event Tracing: https://www.kernel.org/doc/html/latest/trace/kprobetrace.html#kprobe-based-event-tracing.
It's also very educative to read through the source of the kprobe-perf script itself: https://github.com/brendangregg/perf-tools/blob/master/kernel/kprobe.
Taking care not to overflow or overwhelm
Do keep this in mind though! Just as mentioned with regard to our manual usage of kprobes, the kprobe-perf script has a similar warning within it:
# WARNING: This uses dynamic tracing of kernel functions, and could cause kernel panics or freezes, depending on the function traced. Test in a lab environment, and know what you are doing, before use.
Try and mitigate this by only tracing precisely what's required for as small a time window as is feasible. The kprobe-perf script's -d option – duration specifier – is useful in this regard. It has the kernel internally buffer the output into a per-CPU buffer; the size is fixed via /sys/kernel/[debug]/tracing/buffer_size_kb. If you still get overflows, try increasing its size.
Trying this on an ARM system
As with the x86, doing echo "p:my_sys_open do_sys_open" > /sys/kernel/debug/tracing/kprobe_events (as root) on an ARM system will work of course... But what if we'd like to display the filename parameter to the open system call as well? Well, we (think we) know how to, so let's try it out:
# echo "p:my_sys_open do_sys_open file=+0(%si):string" > /sys/kernel/debug/tracing/kprobe_events
bash: echo: write error: Invalid argument
Whoops; why did it fail?
It should be obvious: the register holding the second argument – the pathname of the file being opened – is named [R]SI on the x86[_64], but not on the ARM processor! On ARM-32 the first four parameters to a function are piggy-backed on CPU registers r0, r1, r2, and r3 (again, do refer to Table 4.1). So, take this arch-dependence into account:
echo "p:my_sys_open do_sys_open file=+0(%r1):string" > /sys/kernel/debug/tracing/kprobe_events
Now it will work!
We can go further, printing out all arguments to the open call:
echo 'p:my_sys_open do_sys_open dfd=%r0 file=+0(%r1):string flags=%r2 mode=%r3' > /sys/kernel/debug/tracing/kprobe_events
(Don't forget to enable the probe.)
It is even simpler to do with the wrapper kprobe[-perf] script (you need the perf-tools[-unstable] package installed):
rpi # kprobe-perf 'p:my_sys_open do_sys_open dfd=%r0 file=+0(%r1):string flags=%r2 mode=%r3'
Tracing kprobe my_sys_open. Ctrl-C to end.
cat-1866 [000] d... 8803.206194: my_sys_open: (do_sys_open+0x0/0xd8) dfd=0xffffff9c file="/etc/ld.so.preload" flags=0xa0000 mode=0x0
cat-1866 [000] d... 8803.206548: my_sys_open: (do_sys_open+0x0/0xd8) dfd=0xffffff9c file="/usr/lib/arm-linux-gnueabihf/libarmmem-v6l.so" flags=0xa0000 mode=0x0
cat-1866 [000] d... 8803.207085: my_sys_open: (do_sys_open+0x0/0xd8) dfd=0xffffff9c file="/etc/ld.so.cache" flags=0xa0000 mode=0x0
cat-1866 [000] d... 8803.207235: my_sys_open: (do_sys_open+0x0/0xd8) dfd=0xffffff9c file="/lib/arm-linux-gnueabihf/libc.so.6" flags=0xa0000 mode=0x0
cat-1866 [000] d... 8803.209703: my_sys_open: (do_sys_open+0x0/0xd8) dfd=0xffffff9c file="/usr/lib/locale/locale-archive" flags=0xa0000 mode=0x0
cat-1866 [000] d... 8803.210395: my_sys_open: (do_sys_open+0x0/0xd8) dfd=0xffffff9c file="trace_pipe" flags=0x20000 mode=0x0
^C
Ending tracing...
rpi #
Interesting, right? Do try it out yourself.
Exercise
Set up a kprobe to trigger whenever an interrupt handler's tasklet (bottom half) routine is scheduled to execute. Also display the kernel mode stack leading up to this point.
One solution
With traditional IRQ handling (top/bottom halves, rather than the modern thread-based IRQ handling), the top half runs with all interrupts disabled across all CPUs (guaranteeing it runs atomically) while the bottom half – the tasklet – runs with all interrupts enabled on all processors. In this context, this is what typically occurs. A driver author, within the hardware interrupt handler (the so-called top half) typically requests the kernel to schedule its tasklet by invoking the kernel API schedule_tasklet(). Let's look up its underlying kernel implementation:
# grep tasklet_schedule /sys/kernel/debug/tracing/available_filter_functions
__tasklet_schedule_common
__tasklet_schedule
Okay, this tells us that we should set up a dynamic kprobe on the function named __tasklet_schedule(). Further, we pass the –s option switch to kprobe-perf, asking it to also provide a (kernel-mode) stack trace – in effect, telling us how exactly each instance of this function was invoked! This can be really useful when debugging:
# kprobe-perf -s 'p:mytasklets __tasklet_schedule'
Tracing kprobe mytasklets. Ctrl-C to end.
kworker/0:0-1855 [000] d.h. 9909.886809: mytasklets: (__tasklet_schedule+0x0/0x28)
kworker/0:0-1855 [000] d.h. 9909.886829: <stack trace>
=> __tasklet_schedule
=> bcm2835_mmc_irq
=> __handle_irq_event_percpu
=> handle_irq_event_percpu
=> handle_irq_event
=> handle_level_irq
=> generic_handle_irq
=> __handle_domain_irq
=> bcm2835_handle_irq
=> __irq_svc
=> bcm2835_mmc_request
=> __mmc_start_request
=> mmc_start_request
=> mmc_wait_for_req
=> mmc_wait_for_cmd
=> mmc_io_rw_direct_host
=> mmc_io_rw_direct
=> process_sdio_pending_irqs
=> sdio_irq_work
=> process_one_work
=> worker_thread
=> kthread
=> ret_from_fork
[...]
Figure 4.4 helps us interpret the output of the kworker... lines: we can see from the d.h. four-character sequence that interrupts are currently disabled (off) and a hardirq (a hardware interrupt handler) is running.
The remaining output – the kernel mode stack content at the time (the upper portion being the IRQ stack) shows us how this particular interrupt came up and how it ended up running a tasklet (which itself internally becomes a softirq of type TASKLET_SOFTIRQ). Further, the stack trace (always read it bottom up) shows that this interrupt is likely generated by I/O being performed on the Secure Digital MultiMedia Card (SD MMC) card.
(Again folks, FYI, the in-depth details regarding interrupts and their handling are covered in my earlier, freely available e-book, Linux Kernel Programming – Part 2.)
Using dynamic kprobe event tracing on a kernel module
Note that we're trying this out on our custom production kernel (on our x86_64 Ubuntu guest) to mimic a production environment:
- First, load up our test driver, the miscdrv_rdwr kernel module from Chapter 3, Debug via Instrumentation – printk and Friends:
$ cd <lkd-src-tree>/ch3/miscdrv_rdwr
$ ../../lkm
Usage: lkm name-of-kernel-module-file (without the .c)
$ ../../lkm miscdrv_rdwr
Version info:
Distro: Ubuntu 20.04.3 LTS
Kernel: 5.10.60-prod01
[...]
sudo dmesg
------------------------------
[ 1987.178246] miscdrv_rdwr:miscdrv_rdwr_init(): LLKD misc driver (major # 10) registered, minor# = 58, dev node is /dev/llkd_miscdrv_rdwr
$
- A quick grep shows that its symbols are now part of the kernel global symbol table (as expected, even on our production kernel):
$ sudo grep miscdrv /proc/kallsyms
ffffffffc0562000 t write_miscdrv_rdwr [miscdrv_rdwr]
ffffffffc0562982 t write_miscdrv_rdwr.cold [miscdrv_rdwr]
ffffffffc0562290 t open_miscdrv_rdwr [miscdrv_rdwr]
ffffffffc0562480 t close_miscdrv_rdwr [miscdrv_rdwr]
ffffffffc0562650 t read_miscdrv_rdwr [miscdrv_rdwr]
ffffffffc05629b5 t read_miscdrv_rdwr.cold [miscdrv_rdwr]
[...]
The .cold Compiler Attribute
By the way, why are some functions suffixed with .cold? The short answer is that it's a compiler attribute specifying that the function is unlikely to be executed. These so-called cold functions are typically placed in a separate linker section to improve the code locality of the required-to-be-fast non-cold sections! It's all about optimization. Also notice that, above, there's both the normal version and the cold version of some functions (the read and write I/O routines of our driver).
- In another terminal window, let's set up a dynamic kprobe on our write_miscdrv_rdwr() module function, as root:
cd /sys/kernel/tracing
echo "p:mymiscdrv_wr write_miscdrv_rdwr" >> kprobe_events
# cat kprobe_events
p:kprobes/mymiscdrv_wr write_miscdrv_rdwr
#
We give the probed function a name, mymiscdrv_wr. Now enable it:
echo 1 > events/kprobes/mymiscdrv_wr/enable
- Run a test:
- In one terminal window, within the tracing folder (/sys/kernel/tracing), run the following:
cat trace_pipe
- In another terminal window, we run our userspace program to write to our misc class driver's device file. This will guarantee our probe point (the write_miscdrv_rdwr() module function) gets invoked:
$ ./rdwr_test_secret w /dev/llkd_miscdrv_rdwr "dyn kprobes event tracing is awesome"
The userspace process executes, writing into our device driver. The following screenshot shows both the execution of this userspace process as well as the dynamic kprobe being set up and traced:

Figure 4.12 – Screenshot showing testing a dynamic kprobe via the kprobe events framework on a device driver module function
Study the preceding screenshot carefully. The terminal window at the bottom is where we set up our dynamic probe (corresponding to steps 3 and 4A above). The terminal window on top is where we test by invoking the write functionality of our driver (twice; in effect, this corresponds to step 4B). You can see how, in the lower terminal, the dynamic kprobe is set up and enabled. Then it watches for trace data by doing a cat on the trace_pipe file. When data becomes available, we see it...
Disable the probe point and destroy it with the following:
# echo 0 > events/kprobes/mymiscdrv_wr/enable
# echo "-:mymiscdrv_wr" >> kprobe_events
# cat kprobe_events
# echo > trace
The last command empties out the kernel trace buffer.
In effect, you should by now realize that what we've done in this section is pretty much automated by the kprobe-perf bash script! It even has other interesting options to try. This makes it a powerful weapon in our debug/observability armory!
Before concluding this section, it's good to know that even userspace application processes can be traced via the kernel's dynamic event tracing framework – this feature is called Uprobes (as opposed to kprobes). I refer you to the official kernel documentation on it here: Uprobe-tracer: Uprobe-based Event Tracing: https://www.kernel.org/doc/html/latest/trace/uprobetracer.html#uprobe-tracer-uprobe-based-event-tracing.
Setting up a return probe (kretprobe) with kprobe-perf
With the kprobe-perf wrapper script, you can set up a return probe – a kretprobe – as well! Using it is simplicity itself. Here's our usual example, fetching the return value of the do_sys_open() kernel function:
rpi # kprobe-perf 'r:do_sys_open ret=$retval'
Tracing kprobe do_sys_open. Ctrl-C to end.
kprobe-perf-2287 [000] d... 13013.021003: do_sys_open: (sys_openat+0x1c/0x20 <- do_sys_open) ret=0x3
<...>-2289 [000] d... 13013.027167: do_sys_open: (sys_openat+0x1c/0x20 <- do_sys_open) ret=0x3
<...>-2289 [000] d... 13013.027504: do_sys_open: (sys_openat+0x1c/0x20 <- do_sys_open) ret=0x3
^C
Ending tracing...
rpi #
The key point here is the return value being fetched; it shows up as the following:
ret=0x3
This makes sense; the return to the open API is the file descriptor assigned within the process context's open file table. Here, it happens to be the value 3 (with 0, 1, and 2 typically being taken up by stdin, stdout, and stderr).
Next, let's examine the notation:
do_sys_open: (sys_openat+0x1c/0x20 <- do_sys_open)
This implies that our probed function do_sys_open() has been called by and is returning to the sys_openat() function. Further, the notation <func>+0x1c/0x20 following the function name, or generically, the <func>+off/len, is interpreted as follows:
- off: The offset within the function <func> where the code returns
- len: What the kernel feels is the overall length of the function <func> (it's an approximation, usually correct)
The remainder of the output is in the usual ftrace format notation that you should be familiar with by now...
Before concluding this section, we'll mention that even more can be achieved by leveraging this powerful function-based dynamic kprobes framework within the kernel. Steven Rostedt's slides show how you can burrow ever deeper and extract pretty much any arguments to a function being probed and indeed, delve into relevant kernel structures (via offsets) to reveal their runtime values (https://events19.linuxfoundation.org/wp-content/uploads/2017/12/oss-eu-2018-fun-with-dynamic-trace-events_steven-rostedt.pdf). Do check it out.
Well, well, we're almost done! Let's complete this chapter with one more section where you'll learn something quite practical – briefly understanding and tracing the execution of processes on the system. This can help as an audit-like facility, allowing you to log whatever userspace processes executed.
Trapping into the execve() API – via perf and eBPF tooling
On Linux (and UNIX), user mode applications – processes – are launched or executed via a family of so-called exec C library (glibc) APIs: execl(), execlp(), execv(), execvp(), execle(), execvpe(), and execve().
A quick couple of things to know about these seven APIs: the first six are merely glibc wrappers that transform their arguments and ultimately invoke the execve() API – it is the actual system call, the one that causes the process context to switch to kernel mode and run the kernel code corresponding to the system call. Also, FYI, execvpe() is a GNU extension (and thus practically only seen on Linux).
The point here is simply this: ultimately, pretty much all processes (and thus apps) are executed via the kernel code of execve()! Within the kernel, execve() becomes the sys_execve() function (in a bit of an indirect fashion, via the SYSCALL_DEFINE3() macro), which invokes the actual worker routine, do_execve().
System calls and where they land in the kernel
This, in fact, is typical of many (but not all) system calls: the user-issued system call foo() becomes sys_foo(), which, if short enough performs the work itself, else invokes the actual worker routine, do_foo().
For example, the execve(2) system call becomes fs/exec.c:sys_execve() in the kernel (technically via the SYSCALL_DEFINE3() macro, 3 being the number of parameters passed via the syscall), which in turn invokes the worker function fs/exec.c:do_execve().
Caution though, this isn't always the case... For example, the open(2) system call's code path within the kernel's a bit different; the following screenshot sums this up:
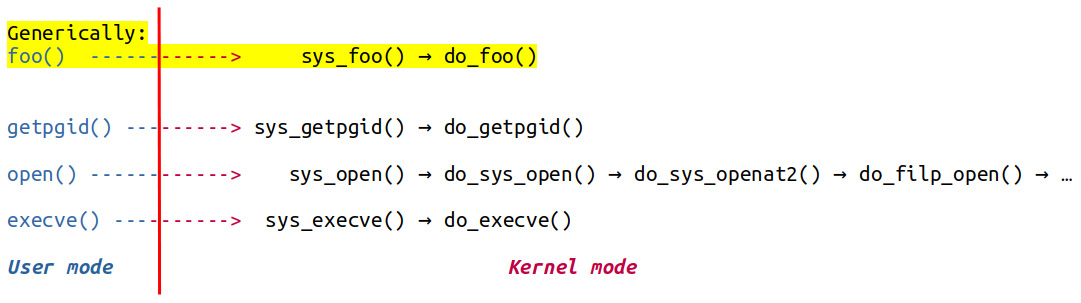
Figure 4.13 – How user mode system calls map within the kernel
An aside, but a useful one: how does a non-privileged user mode task (a process or thread) actually manage to cross the boundary from user mode into privileged kernel mode (depicted by the vertical red line in Figure 4.13)? The short answer is that every processor supports one or more machine instructions that allow this to happen – these are often referred to as call gates or traps (we say that the process traps from user mode to kernel mode).
For example, the x86 traditionally used software interrupt int 0x80 to perform the trap; modern versions use the syscall machine instruction; ARM-32 uses the SWI (software interrupt) machine instruction; and AArch64 (ARM64) uses the SVC (supervisor) instruction to do so. See the man page on syscall(2) for more details.
Again, FYI, there is an alternate almost equivalent system call to execve() –execveat(). The difference being that the first parameter to it is a directory relative to which the program – the second parameter – is executed.
Let's return to the main point: now that we know that processes are executed via execve(), won't it be cool to trap into it – perhaps via injecting a kprobe into the sys_execve() or do_execve() kernel APIs? Yes, but... (there's always a but isn't there?): on modern kernels, it simply doesn't work – trying it via the static kprobe approach, the register_kprobe() fails. Please try it yourself. Remember, always the empirical approach!
In fact, on my x86_64 Ubuntu 20.04 LTS VM, even the execsnoop-perf(8) wrapper tool, built for precisely this purpose, (which internally uses the kernel's ftrace kprobe_events pseudo-file), fails:
$ sudo execsnoop-perf
Tracing exec()s. Ctrl-C to end.
ERROR: adding a kprobe for execve. Exiting.
The more recent eBPF tooling solves this once and for all; install and employ (as root) execsnoop-bpfcc(8) and it just works! The following section has us peeking into the exec via an eBPF frontend.
Observability with eBPF tools – an introduction
An extension of the well-known Berkeley Packet Filter or BPF, eBPF is the extended BPF. Very briefly, BPF used to provide the supporting infrastructure within the kernel to effectively trace network packets. eBPF is a relatively recent kernel innovation – available only from the Linux 4.1 kernel (June 2015) onward. It extends the BPF notion, allowing you to trace much more than just the network stack. Also, it works for tracing both kernel space as well as userspace apps. In effect, eBPF and its frontends are the modern approach to tracing and performance analysis on a Linux system.
To use eBPF, you will need a system with the following:
- Linux kernel 4.1 or newer
- Kernel support for eBPF (do see https://github.com/iovisor/bcc/blob/master/INSTALL.md#kernel-configuration)
Using the eBPF kernel feature directly is considered to be very hard, so there are several easier frontends to use. Among them, the BPF Compiler Collection (BCC), bpftrace, and libbpf+BPF CO-RE (Compile Once – Run Everywhere) are regarded as being very useful. It's really simplest to install the bcc binary packages for these frontends. You'll find instructions regarding this here: https://github.com/iovisor/bcc/blob/master/INSTALL.md#packages.
Check out the following link to a picture that opens your eyes to just how many powerful BCC/BPF tools are available to help trace different Linux subsystems and hardware: https://www.brendangregg.com/BPF/bcc_tracing_tools_early2019.png.
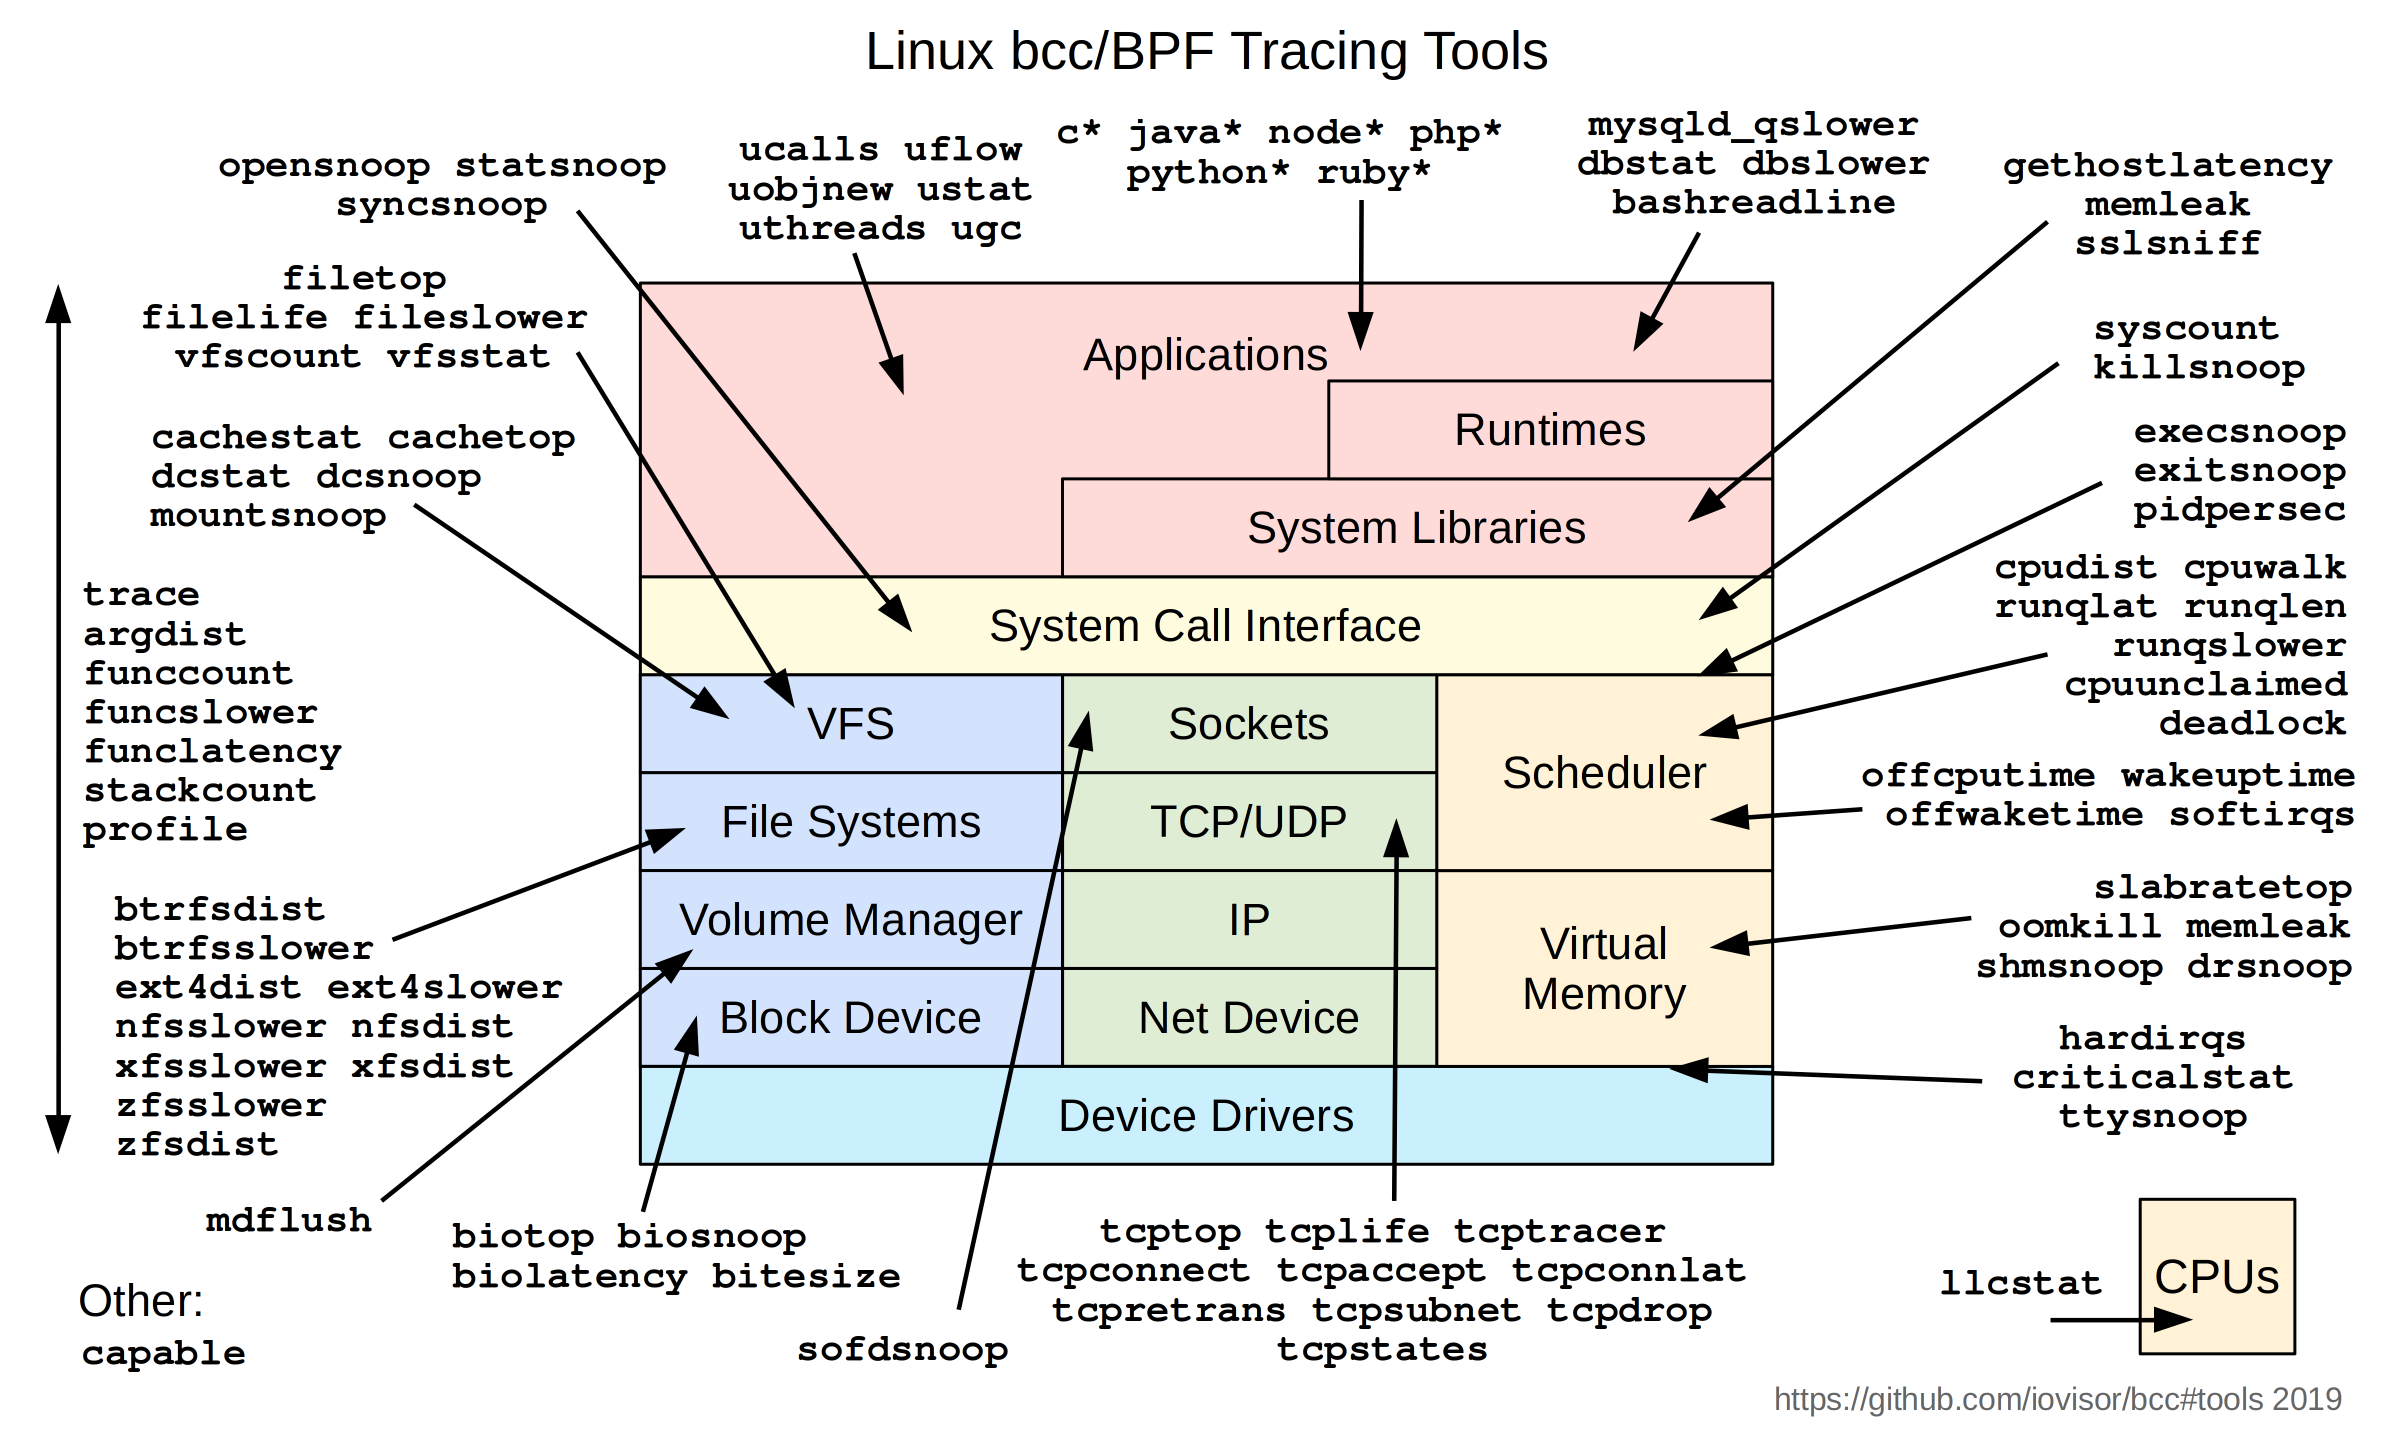
Here, we don't intend to delve into details; instead, we'll give you a quick flavor of using a BCC frontend utility to track processes being executed. To try this, I assume you've installed the BCC frontend package (we did this back in Chapter 1, A General Introduction to Debugging Software). Quick tip: on Ubuntu, do sudo apt install bpfcc-tools, but do see the following callout.
eBPF BCC Installation
You can install the BCC tools package for your regular host Linux distro by reading the installation instructions here: https://github.com/iovisor/bcc/blob/master/INSTALL.md. Sometimes, though (especially on older distros, such as Ubuntu 18.04), this approach of installing the bpfcc-tools package will typically work only on a pre-built Linux distro (such as Ubuntu/Debian/RedHat, and so on) but may not on a Linux that has a custom kernel. The reason: the installation of the BCC toolset includes (and depends upon) the installation of the linux-headers-$(uname -r) package. This linux-headers package exists only for distro kernels (and not for our custom 5.10 kernel that we shall often be running on the guest). With Ubuntu 20.04 LTS, it does seem to work, even when running a custom kernel.
Once the bpfcc-tools package is installed, you can get a listing (and feel) for all the frontend utilities by doing the following:
dpkg -L bpfcc-tools |grep "^/usr/sbin.*bpfcc$"
On my x86_64 Ubuntu 20.04 LTS guest VM (running our custom 5.10.60-prod01 kernel), I find there are 112 *-bpfcc utilities installed (they're actually Python scripts).
In the section just prior to this one, we saw that the execve() (or execveat()) system call is the one that actually executes processes. We attempted to trace its execution via the perf-tools utilities (execsnoop-perf), but it just failed. Now, with the eBPF BCC frontends installed, let's retry:
$ uname -r
5.10.60-prod01
$ sudo execsnoop-bpfcc 2>/dev/null
[...]
PCOMM PID PPID RET ARGS
id 7147 7053 0 /usr/bin/id -u
id 7148 7053 0 /usr/bin/id -u
git 7149 7053 0 /usr/bin/git config --global credential.helper cache --timeout 36000
cut 7151 7053 0 /usr/bin/cut -d= -f2
grep 7150 7053 0 /usr/bin/grep --color=auto ^PRETTY_NAME /etc/os-release
cat 7152 7053 0 /usr/bin/cat /proc/version
ip 7157 7053 0 /usr/bin/ip a
sudo 7159 7053 0 /usr/bin/sudo route -n
route 7160 7159 0 /usr/sbin/route -n
[...]
It just works as processes get executed. The execsnoop-bpfcc script displays a line of output showing a few details regarding the process that just executed. Notice how all parameters to the command being executed are displayed as well! The help screen is definitely worth looking up (just run it with the -h option switch). The man pages should be installed as well. Both have one-liner example usage; do check it out.
As with the perf-tools utilities, all the *-bpfcc scripts need to be run as root. A fair amount of noise can be generated initially. We defeat it by redirecting stderr to the null device.
Our good old example – trapping into and tracing do_sys_open() – right from the beginning of this chapter, can, once again, be very easily achieved with BCC:
$ sudo opensnoop-bpfcc 2>/dev/null
PID COMM FD ERR PATH
1431 upowerd 9 0 /sys/devices/LNXSYSTM:00/LNXSYBUS:00/PNP0A03:00/PNP0C0A:00/power_supply/BAT0/voltage_now
1431 upowerd 9 0 /sys/devices/LNXSYSTM:00/LNXSYBUS:00/PNP0A03:00/PNP0C0A:00/power_supply/BAT0/capacity
1431 upowerd -1 2 /sys/devices/LNXSYSTM:00/LNXSYBUS:00/PNP0A03:00/PNP0C0A:00/power_supply/BAT0/temp
[...]
431 systemd-udevd 14 0 /sys/fs/cgroup/unified/system.slice/systemd-udevd.service/cgroup.procs
431 systemd-udevd 14 0 /sys/fs/cgroup/unified/system.slice/systemd-udevd.service/cgroup.threads
[...] ^C
Again, Brendan Gregg's page on eBPF tracing tools (https://www.brendangregg.com/ebpf.html) will help you see the depth of tools available and how to begin making use of them.
Summary
In this chapter, you learned what kprobes and kretprobes are and how to exploit them to add useful telemetry (instrumentation) to your project or product in a dynamic fashion. We saw that you can even use them on production systems (though you should be careful to not overload the system).
We first covered the traditional static approach to using k[ret]probes, one where any change will require a recompile of the code; we even provided a semi-automated script to generate a kprobe as required. We then covered the better, efficient, dynamic kprobe tracing facilities that are built into modern Linux kernels. Using these techniques is not only a lot easier but has other advantages – they're pretty much always built into the kernel, no new code is required at the last minute on production systems, and running them is more efficient under the hood. As a bonus, you learned how to leverage the kernel's ftrace-based event tracepoints – a large number of kernel subsystems and their APIs can be very easily traced.
We finished this large-ish chapter by delving a bit into a practical consideration – how to trace the execution of a process (as an example). You found that tracing or tracking process execution, the opening of files (and in a similar fashion, most other things), can be very easily done via the modern eBPF tooling (bpfcc-tools BCC frontends) and, to some extent, via the perf-tools frontend.
Just of June 2022, the very recent 5.18 kernel has a new feature: fprobes. The fprobe is similar in intent to the k[ret]probe, but faster and is based on ftrace (https://www.kernel.org/doc/html/latest/trace/fprobe.html#fprobe-function-entry-exit-probe).
The next chapter is bound to be very useful; we'll delve into kernel memory issues and how to find and debug them! I highly recommend you first take the time to practice (do the suggested exercises mentioned during the course of this chapter), get comfortable with the content of this and earlier chapters, and then, after a quick break, jump into the next one!
Further reading
- Official kernel documentation: Kernel Probes (Kprobes): https://www.kernel.org/doc/html/latest/trace/kprobes.html#kernel-probes-kprobes
- [Kernel] Kprobe, Brian Pan, November 2020: https://ppan-brian.medium.com/kernel-kprobe-5036d7a8455f
- Kprobes via modern ftrace tracing, kprobe events:
- Taming Tracepoints in the Linux Kernel, Keenan, Mar 2020: https://blogs.oracle.com/linux/post/taming-tracepoints-in-the-linux-kernel
- Fun with Dynamic Kernel Tracing Events, The things you just shouldn't be able to do! Steven Rostedt, Oct 2018: https://events19.linuxfoundation.org/wp-content/uploads/2017/12/oss-eu-2018-fun-with-dynamic-trace-events_steven-rostedt.pdf
- Dynamic tracing in Linux user and kernel space, Pratyush Anand, July 2017: https://opensource.com/article/17/7/dynamic-tracing-linux-user-and-kernel-space (includes coverage on userspace probing with uprobe as well)
- Brendan Gregg's perf-tools page: https://github.com/brendangregg/perf-tools
- Specific to kprobes: kprobes-perf examples: https://github.com/brendangregg/perf-tools/blob/master/examples/kprobe_example.txt
- Specific to kprobes: kprobes-perf and related tooling code: https://github.com/brendangregg/perf-tools/tree/master/kernel
- Traps, Handlers (x86 specific): https://www.cse.iitd.ernet.in/~sbansal/os/lec/l8.html
- CPU ABI, function calling, and register usage conventions:
- APPLICATION BINARY INTERFACE (ABI) DOCS AND THEIR MEANING: https://kaiwantech.wordpress.com/2018/05/07/application-binary-interface-abi-docs-and-their-meaning/
- X86_64:
- x64 Cheat Sheet: https://cs.brown.edu/courses/cs033/docs/guides/x64_cheatsheet.pdf
- X86 64 Register and Instruction Quick Start: https://wiki.cdot.senecacollege.ca/wiki/X86_64_Register_and_Instruction_Quick_Start
- ARM32 / Aarch32: Overview of ARM32 ABI Conventions, Microsoft, July 2018: https://docs.microsoft.com/en-us/cpp/build/overview-of-arm-abi-conventions?view=msvc-160
- ARM64 / Aarch64:
- ARMv8-A64-bit Android on ARM, Campus London, September 2015, Architecture Overview presentation: https://armkeil.blob.core.windows.net/developer/Files/pdf/graphics-and-multimedia/ARMv8_Overview.pdf (do check out the ARMv8 terminology reference on page 32)
- Overview of ARM64 ABI conventions, Microsoft, Mar 2019: https://docs.microsoft.com/en-us/cpp/build/arm64-windows-abi-conventions?view=msvc-160
- ARM Cortex-A Series Programmer's Guide for ARMv8-A / Fundamentals-of-ARMv8: https://developer.arm.com/documentation/den0024/a/Fundamentals-of-ARMv8
- ARMv8 Registers: https://developer.arm.com/documentation/den0024/a/ARMv8-Registers
- ARM64 Reversing and Exploitation Part 1 - ARM Instruction Set + Simple Heap Overflow, Sept 2020: http://highaltitudehacks.com/2020/09/05/arm64-reversing-and-exploitation-part-1-arm-instruction-set-heap-overflow/
- How Linux kprobes works, Dec 2016: https://vjordan.info/log/fpga/how-linux-kprobes-works.html
- eBPF:
- Installing eBPF: https://github.com/iovisor/bcc/blob/master/INSTALL.md
- BCC tutorial: https://github.com/iovisor/bcc/blob/master/docs/tutorial.md
- Linux Extended BPF (eBPF) Tracing Tools, Brendan Gregg (see the pics as well!): https://www.brendangregg.com/ebpf.html
- How eBPF Turns Linux into a Programmable Kernel, Jackson, October 2020: https://thenewstack.io/how-ebpf-turnslinux-into-a-programmable-kernel/
- A Gentle Introduction to eBPF, InfoQ, May 2021: https://www.infoq.com/articles/gentle-linux-ebpf-introduction/
- (Kernel-level) A thorough introduction to eBPF, Matt Fleming, LWN, December 2017: https://lwn.net/Articles/740157/
- How io_uring and eBPF Will Revolutionize Programming in Linux, Glauber Costa, April 2020: https://thenewstack.io/how-io_uring-and-ebpf-will-revolutionizeprogramming-in-linux/
- Miscellaneous:
- Old but interesting, mostly on using SystemTap: Locating System Problems Using Dynamic Instrumentation, Prasad, Cohen, et al, 2005: https://sourceware.org/systemtap/systemtap-ols.pdf
- Different Approaches to Linux Host Monitoring, Kelly Shortridge, capsule8: https://capsule8.com/blog/different-approaches-to-linux-monitoring/