
Chapter 10: Kernel Panic, Lockups, and Hangs
It's unpleasant – that queasy feeling deep in the pit of your stomach, the cold sweat forming on your brow – when you get that dreaded kernel panic message on the console, and those absolute, unforgiving pixels, with the hard cold eye of a god, tell you that the system is effectively dead:
Kernel panic - not syncing: [...]
Why, oh why? – your lamentations are futile. Unless, unless... you don't panic (pun intended), read this chapter, figure out what's going on (by writing your own custom panic handler to help with that), and get on with your life, dude!
In addition to understanding and dealing with kernel panics, we also delve into the causes of kernel lockups, hung tasks, stalls, and how to configure a kernel to detect them. In this chapter, we're going to cover the following main topics:
- Panic! – what happens when a kernel panics
- Writing a custom kernel panic handler routine
- Detecting lockups and CPU stalls in the kernel
- Employing the kernel's hung task and workqueue stall detectors
Technical requirements
The technical requirements and workspace remain identical to what's described in Chapter 1, A General Introduction to Debugging Software. The code examples can be found within the book's GitHub repository here: https://github.com/PacktPublishing/Linux-Kernel-Debugging.
Panic! – what happens when a kernel panics
To conquer the beast, you must first understand it. In that spirit, let's panic!
The primary panic handling code in the kernel lies here: kernel/panic.c:panic(). The panic() function – the heart of it – receives, as parameters, a variable argument list – a printf-style format specifier and associated variables (whose values will be printed):
// kernel/panic.c
/**
* panic - halt the system
* @fmt: The text string to print
*
* Display a message, then perform cleanups.
* This function never returns.
*/
void panic(const char *fmt, ...)
{ [...]This function should (quite obviously) never be lightly invoked; calling it implies that the kernel is in an unusable, unusable state; once called, the system effectively comes to a grinding halt.
Let's panic
Here, with a view to being empirical and experimenting (on our test VM, of course), let's just call panic() and see what happens. Our enviously simple module does so; here's its code (besides the boilerplate #include and module macros):
// ch10/letspanic/letspanic.c
static int myglobalstate = 0xeee;
static int __init letspanic_init(void)
{ pr_warn("Hello, panic world
"); panic("whoa, a kernel panic! myglobalstate = 0x%x", myglobalstate);
return 0; /* success */
}
module_init(letspanic_init);
There's no need for a cleanup handler in this module, so we don't register one. Great, I build and insmod it on my trusty x86_64 Ubuntu 20.04 LTS (which I've logged into over ssh) running our custom production 5.10.60-prod01 kernel:
$ sudo insmod ./letspanic.ko
[... <panicked, and hung> ... ]
Immediately upon insmod, the system simply hung; no printks appeared on the console (on which I had SSHed in), nor on the graphical VirtualBox interface! It has obviously panicked, yes, but in order to debug why, we need to – at the very least – be able to see the details emitted by the kernel code within the panic code path. You'll very soon see what details it prints (hint – it's much like the details seen in a kernel Oops diagnostic, which we covered in depth in Chapter 7, Oops! Interpreting the Kernel Bug Diagnostic). So, what do we do now? The short answer – we use netconsole! Before that though, let's quickly mention the kernel's SysRq feature.
Creating a panic via the command line
There's an alternate easy non-programming way to generate a kernel panic – we take advantage of the kernel's Magic SysRq facility and the kernel.panic_on_oops sysctl, like so (as root):
echo 1 > /proc/sys/kernel/panic_on_oops
echo 1 > /proc/sys/kernel/sysrq
echo c > /proc/sysrq-trigger
It's simple – the first command sets up the kernel to panic on an Oops. The second command is to play safe and enable the kernel's Magic SysRq features (in case it isn't already enabled – for security, perhaps). The third command has the kernel's Magic SysRq feature trigger a crash!
What's this Magic SysRq thingy anyway?
In a nutshell, the kernel Magic SysRq facility is a keyboard-enabled hotkey interface allowing users (typically the sysad or developer) to force the kernel to take certain code paths. These effectively become similar to backdoors into the kernel, useful for debugging system hangs and such.
It must first be enabled (CONFIG_MAGIC_SYSRQ=y). For security, it can be turned off or tuned to allow only certain functionality; to do so, as root, do the following:
- To turn it off, write 0 into the /proc/sys/kernel/sysrq pseudofile.
- To enable all features, write 1 into it.
- A combination via a bitmask can be written as well.
The default value of the bitmask is the value of the kernel config CONFIG_MAGIC_SYSRQ_DEFAULT_ENABLE (typically, 1).
It allows you to do pretty radical things – force a crash (c), a cold reboot (b), a power off (o), forcibly invoke the Out Of Memory (OOM)-killer (f), force an emergency sync (s), unmount all filesystems (u), and so on. It can really help with debugging – it allows you to see all active task backtraces on all CPU cores (l), show CPU registers (p), show kernel timers (q), show blocked tasks (w), dump all ftrace buffers (z), and so on. The letter in parentheses is the one to use for that functionality. It can be used in two ways:
- Interactively, by pressing the particular key combination for your system (on x86, it's Alt + SysRq + <letter>; note that on some keyboards, the SysRq key is the same as the Prt Sc key).
- Non-interactively, by echoing the letter to the /proc/sysrq-trigger pseudofile (see the simple demo in the following figure). Echoing the ? letter results in a help screen of sorts being written via the kernel printk:

Figure 10.1 – A screenshot showing how the kernel Magic SysRq feature can be enabled and queried
The official kernel documentation can be found here: Linux Magic System Request Key Hacks: https://www.kernel.org/doc/html/latest/admin-guide/sysrq.html#linux-magic-system-request-key-hacks. It's comprehensive, so do check it out!
Magic SysRq and the kernel panic_on_oops sysctl does indeed let us panic the kernel, but we'd like to do so in code, via a module. Hence, we did so previously (a demo of doing it this way, via kernel panic_on_oops and Magic SysRq, is shown in the Trying it out – our custom panic handler module section).
To the rescue with netconsole
Hopefully you recall that the kernel netconsole code (often deployed as a module) transmits all kernel printks over the network to a receiver system (both source and destination being specified via the usual IP:port# style addresses). We won't repeat the how-to part of it, as we already covered how to use netconsole in Chapter 7, Oops! Interpreting the Kernel Bug Diagnostic in the An oops on an ARM Linux system and using netconsole section.
So, I set up my VM (where I am running our letspanic module) as the sender (of course, I need to have netconsole configured here, and it is) and my host system (a native x86_64 Ubuntu system) as the receiver. For your convenience, when loading the netconsole driver as a module, this is the format of the key parameter, named netconsole:
netconsole=[+][src-port]@[src-ip]/[<dev>],[tgt-port]@<tgt-ip>/[tgt-macaddr]
Here's the very brief setup detail (we leave the source and destination ports to their default values):
- Sender: an x86_64 Ubuntu 20.04 LTS VM running our custom 5.10.60-prod01 kernel (type this on one line):
sudo modprobe netconsole [email protected]/enp0s8,@192.168.1.101/
- Receiver: a native x86_64 Ubuntu 20.04 LTS system running the standard Ubuntu kernel:
netcat -d -u -l 6666 | tee -a klog_from_vm.txt
Of course, these are IP addresses and network interface names I encountered. Please replace them appropriately on your system. The netcat process blocks on receiving the incoming packets from the sender system and displays them (also writing them into the log file over tee). Here's a screenshot that clearly shows their interplay:

Figure 10.2 – A screenshot showing the receiver window on top (netcat receiving the kernel printks) from the sender system (below), which has insmoded our letspanic module
This is fantastic! Now, we can clearly see the kernel printks emitted by the panic handler routine deep within the kernel.
Interpreting the panic output
As already mentioned, interpreting it is easy, as it pretty much follows the Oops diagnostic output format. Following along with Figure 10.2, you can see the dreaded Kernel panic - not syncing message at the very top, followed by our message – the parameter to panic() – which is sent out at the KERN_EMERG printk log level, the highest possible (remember that this will cause the panic message to be immediately broadcast on all console devices). Thus, the line looks like this:
Kernel panic - not syncing: whoa, a kernel panic! myglobalstate = 0xeee
This is followed by the usual stuff:
- The process context (here, it's insmod, of course), the tainted flags, and the kernel version.
- A hardware detail line.
- If enabled (if CONFIG_DEBUG_BUGVERBOSE is on, it typically is), display the call stack (via the kernel's dump_stack() routine). This, of course, becomes one of the big clues as to how we got here, how we panicked – reading the kernel-mode stack in a bottom-up fashion shows us how we got here (as usual, ignore call frames prefixed with a ? symbol).
- This is followed by the instruction pointer (RIP) value, and both the machine code on the processor and the CPU register values at this point in time.
- In kernels from 3.14 onward that use the Kernel Address Space Layout Randomization (KASLR) feature as a security measure, the kernel offset is displayed (via an arch-specific function, dump_kernel_offset(), which, very interestingly, is invoked via something called the chain notifier mechanism, which we'll delve into in the following main section).
- The panic is capped with an end message, pretty much the same as the start one:
---[ end Kernel panic - not syncing: whoa, a kernel panic! myglobalstate = 0xeee ]---
Remember that we covered the detailed interpretation of the first four preceding bullet points in Chapter 7, Oops! Interpreting the Kernel Bug Diagnostic, in the Devil in the details – decoding the oops section.
So, where exactly within the kernel code does the sinister Kernel panic - not syncing:... message come from? Here's the beginning portion of the panic() code on the 5.10.60 kernel (https://elixir.bootlin.com/linux/v5.10.60/source/kernel/panic.c#L177):
void panic(const char *fmt, ...)
{static char buf[1024];
va_list args;
[...]
    pr_emerg("Kernel panic - not syncing: %s
", buf);
[...]
}
It's an exported function, so it's callable by modules. Also, quite clearly, after performing some tasks (not shown here) early on, it emits an emergency log-level (KERN_EMERG) printk message to the kernel logs and console device(s) (if configured), proclaiming the fact that the kernel has panicked! It appends any message passed to it, then performs what cleanup it can, and dumps useful system state information to all registered console devices (as we just saw).
Why Is the Phrase "not syncing" in the Kernel Panic Message?
The not syncing phrase means precisely that – buffers containing device data are deliberately not flushed – or synchronized (synced) – to disk (or flash, or whatever). This action, if performed, can actually make a bad situation worse, even corrupting data; thus, it's avoided.
You've realized that the system is now in an undefined unstable state; thus, the panic code does what it can with the ever-present possibility of an inadvertent complete lockup or failure. Again, this is why we can only do the bare minimum. Pretty much the entire kernel panic code path is run on a single CPU core. Again, this is to avoid complexity and possible deadlocks; in a similar fashion, local interrupts are disabled and kernel preemption is turned off (the code has pretty detailed comments – take a look).
When possible – and especially when the CONFIG_DEBUG_BUGVERBOSE config is on – the panic function tries to emit as much relevant system information as possible (as we saw – refer to Figure 10.2 and the related notes). To this end, a function named panic_print_sys_info() is invoked; it uses a bitmask (which you can set via the panic_print kernel parameter) to determine and show more system information – things such as all tasks info, memory, timer, lock, ftrace info, and all kernel printks. However, the default value of the bitmask is 0, implying that it doesn't show any of these. This extra information could indeed prove very useful; in the following section, we show how to set this bitmask.
Within panic(), once this critical info dump is done, the last thing the function does is loop infinitely on the single enabled processor core; within this loop, it resets the Non-Maskable Interrupt (NMI) watchdog (as interrupts are now disabled) and then periodically invokes an arch-dependent function called panic_blink(). On the x86, if enabled, this hooks into the keyboard/mouse driver here – drivers/input/serio/i8042.c:i8042_panic_blink(). This code causes the keyboard LEDs to blink, alerting a user running a GUI (such as X) to realize that the system isn't just soft hung but panicked. Here's the last code paragraph in the kernel panic() function, just after the end message:
    pr_emerg("---[ end Kernel panic - not syncing: %s ]---
", buf);
/* Do not scroll important messages printed above */
suppress_printk = 1;
local_irq_enable();
for (i = 0; ; i += PANIC_TIMER_STEP) {touch_softlockup_watchdog();
if (i >= i_next) {i += panic_blink(state ^= 1);
i_next = i + 3600 / PANIC_BLINK_SPD;
}
mdelay(PANIC_TIMER_STEP);
}
This, again, is completely deliberate – we want to ensure that the critical and precious debug info printed on the console(s) doesn't simply scroll away and disappear from view (as, of course, you can't scroll up, down, or do anything; the system is effectively dead now).
More Ways to Collect Panic Messages
Many Android devices make use of the Linux kernel's upstream pstore and ramoops support to enable you to collect the kernel log on a kernel panic. Of course, this implies a system containing persistent RAM and/or block devices that the pstore abstraction layer can use. Thus, pstore and ramoops can be viewed as being somewhat analogous to kexec/kdump in terms of being able to collect system information upon a kernel crash or panic and store it for later retrieval and analysis.
Also, the Intelligent Platform Management Interface (IPMI) is a standardized way to monitor and control a system's sensors. It includes panic and watchdog tuning. See the Further reading section for more links on all these.
Hang on, though – the panic code can take other code paths from what we saw just previously:
- When the kernel kexec/kdump feature is enabled, and the kernel has panicked or Oops'ed, to warm-boot into a secondary so-called dump-capture kernel (thus allowing the content of the kernel RAM to be saved to a snapshot and examined later!). In other words, the panic() function is a trigger point for invoking this functionality, which will (ultimately) invoke the kexec facility within the kernel to warm-boot the system into the dump-capture kernel (we'll briefly talk about this in the book's last chapter).
- When a custom panic handler is installed via the panic notifier chain mechanism, it gets called in addition to the regular panic handling code. Interesting! We will cover how you can do just this in the section that follows.
When the panic=n kernel parameter is set, it implies a panic timeout and reboot (more on this follows). Right, now that we can interpret the kernel's panic diagnostic, let's move along.
Kernel parameters, tunables, and configs that affect kernel panic
Here, we present in a convenient summary format a few kernel parameters (passed via the bootloader) as well as some possible sysctl tunables and kernel config macros that affect the kernel panic code path (a few more regarding lockups and hung tasks will be covered in an upcoming section):

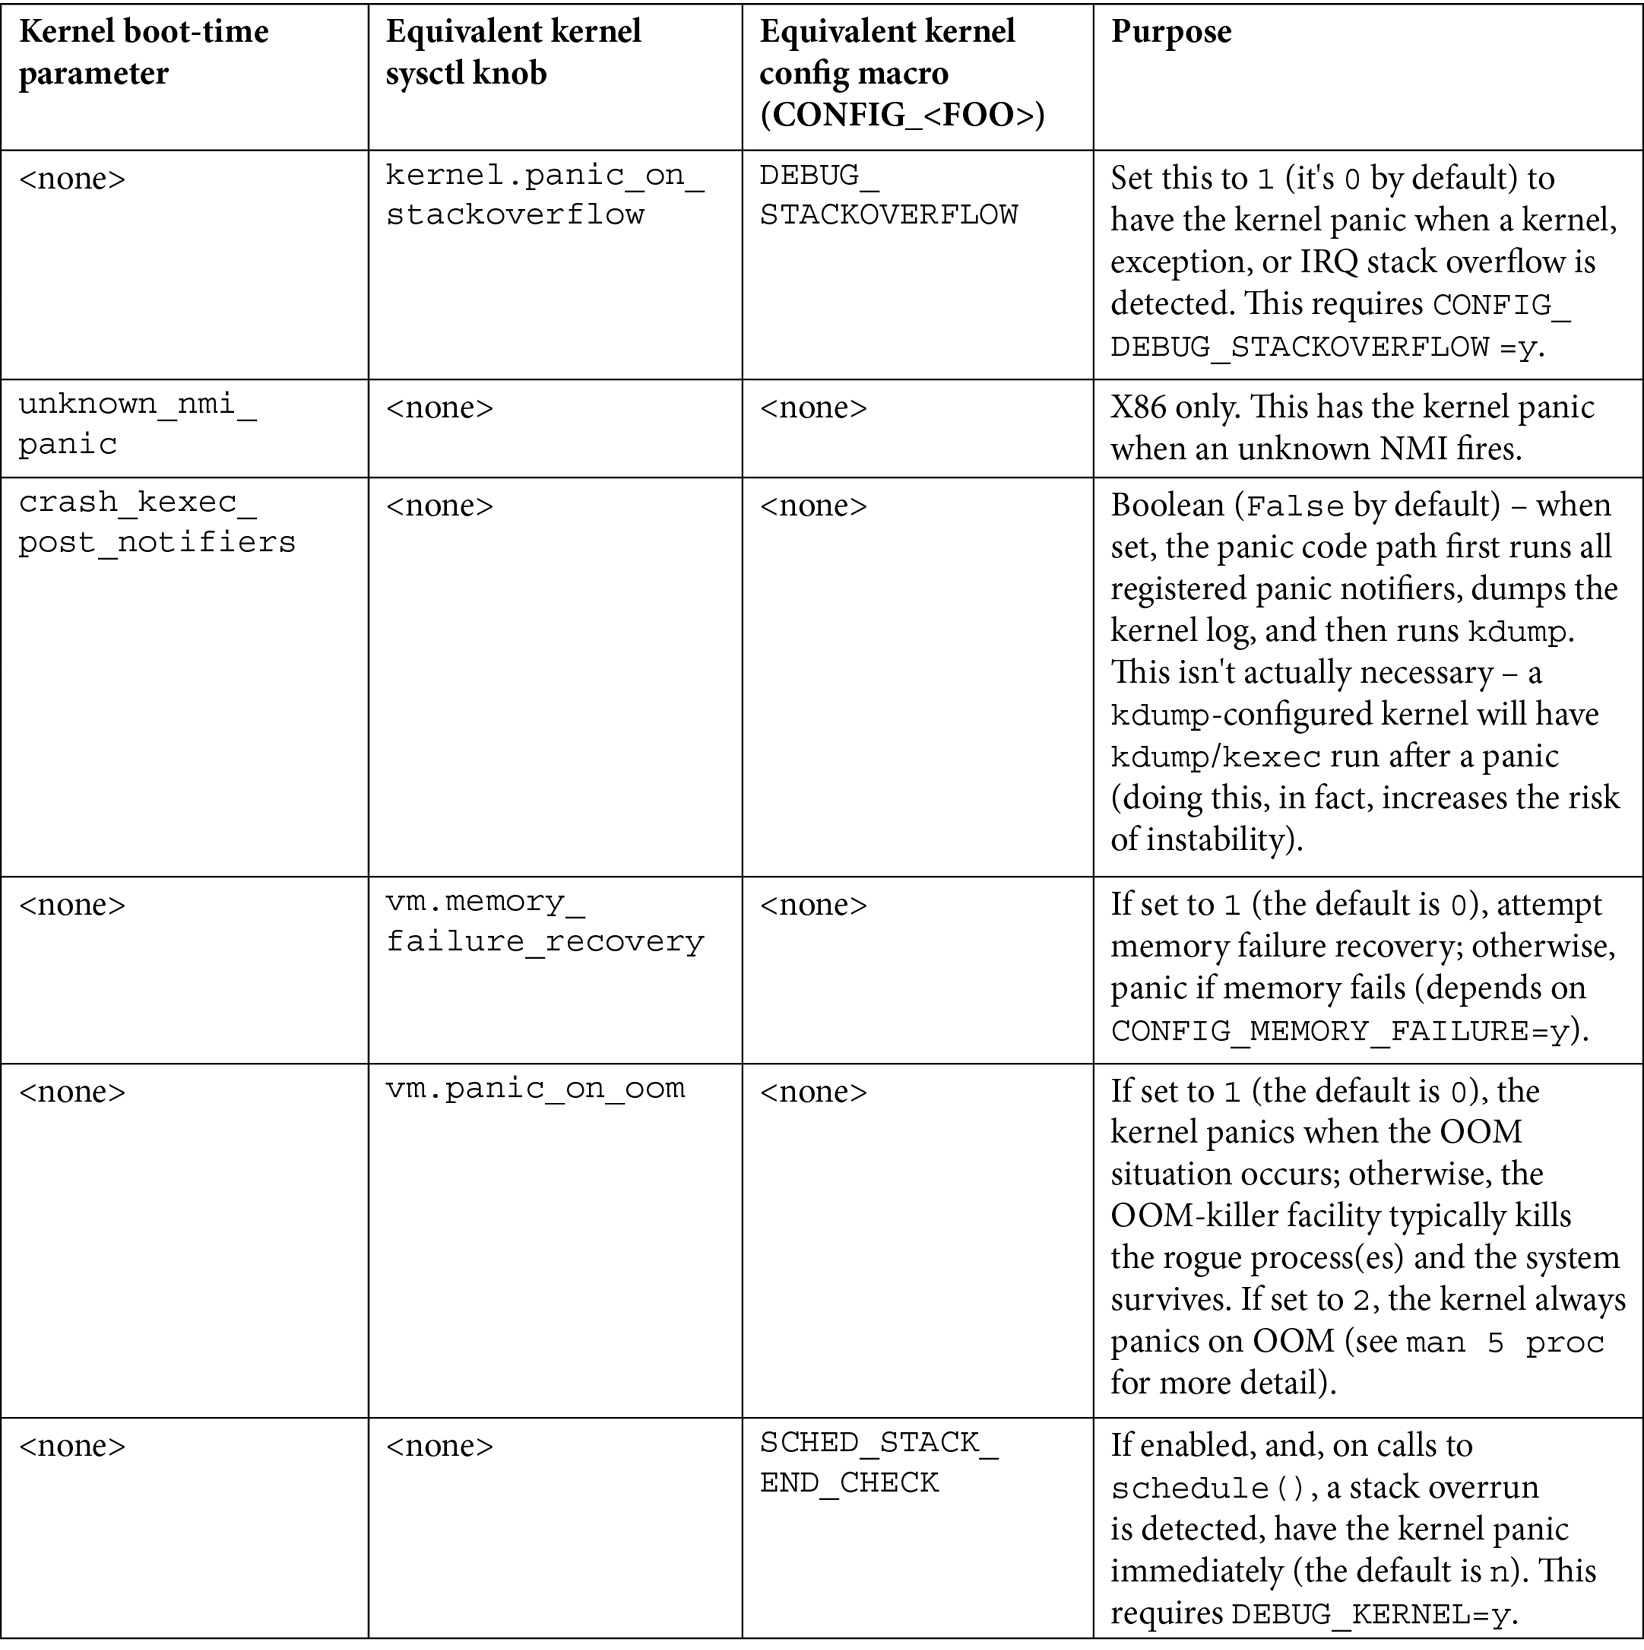
Table 10.1 – A summary table of the kernel parameters, sysctl tuning knobs, and config macros related to kernel panic handling
For sysctl knobs, the kernel.foo syntax implies that you'll find the tuning pseudofile, foo, in the /proc/sys/kernel directory.
The interpretation of the bits within the panic_print kernel parameter's bitmask (mentioned previously) is as follows:

Table 10.2 – Use the panic_print kernel parameter to set bits to get additional system info on kernel panic
The default value of the panic_print bitmask is 0, implying that no additional system info is printed during panic. Set the bits appropriately to display whatever details you'd like. So, for example, to show all the preceding details, we append panic_print=0x3f to the kernel parameter list when booting. Depending on your project, these additional details can prove very useful when debugging a kernel panic!
FYI, the official kernel documentation very clearly documents all kernel sysctl knobs (tunables) here: https://www.kernel.org/doc/html/latest/admin-guide/sysctl/kernel.html.
Exercise
Pass the panic_print=n kernel parameter setting n to an appropriate value (see Table 10.2). Then, run the letsdebug kernel module. The kernel will panic. Verify that you get (perhaps via netconsole) the additional system information details you requested via the panic_print bitmask.
All right, now that you understand what happens within the kernel on panic, let's move on to doing our own thing if and when it occurs.
Writing a custom kernel panic handler routine
The Linux kernel has a powerful feature named notifier chains (the word chains implying the usage of linked lists). It's essentially based upon a publish-and-subscribe model. The subscriber is the component that wants to know when a given asynchronous event occurs; the publisher is the one that pushes the notification that the event did occur. Quite obviously, the subscriber(s) register interest in a given event and supply a callback function. When the event occurs, the notification mechanism invokes the callback. When someone registers itself with a notifier chain, they have subscribed to it and specified a callback function. When the relevant event occurs, all subscribers' callback functions for that notifier chain are invoked (there's even a way to specify your priority and pass some data along, which we'll get to soon enough). We shall make use of one of the kernel's predefined notifier chains – the panic notifier chain – to register our custom panic handler.
Linux kernel panic notifier chains – the basics
First, though, we should understand some basics regarding the notifier chains. The Linux kernel supports four different types. The classification is based on the context in which the callback function executes (process or interrupt) and, thus, whether it can be blocking in nature or not (atomic). These are the four types of notifier chains:
- Atomic: Chain callbacks run in atomic context and cannot block (internally uses a spinlock for critical region protection).
- Blocking: Chain callbacks run in process context and can block (internally uses a read-write semaphore locking primitive to implement blocking behavior).
- Sleepable RCU (SRCU): Chain callbacks run in process context and can block (internally uses the more sophisticated Read-Copy-Update (RCU) mechanism to implement lock-free semantics; here, the read-side critical section can block/sleep). This type is good for cases where the callbacks occur often and the removal of the notifier block is rare.
- Raw: Chain callbacks can run in any context, and may or may not block. No restrictions are enforced. It's all left to the caller, who must provide locking/protection as required.
The include/linux/notifier.h header contains very useful comments regarding notifier chain types and more. Do check it out. For example, it mentions current (and potential future) users of this powerful mechanism. I can't resist showing you via a screenshot taken from here: https://elixir.bootlin.com/linux/v5.10.60/source/include/linux/notifier.h:

Figure 10.3 – A partial screenshot of the notifier.h header, showing the current and potential users of the notifier chains mechanism
Users (subscribers) are expected to use the registration APIs provided to register and, when done, unregister (although there are restrictions on when you can unregister in some cases – see the notifier.h header). For example, a network driver can elect to subscribe to the netdevice notifier chain in order to be notified whenever interesting events on a network device occur (stuff such as the network device coming up or going down, changing its name, and so on). You can see available netdevice events within the enum here: include/linux/netdevice.h:netdev_cmd. For example, the netconsole driver uses this facility to be notified of netdevice events. This is its netdevice chain callback function: drivers/net/netconsole.c:netconsole_netdev_event(). Another interesting use case of notifier chains is the reboot notifier chain (set up via the register_reboot_notifier() function). It can be used, for example, to properly shut down a Direct Memory Access (DMA) operation when an unexpected reboot occurs.
We don't propose covering more on the internals or other uses of notifier chains, instead choosing to focus on what matters here – setting up our own panic handler via this mechanism. Do refer to links within the Further reading section for more on notifier chains in general. Now, let's get on to the key part of this section.
Setting up our custom panic handler within a module
We will get hands-on here, first understanding the relevant data structures and APIs, and then writing and running module code to set up our very own custom kernel panic handler!
Understanding the atomic notifier chain APIs and the notifier_block structure
We will develop a kernel module that will employ the kernel's predefined panic notifier chain, named panic_notifier_list, in order to hook into the kernel panic. It's declared here:
// kernel/panic.c
ATOMIC_NOTIFIER_HEAD(panic_notifier_list);
EXPORT_SYMBOL(panic_notifier_list);
Clearly, it belongs to the atomic variety of notifier chains, implying that our callback cannot block in any manner.
Registering with an atomic notifier chain
To hook into it, we must register with it. This is achieved via the API:
int atomic_notifier_chain_register(struct atomic_notifier_head *, struct notifier_block *);
It's actually a simple wrapper over the generic notifier_chain_register() API, which it invokes within a spin_lock_irqsave()/spin_unlock_irqrestore() pair of locking primitives. The first parameter to atomic_notifier_chain_register() specifies the notifier chain you want to register with – in our case, we'll specify it as panic_notifier_list – and the second parameter is a pointer to a notifier_block structure.
Understanding the notifier_block data structure and the callback handler
The notifier_block structure is the centerpiece structure of the notifier chain framework. It's defined as follows:
// include/linux/notifier.h
struct notifier_block {notifier_fn_t notifier_call;
struct notifier_block __rcu *next;
int priority;
};
The first member is the really key one, a function pointer. It's the callback function, the function that will be invoked via the framework when the asynchronous event occurs! Here's its signature:
typedef int (*notifier_fn_t)(struct notifier_block *nb, unsigned long action, void *data);
Thus, the parameters you'll receive in the callback handler are as follows:
- struct notifier_block *nb: The pointer to the same notifier_block data structure used to set up the notifier.
- unsigned long action: This is actually a value specifying how or why we got here, a clue as to what caused the kernel panic. It's an enum named die_val and is arch-specific:
// arch/x86/include/asm/kdebug.h
enum die_val {
DIE_OOPS = 1,
DIE_INT3, DIE_DEBUG, DIE_PANIC, DIE_NMI,
DIE_DIE, DIE_KERNELDEBUG, DIE_TRAP, DIE_GPF,
DIE_CALL, DIE_PAGE_FAULT, DIE_NMIUNKNOWN,
};
Note that most driver authors, in their callback handler, seem to name this parameter either val or event. (Also note that the INT 3 software interrupt is the classic breakpoint instruction on the x86.)
- void *data: This is actually an interesting structure, struct die_args, passed via a pointer here. Here's its definition:
// include/linux/kdebug.h
struct die_args {
struct pt_regs *regs;
const char *str;
long err;
int trapnr;
int signr;
};
Among its members is the string passed to the panic() function, which is usually what the data parameter evaluates to. You can look up its definition in include/linux/kdebug.h and its setup via the notifier framework here: kernel/notifier.c:notify_die(). Example usage of this structure within a panic callback is within this Hyper-V driver from Microsoft: drivers/hv/vmbus_drv.c:hyperv_die_event(). It retrieves the CPU registers (via the familiar struct pt_regs *) from here, and employs the previous action parameter (it names it val) to verify that it's in the panic handler due to an Oops.
Let's get back to the notifier_block data structure. The second member is the usual next pointer to the next node in the notifier chain. Leaving it as NULL has the kernel notifier framework handle it appropriately.
The third and final member, priority, is clearly a prioritization. Setting it to INT_MAX informs the framework to invoke your callback as early as possible. We usually leave it undefined, though. Note that the kernel uprobes framework sets the priority of its exception notifier callback to INT_MAX-1:
// kernel/events/uprobes.c
static struct notifier_block uprobe_exception_nb = {.notifier_call = arch_uprobe_exception_notify,
.priority = INT_MAX-1, /* notified after kprobes, kgdb */
};
Note though that uprobes registers to the kernel die chain (via the register_die_notifier() API) – an interesting notifier chain, where callbacks are invoked when a CPU exception occurs in kernel mode. This can be another useful way to get relevant details when your system receives unexpected CPU exceptions in kernel mode!
Finally, after your callback function – the subscriber – performs its work, it returns a specific value, indicating whether all is well or not. These are the possible return values (you must use one of them):
- NOTIFY_OK: The handler is done – notification correctly handled. This is the typical one to return when all goes well.
- NOTIFY_DONE: The handler is done – don't want any further notifications.
- NOTIFY_STOP: The handler is done – stop any further callbacks.
- NOTIFY_BAD: The handler signals that something went wrong – don't want any further notifications (the kernel mentions this as being considered a bad/veto action).
Of course, you have to pair the notifier chain registration with a corresponding unregister. This is the API to use:
int atomic_notifier_chain_unregister(struct atomic_notifier_head *nh, struct notifier_block *n);
For a kernel panic, it won't be invoked. As good coding practice, we do this for our panic handler in the module cleanup method.
Our custom panic handler module – viewing the code
So, here it is – the relevant code from our custom kernel panic handler module! (Do browse through the complete code from the book's GitHub repo.) Let's begin by seeing the registration of the custom handler with the kernel panic notifier list in the module's init method:
// ch10/panic_notifier/panic_notifier_lkm.c
/* The atomic_notifier_chain_[un]register() api's are GPL-exported! */
MODULE_LICENSE("Dual MIT/GPL"); [...]static struct notifier_block mypanic_nb = { .notifier_call = mypanic_handler,
/* .priority = INT_MAX */
};
static int __init panic_notifier_lkm_init(void)
{atomic_notifier_chain_register(&panic_notifier_list, &mypanic_nb);
Next, we have the actual panic handler routine(s):
/* Do what's required here for the product/project,
* but keep it simple. Left essentially empty here.. */
static void dev_ring_alarm(void)
{ pr_emerg("!!! ALARM !!!
");}
static int mypanic_handler(struct notifier_block *nb, unsigned long val, void *data)
{ pr_emerg("
************ Panic : SOUNDING ALARM ************
val = %lu
data(str) = "%s"
", val, (char *)data);
dev_ring_alarm();
return NOTIFY_OK;
}
Do note the following:
- Our custom panic handler emits a printk at KERN_EMERG, ensuring as much as possible that it's seen.
- The data parameter evaluates to the message passed to the panic() function. In this case, as we trigger the panic via it, it's the SysRq crash triggering the code's message (sysrq triggered crash).
- We call a dev_ring_alarm() function. Note that it's simply a dummy placeholder – in your actual project or product, do what's (minimally) required here. For example, an embedded device controlling a laser on a factory floor might want to switch off the laser end and sound a physical alarm of some sort to indicate that the system is unusable, or whatever makes sense, constrained by the key fact that the system is in an unstable precarious state!
- We return NOTIFY_OK, signaling that all is well (as can be).
Okay, let's just do it!
Trying it out – our custom panic handler module
We have a simple script to trigger an oops – via the kernel Magic SysRq c option – and set the kernel.oops_on_panic to 1 to convert this Oops into a kernel panic! Here's the script:
$ cat ../cause_oops_panic.sh
sudo sh -c "echo 1 > /proc/sys/kernel/panic_on_oops"
sudo sh -c "echo 1 > /proc/sys/kernel/sysrq"
sync; sleep .5
sudo sh -c "echo c > /proc/sysrq-trigger"
$
Careful, though – don't run it until you've set up netconsole (to capture kernel printks from this system onto a receiver system). For this too, we employ a simple wrapper script, ch10/netcon (I'll leave you to browse through it). We run it first, passing the receiver system's IP address as a parameter. It sets up netconsole accordingly:
$ ../netcon 192.168.1.8
[...]
You can see the dmesg output regarding netconsole in the following screenshot:

Figure 10.4 – A screenshot showing the guest VM where netconsole is set up
Also, do ensure that you're running netcat on the receiver system (in the usual manner; I use netcat -d -u -l 6666).
Once triggered via our ../cause_panic_oops.sh script, the kernel panic causes our custom panic handler – registered to the panic notifier list – to be invoked. The netcat utility spews out the remote kernel printks on panic:

Figure 10.5 – A partial screenshot – the host, where netcat receives and prints to stdout the kernel printks from the guest VM's kernel panic; note the output from our custom panic handler!
Clearly, you can see (Figure 10.5) that this time, as we used the Magic SysRq crash triggering feature, this is what is reflected in the kernel panic message and the kernel stack backtrace. The interesting thing, though, highlighted toward the bottom of Figure 10.5, is the output from our custom panic handler – it's clearly visible! – followed by the capped end message (---[ end Kernel panic - ... ]---) from the kernel.
Again, a reminder – be careful what you do within your panic handler routine. Keep it to a bare minimum and test it. This kernel comment emphasizes the point:
// kernel/panic.c:panic()
* Note: since some panic_notifiers can make crashed kernel
* more unstable, it can increase risks of the kdump failure too.
The kernel tree has several instances of the panic notifier chain being employed (mostly by various drivers and watchdogs). As a quick experiment, I used cscope to search for the atomic_notifier_chain_register(&panic_notifier_list string, within the 5.10.60 kernel source tree. This partial screenshot shows that it obtained 29 matches (with the left column revealing the source filename):
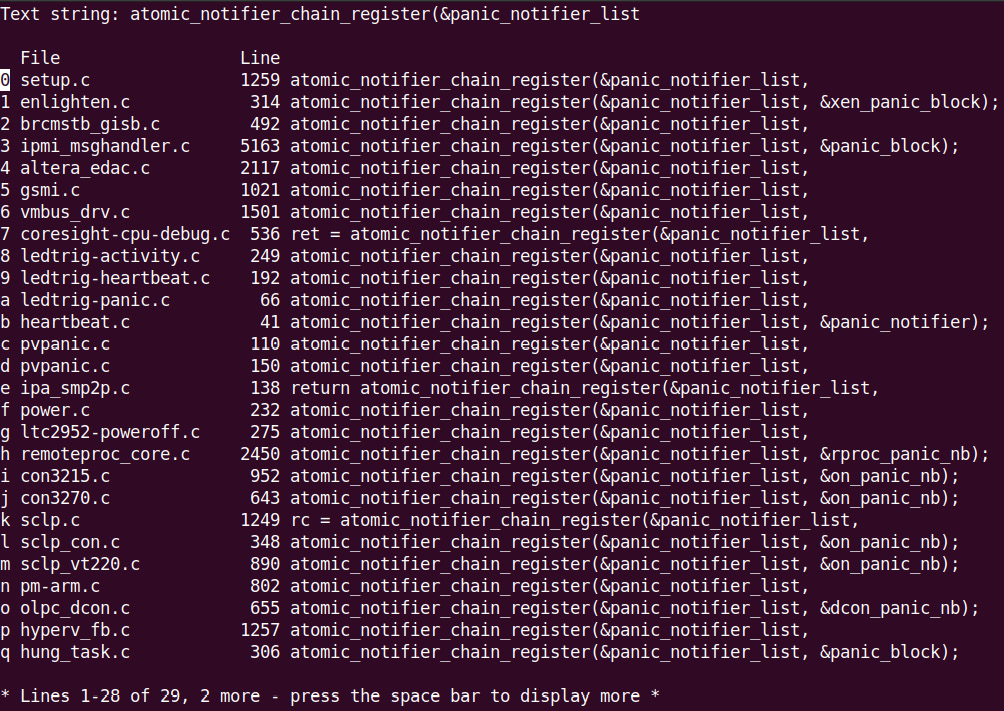
Figure 10.6 – A partial screenshot showing various users of the panic notifier chain within the kernel
Now, armed with your custom kernel panic handler, let's tackle how we detect lockups within the kernel!
Detecting lockups and CPU stalls in the kernel
The meaning of lockup is obvious. The system, and one or more CPU cores, remain in an unresponsive state for a significant period of time. In this section, we'll first briefly learn about watchdogs and move on to learn how to leverage the kernel to detect both hard and soft lockups.
A short note on watchdogs
A watchdog or watchdog timer (WDT) is essentially a program that monitors a system's health and, on finding it lacking in some way, has the ability to reboot the system. Hardware watchdogs latch into the board circuitry and thus have the ability to reset the system when required. Their drivers tend to be very board-specific.
The Linux kernel provides a generic watchdog driver framework, allowing driver authors to fairly easily implement watchdog drivers for specific hardware watchdog chipsets. You can find the framework explained in some detail in the official kernel documentation here: The Linux WatchDog Timer Driver Core kernel API: https://www.kernel.org/doc/html/latest/watchdog/watchdog-kernel-api.html#the-linux-watchdog-timer-driver-core-kernel-api. As this isn't a book on writing Linux device drivers, we won't go into more detail.
There is a facility to employ a userspace watchdog daemon process as well. (On Ubuntu at least, the package and utility are simply named watchdog. You'll have to configure and run it.) Its job is to monitor various system parameters, perform the heartbeat ping functionality (typically, by writing something at least once a minute into the device file for the kernel watchdog driver, /dev/watchdog), and communicate with it using various predefined ioctls. The kernel documentation on this is here: The Linux Watchdog driver API: https://www.kernel.org/doc/html/latest/watchdog/watchdog-api.html#the-linux-watchdog-driver-api.
You can configure and tune several system parameters to values appropriate to your system. Details on the user mode watchdog daemon can be found in these man pages: watchdog(8) and watchdog.conf(5). These help configure the watchdog to trigger – and thus reboot the system – based on various system parameters (for example, setting a bare minimum number of free RAM pages, a maximum heartbeat interval between two writes to the device file, a process – specified by a PID file – that must always be alive, the maximum load allowed on the system, and system temperature thresholds). It's very interesting to peruse the man page; all parameters that can possibly be monitored are shown. Watchdog-based monitoring can indeed prove very useful for many types of products, especially ones that aren't human-interactive (remote servers, deeply embedded systems, many kinds of IoT edge devices, and so on).
We enable the software watchdog in our custom production kernel (CONFIG_SOFT_WATCHDOG=m; look for it and many available hardware watchdogs under Device Drivers | Watchdog Timer Support within the make menuconfig kernel UI). As we selected it as a module, it gets built, and the module is named, quite appropriately, softdog. Do note though that being a pure software watchdog, it may not reboot the system in some situations. (If interested, look up the official kernel documentation on the various module control parameters you can specify for the softdog software watchdog, as well as known hardware ones, in the kernel here: WatchDog Module Parameters: https://www.kernel.org/doc/html/latest/watchdog/watchdog-parameters.html#watchdog-module-parameters.)
Running the softdog watchdog and the user watchdog daemon
As an experiment, we will load the softdog software watchdog driver (all defaults) on my x86_64 Ubuntu VM and then (manually) run the watchdog service daemon in verbose mode (I did tweak a few parameters in its config file, /etc/watchdog.conf):
$ sudo modprobe softdog
$ sudo watchdog --verbose &
[...]
watchdog: String 'watchdog-device' found as '/dev/watchdog'
watchdog: Variable 'realtime' found as 'yes' = 1
watchdog: Integer 'priority' found = 1
[1]+ Done watchdog --verbose
Right, let's verify that it's running:
# ps -e | grep watch
111 ? 00:00:00 watchdogd
10106 ? 00:00:00 watchdog
The first line in the ps output is actually the watchdogd kernel thread. The second one is the software userspace watchdog daemon process we just ran. Here's some of the initial output from the user-mode watchdog daemon process:

Figure 10.7 – A partial screenshot showing the initial output from the watchdog daemon process when run in verbose mode
In a similar fashion, systemd-based systems can also perform watchdog monitoring (see the watchdog-related entries within /etc/systemd/system.conf). Also, it's important to note that while watchdogs are useful in production, they might need to be turned off during debug (for example, when running an interactive kernel debugger); otherwise, they might trigger and cause a system reboot. Okay, I'll leave it to you to explore further with this. Let's move on to learning about an interesting application of watchdogs – the kernel lockup detectors!
Employing the kernel's hard and soft lockup detector
Software (hardware too) isn't perfect. I am betting you've experienced a system that mysteriously hangs. The system probably isn't completely dead or panicked; it's simply hung and become unresponsive. This, in general, is termed a lockup. The Linux kernel has the ability to detect lockups, and we aim to examine this.
The reason I mentioned the watchdog (in the prior section) is that the Linux kernel leverages the NMI watchdog facility (as well as the perf subsystem) to detect both hard and soft lockups (we'll cover what these mean very soon). The kernel can be configured to detect both hard and soft lockups. The relevant menu (via the usual make menuconfig UI) is here: Kernel hacking | Debug Oops, Lockups and Hangs. Here's a screenshot of the same (on our custom 5.10.60 production kernel):

Figure 10.8 – A partial screenshot showing the kernel config UI for debugging Oops, lockups, and hangs
Glancing at the kernel config in Figure 10.8, you may wonder why, this being a so-called production kernel, we haven't enabled things such as panic on oops and panic on soft and hard lockup? Good question! I leave the panic options off as, although we claim that this is a production kernel, it isn't really in the sense that we use it throughout the book to demonstrate things. On an actual project or product, enabling them is definitely something to consider. Does the system need to be auto-rebooted in case it locks up, hangs, Oops'es, or panics? If yes, then enable the panic-on configs and pass the panic=n kernel parameter to have the system reboot n seconds after panicking.
The kernel config to detect both hard and soft lockups as well as hung tasks and workqueue stalls is indeed enabled. The relevant kernel config options, boot parameters, and kernel sysctl knobs are summarized in Table 10.3 (it may be useful to refer back to the table as you cover more of the material):

Table 10.3 – A summary of the watchdog settings affecting kernel hard/soft lockup detection
The settings on your box regarding the watchdog can be verified using the sysctl utility (note that nmi_watchdog refers to hard lockup and soft_watchdog to soft lockup detection, not to the softdog module):
$ sudo sysctl -a | grep watchdog
kernel.nmi_watchdog = 0
kernel.soft_watchdog = 1
kernel.watchdog = 1
kernel.watchdog_cpumask = 0-5
kernel.watchdog_thresh = 10
$
The nmi_watchdog value shows as 0 as there's no hardware watchdog chip available. soft_watchdog is always available (as is the kernel's built-in watchdog support). Let's get to what exactly all of this means!
What's a soft lockup bug?
A soft lockup is a bug wherein a task running in kernel mode remains in a tight loop or is somehow stuck to the processor, for a long time, not allowing other tasks to get scheduled on that core. The default timeout for a hard lockup is the value of the kernel.watchdog_thresh sysctl – it's 10 seconds by default – and that of a soft lockup is twice this (that is, 20 seconds). This, of course, is tunable (as root). Let's look up the value on my Ubuntu 20.04 LTS VM:
$ cat /proc/sys/kernel/watchdog_thresh
10
Thus, the actual soft lockup timeout value is 2*10 – 20 seconds. Writing an integer into the watchdog_thresh kernel sysctl modifies the threshold to that value (in seconds). Writing 0 disables checking.
When a soft lockup's detected, what happens?
Panic – if the softlockup_panic kernel (boot-time) parameter is set to 1, the kernel.softlockup_panic sysctl is 1, or if the kernel config is BOOTPARAM_SOFTLOCKUP_PANIC=1, then the kernel panics! The typical default is 0.
If the preceding isn't true – that is, the kernel doesn't panic on soft lockup – it emits a warning message to the kernel log, showing details of the hung task. The kernel stack trace is dumped as well (allowing us to see how it got to this point!)
It's important to note that in the latter case (where it doesn't panic), the buggy task continues to hang the affected CPU core.
Triggering a soft lockup on the x86_64
Can we trigger a soft lockup? Of course. Simply do something to wreak havoc on a poor CPU core, causing it to spin for a long while in kernel mode! As an example, I added a few lines of code to do just this to a kernel thread demo module, created for my earlier Linux Kernel Programming Part 2 book (the original code is here: https://github.com/PacktPublishing/Linux-Kernel-Programming-Part-2/tree/main/ch5/kthread_simple).
To save space, we just run the module with the (slightly) modified code. You can see the added buggy code (the full code is here: ch10/kthread_stuck) and the visible effect it has. After over 20 seconds, the kernel watchdog detects the soft lockup and jumps in, emitting a BUG() message! Running it with no module parameter specified has it use the default – the test for the soft lockup (we'll test the hard lockup shortly):

Figure 10.9 – A partial screenshot showing deliberately buggy CPU-intensive code to cause a soft lockup bug; see – at the bottom – the BUG() message at KERN_EMERG overwriting the console
In addition to the kernel watchdog's BUG: soft lockup ... message at KERN_EMERG, the watchdog also emits the usual diagnostics by invoking dump_stack() and related routines. (You'll see the modules in the kernel memory, the context info, the kernel status information, the hardware info, the CPU register dump, the machine code running on core, and – a key portion – in the kernel mode stack backtrace, the call stack.) Our useful convenient.h:PRINT_CTX() macro helps reveal the system state. Here's an example of output from it while the soft lockup was taking place:
002) [lkd/kt_stuck]:3530 | .N.1 /* simple_kthread() */
The .N.1 ftrace latency format-like string reveals that, as the first of these four columns is a period, it's running with hardware interrupts enabled. This is because, when we test the soft lockup, we invoke spin_lock() and not the IRQ-disabling spin_lock_irq() routine (along with their unlock counterpart, of course). Great!
Don't Forget the Spinlock!
A key point to remember is that we perform the CPU-intensive code path in a loop, around which we take a spinlock. Why? Remember that the spinlock, particularly the spin_lock_irq[save]() variants, besides having a loser context spin, while the lock owner runs the code of the critical section (here, the body of the while loop), also disables hardware interrupts. Disabling interrupts has the nice side effect of disabling kernel preemption; thus, the code runs pretty much guaranteed without preemption of any sort, not even by hardware interrupts! In other words, automatically.
For emulating a hard lockup, this is exactly what we want. But, then, think about this – how will the kernel watchdog detect it? Ah, that's because it traps into the NMI and checks for lockup in the NMI handler! And, of course, the NMI does preempt and interrupt the code, as it's by definition a non-maskable interrupt.
(Again, what we're doing here as an experiment is the exact opposite of what's recommended – keep the critical section within the spinlock as short as possible, as we discussed in Chapter 8, Lock Debugging, in the Identifying some locking defects from various blog articles and the like section. We do so here to deliberately cause a soft or hard lockup, as a learning exercise.)
If interested, you'll find the kernel code implementation of the soft lockup detection here: kernel/watchdog.c:watchdog_timer_fn().
Also, interestingly, attempting rmmod (without first sending the SIGINT or SIGQUIT signals to our kthread to have it die, as we've programmed it that way) in our buggy module can, in about 2 minutes, have the rmmod process detected as being a hung task! We will discuss hung task detection in the next major section of this chapter. Now, let's move on to the next type of lockup...
What's a hard lockup bug?
A hard lockup is a bug wherein a CPU core running in kernel mode remains in a tight loop, or somehow stuck, for a long time, not allowing other hardware interrupts to run on that core. As already mentioned, the default timeout for a hard lockup is the value of the kernel.watchdog_thresh kernel sysctl, set to 10 seconds by default. This, of course, is tunable (as root).
When a hard lockup's detected, what happens?
Panic – if the nmi_watchdog=1 kernel boot parameter (and if the system supports a hardware watchdog), the kernel.hardlockup_panic sysctl is set to 1, or the kernel config is BOOTPARAM_HARDLOCKUP_PANIC=y, then the kernel panics! The typical default is that panic is off.
If the preceding isn't true – that is, the kernel doesn't panic on hard lockup (default) – it emits a warning message to the kernel log, showing details of the system state. The kernel stack trace is dumped as well (allowing us to see how it got to this point). If the hardlockup_all_cpu_backtrace=1 kernel boot parameter is passed, the kernel generates a kernel stack backtrace on all CPUs.
It's important to note that in the latter case (where it doesn't panic), the buggy code continues to (hard) hang the affected CPU core.
There's more to this – the kernel RCU lock-free feature can result in CPU stalls as well.
RCU and RCU CPU stalls
The Linux kernel's Read-Copy-Update (RCU) infrastructure is a powerful way to perform lock-free work within the kernel. It's important to realize that, similar to hard lockup, warnings can occur due to RCU CPU stalls as well. The RCU_CPU_STALL_TIMEOUT kernel config determines the RCU grace period. On 5.10, it's 60 seconds by default, with a range of 3 to 300. If the RCU grace period exceeds the number of seconds specified by this config, a CPU RCU stall warning is emitted, with the possibility of more occurring when the problem persists. A very brief conceptual introduction to RCU follows, so do check it out.
Conceptually understanding RCU in a nutshell
The RCU implementation works by essentially having readers work upon shared data simultaneously without using locking, atomic operators, increments to a variable, or even (with the exception of the Alpha processor) memory barriers! Thus, in mostly read situations, performance remains high – the main benefit of using RCU. How does it work?
Imagine several readers (say, threads R1, R2, and R3) enter a section of code where they work upon shared data in parallel – an RCU read-side critical section. When a writer thread comes along, realizing it's an RCU critical section, the writer makes a copy of the data item being referenced and modifies it. The existing readers continue to work upon the original item. Then, the writer atomically updates the original pointer to refer to the new (just modified) data item (while R1, R2, and R3 continue to work upon the original one). The writer must then free (destroy) the original data item. This, of course, can't be done until all readers currently accessing it finish.
How will it know? The RCU implementation has the writer wait for all current readers to cycle off the CPU by checking when they yield the processor – that is, invoke the scheduler and thus move off the CPU core! Now, the writer allows a grace period (as long as a minute!) to elapse – allowing any sluggish readers to complete – and then destroys (frees) the original data item, and all is well. (Note that in an uncommon case, that of parallel RCU writers, they can avoid stepping on each others toes by using some sort of locking primitive, typically spinlocks.)
The official kernel documentation, Using RCU's CPU Stall Detector (https://www.kernel.org/doc/html/latest/RCU/stallwarn.html#using-rcu-s-cpu-stall-detector), mentions the several causes that can result in an RCU CPU stall warning. Among them is looping on a CPU for a long while with interrupts, preemption, or bottom halves disabled (there are many more reasons; do look up the kernel documentation). That's why we got into RCU CPU stalls here. Among the conditions that make them occur is the one we're dealing with – disabling interrupts for a long while!
Triggering a hard lockup/RCU CPU stalls on a native x86_64
Can we trigger a hard lockup and/or an RCU CPU stall bug? Indeed we can, but even on an x86_64, there's at least a few pre-conditions:
- The hard lockup can only be detected by the NMI on a native x86_64, so you should be running Linux on one (a guest VM won't do).
- The NMI and the NMI watchdog must be enabled by adding the nmi_watchdog=1 string to your kernel boot parameter list.
- Explicitly enable the NMI watchdog in the kernel by writing 1 to the kernel.nmi_watchdog sysctl.
- The CONFIG_RCU_CPU_STALL_TIMEOUT kernel config should have a value in the range of 3 to 300 – the number of seconds after which an RCP CPU stall is deemed to have occurred.
Once these are satisfied, sysctl should reflect it:
# sysctl -a | grep watchdog
kernel.nmi_watchdog = 1
kernel.soft_watchdog = 1
kernel.watchdog = 1
kernel.watchdog_cpumask = 0-11
kernel.watchdog_thresh = 10
Additionally, on my system, I have CONFIG_RCU_STALL_COMMON=y and CONFIG_RCU_CPU_STALL_TIMEOUT=60.
To test for hard lockup/RCU CPU stalls, fire up our demo module (ch10/kthread_stuck), this time passing the lockup_type=2 module parameter. This parameter value has our kthread spin on the CPU in a tight loop while holding a spinlock with IRQs and preemption disabled (the spin_lock_irq() variant). After some time elapses, the kernel log should reveal the NMI interrupt (and indeed the NMI backtrace) having fired due to the hard lockup or RCU CPU stall bug our module causes.
It's entirely possible that the actual warning is due to the fact that RCU CPU stalls are detected (which happened when I tested it)! This is because the kernel's RCU stall detection code deems that an RCU CPU stall has occurred (among several other reasons) when code spins on a CPU core for a long while with interrupts, preemption, or bottom halves disabled. Our code does indeed spin for a long while with interrupts and preemption disabled (as we employ the IRQ/preempt-disabling version of the spinlock). The kernel log reveals the RCU stall being detected:
rcu: INFO: rcu_sched detected stalls on CPUs/tasks:
rcu: 3-...0: (1 GPs behind) idle=462/1/0x4000000000000000 softirq=60126/60127 fqs=6463
(detected by 2, t=15003 jiffies, g=127897, q=1345272)
Sending NMI from CPU 2 to CPUs 3:
NMI backtrace for cpu 3
CPU: 3 PID: 16351 Comm: lkd/kt_stuck Tainted: P W OEL 5.13.0-37-generic #42~20.04.1-Ubuntu
[...]
More information on interpreting the kernel's RCU stall warnings is documented in the official kernel documentation article on RCU CPU stall detection mentioned earlier. Also, the kernel.panic_on_rcu_stall kernel sysctl can be set to 1 to enable panic on the RCU stall. It's off by default. The kernel.panic_on_rcu_stall sysctl (available from 5.11 only) allows configuring the number of times the RCU stall must occur before the kernel panics.
To round off this topic, note the following:
- The kernel provides a much more sophisticated module to help test watchdogs, lockups, hangs, RCU CPU stalls, and more. Enable it by setting CONFIG_TEST_LOCKUP=m (or y). The module will be named test_lockup (its code is here: lib/test_lockup.c).
- Specifically for deep RCU testing, the kernel also has an RCU torture facility. The official kernel doc regarding it is here: https://www.kernel.org/doc/html/latest/RCU/torture.html#rcu-torture-test-operation.
- The official kernel documentation goes into details regarding the implementation of the hard/soft lockup detection: Softlockup detector and hardlockup detector (aka nmi_watchdog): https://www.kernel.org/doc/html/v5.10/admin-guide/lockup-watchdogs.html#implementation. Also, the kernel code implementing it is here: kernel/watchdog.c.
Check out this table summarizing the various boot parameters, kernel sysctl knobs, and kernel configs relevant to hard/soft lockup:
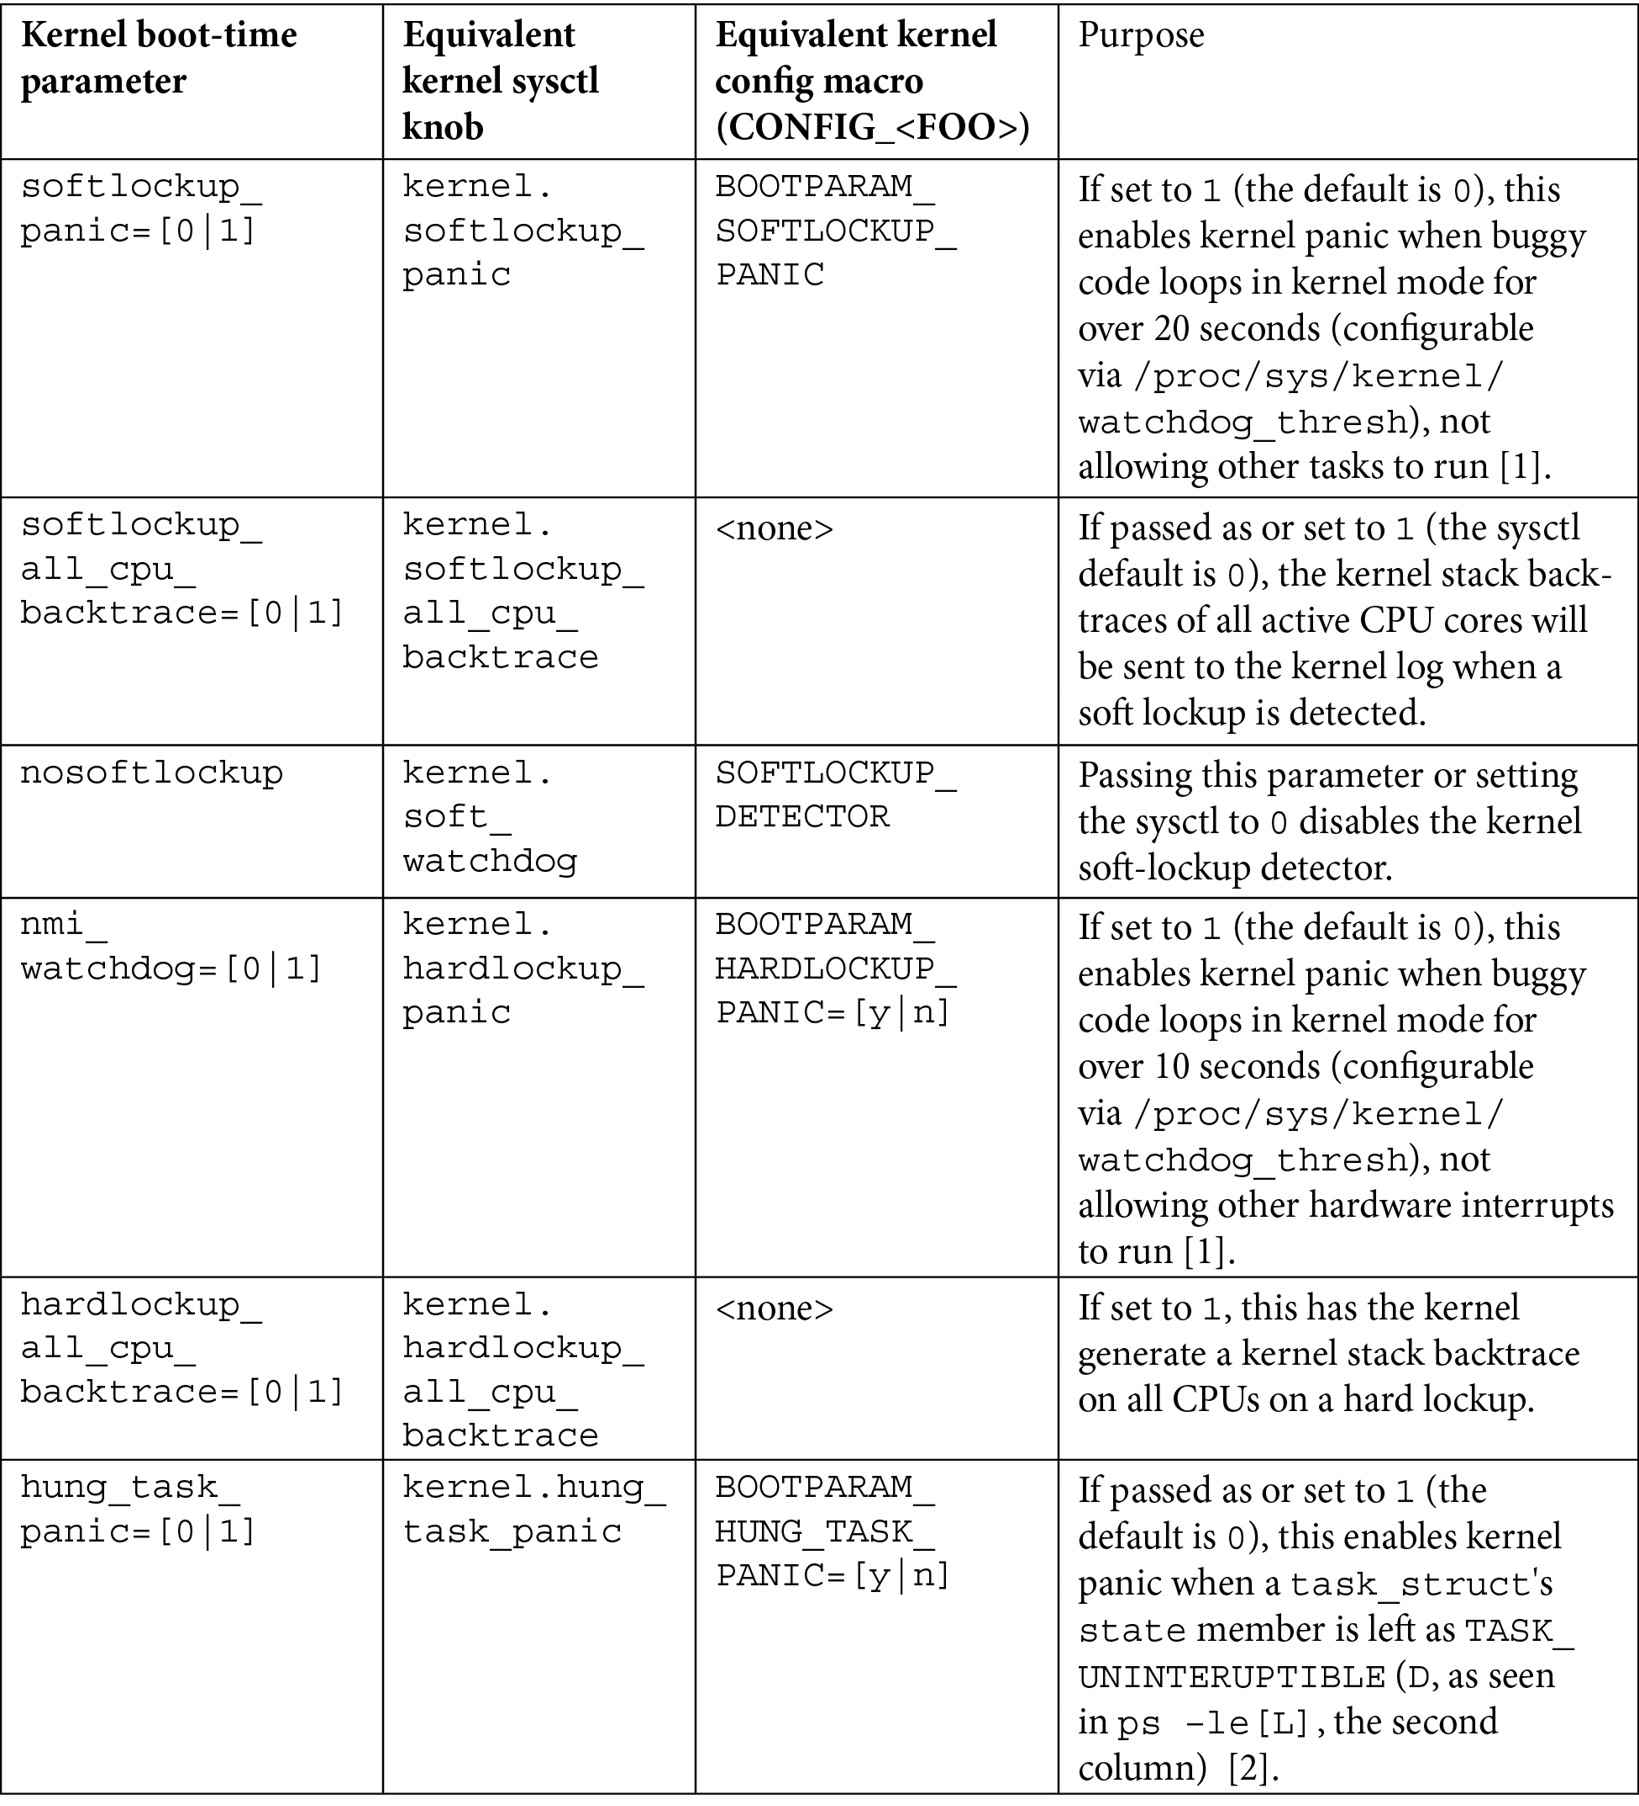
Table 10.4 – A summary of the boot parameters, kernel sysctl knobs, and kernel configs relevant to hard/soft lockup
Note the following citations in the table:
- [1] – For both the soft lockup and hung task cases, the kernel's config specifies the following:
// lib/Kconfig.debug
[...]
The panic can be used in combination with panic_timeout to cause the system to reboot automatically after a hung task has been detected. This feature is useful for high-availability systems that have uptime guarantees and where hung tasks must be resolved ASAP.
- [2] – A simple bit of bash magic can help us see all threads whose state is D – uninterruptible sleep (TASK_UNINTERRUPTIBLE):
ps –leL | awk '{printf("%s %s ", $2, $14)}' | grep "^D"
A side effect of watchdogs being able to reboot a system when necessary is, of course, the fact that, when debugging, you don't get a chance to capture key information before the reboot occurs. To this end, disabling watchdog(s) (and even RCU CPU stall detection) during debug might be a good idea. Some (x86/ARM-based) systems even provide pre-timeout notifications, enabling you to save key state information before reboot!
Practically speaking, there are a few things you can check. The nowatchdog kernel parameter turns off both the hardware NMI watchdog as well as soft-lockup functionality at boot. The kernel documentation on watchdog parameters gives insight into various options you can play with for real-world hardware watchdog drivers: https://www.kernel.org/doc/Documentation/watchdog/watchdog-parameters.rst.
Another possibly useful thing to keep in mind when working on a device driver is that the kernel typically provides callback mechanisms for power management events such as suspend and shutdown. Take advantage of them to perhaps save state info when a certain abnormal condition is detected, perform necessary tasks such as aborting a DMA transfer, and so on.
Great! Now, let's complete this chapter by learning how to leverage a kernel's hung task and workqueue stall detectors.
Employing the kernel's hung task and workqueue stall detectors
A hung task is one that's become unresponsive. Similarly, the kernel can also, on occasion, suffer from some types of stalls (workqueue and RCU). In this section, we will examine how we can leverage these features, allowing us to detect them so that an action – such as triggering a panic or emitting a warning with stack backtraces – can be taken. Obviously, the warnings logged can then help you, the developer, understand what occurred and work to fix it.
Leveraging the kernel hung task detector
Configuring the kernel via the usual make menuconfig UI, under the Kernel hacking | Debug Oops, Lockups and Hangs menu (refer to Figure 10.8), you'll find entries labeled as follows:
[*] Detect Hung Tasks
(120) Default timeout for hung task detection (in seconds)
[ ] Panic (Reboot) On Hung Tasks
These are what we discuss here. The whole idea, when enabled, is to allow the kernel to be able to detect tasks (processes and/or threads) that have become non-responsive and stuck in an uninterruptible sleep for a long while. The state of the task (within its task structure's state member) is named TASK_UNINTERRUPTIBLE, which implies that it can't be disturbed by any signal from userspace. As seen, the default timeout to consider it as hung is 120 seconds. This is tunable, of course, by either of the following:
- Changing the value of CONFIG_DEFAULT_HUNG_TASK_TIMEOUT (corresponding to the menu's second line shown previously).
- Modifying the value in the kernel.hung_task_timeout_secs sysctl. Setting it to 0 disables the check.
The CONFIG_DETECT_HUNG_TASK kernel config option is turned on for a debug kernel by default. It can be very useful in detecting hung non-responsive tasks even on production systems, as the overhead is considered minimal.
The third line in the menu seen previously corresponds to whether the kernel should panic when a hung task is detected. It's the CONFIG_BOOTPARAM_HUNG_TASK_PANIC config and is set to off by default. This behavior is also settable via the kernel.hung_task_panic sysctl.
Note that the detection of hung tasks is implemented by having a kernel thread, khungtaskd, continually scan for them.
We will round off this topic by showing the meaning of various kernel sysctl tunables relevant to hung task detection (all of which depend on CONFIG_DETECT_HUNG_TASK being enabled):
- hung_task_all_cpu_backtrace: If set to 1 (the default is 0), the kernel sends the NMI interrupt to all cores, triggering a stack backtrace when a hung task is detected. This requires CONFIG_DETECT_HUNG_TASK and CONFIG_SMP to be enabled.
- hung_task_check_count: The upper bound on the number of tasks checked. It can be useful to dampen this value on a resource-constrained (embedded) system. Interestingly, the value does tend to be arch-specific (on an ARM-32 compiled Raspberry Pi, for example, the value is 32,768, while on an x86_64, it's 4,194,304).
- hung_task_check_interval_secs: Typically, 0, implying that the timeout value for hung tasks is the kernel.hung_task_timeout_secs sysctl. If positive, then it overrides it and checks for hung tasks at this interval (seconds). The legal range is {0:LONG_MAX/HZ}.
- hung_task_timeout_secs: The essential hung task facility – when a task remains in an uninterruptible sleep (the D state, as seen by ps -l) for more than this amount of time (in seconds), it triggers a kernel warning (and possibly panic – see the following). The legal range is {0:LONG_MAX/HZ}.
- hung_task_panic: If set to 1 (the default is 0), the kernel panics when a hung task is detected. If 0, the task remains in the hung (D) state.
- hung_task_warnings: The maximum number of warnings to report (defaults to 10). Once a hung task is detected, it's decremented by 1. A value of -1 implies that infinite warnings can occur.
Here is an example of the same, looking up these (default) values on my x86_64 guest VM:
$ sudo sysctl -a|grep hung_task
kernel.hung_task_all_cpu_backtrace = 0
kernel.hung_task_check_count = 4194304
kernel.hung_task_check_interval_secs = 0
kernel.hung_task_panic = 0
kernel.hung_task_timeout_secs = 120
kernel.hung_task_warnings = 10
$
All right, let's now move on to the final portion of this topic!
Detecting workqueue stalls
The kernel workqueue infrastructure can be of immense help to a driver (and other) authors, allowing them to have work consumed in a process (blocking) context very easily (it internally manages pools of kernel worker threads to achieve this). One of the issues with using them, however, is the fact that work can get stalled (delayed) on occasion to unacceptable levels, and thus significantly affect performance. Thus, the kernel provides a means of detecting workqueue stalls.
This feature is enabled by selecting the CONFIG_WQ_WATCHDOG=y kernel config (you'll find it within the make menuconfig UI under Kernel hacking | Debug Oops, Lockups and Hangs | Detect Workqueue Stalls (refer to Figure 10.8)). Once set to y, if a workqueue's worker pool fails to progress on a work item, a warning message (at KERN_WARN) is emitted to the kernel log, along with the workqueue internal state information.
The time beyond which the workqueue stall detection occurs is governed by the workqueue.watchdog_thresh kernel boot parameter as well as the corresponding sysfs file. It's 30 seconds by default. Writing (or setting) 0 here disables workqueue stall checks.
Triggering a workqueue stall
A simple experiment to test workqueue lockup is by inserting a couple of lines of CPU-intensive code in our kernel-default workqueue's work function (the original code is from my earlier Linux Kernel Programming – Part 2 book and the relevant code (copied here) is from here: https://github.com/PacktPublishing/Linux-Kernel-Programming-Part-2/tree/main/ch5/workq_simple. Do remember to test stuff like this on a multicore system!). The added buggy code is clear in Figure 10.10 – it's the few lines from line number 96 to line number 101 (the source is in ch10/workq_stall, as it's possible that exact line numbers can vary):

Figure 10.10 – A partial screenshot showing how our buggy code – deliberately locking up the CPU – causes the BUG: workqueue lockup, overwriting the console display
Clearly, the kernel's workqueue stall detection code senses the issue and emits emergency level printks (the code detecting this is here: https://elixir.bootlin.com/linux/v5.10.60/source/kernel/workqueue.c#L5806). Additionally, while this is going on, running a utility such as top -i will reveal how pretty much 100% of the CPU is being consumed by a kernel worker thread (typically, belonging to the kernel-default worker pool).
Summary
Congratulations on completing this chapter! By now, you should have your own custom panic handler reading and raring to go!
To quickly summarize, in this chapter, we covered what a kernel panic is, interpreted its log output, and importantly, learned how to leverage the kernel's powerful notifier chain infrastructure to develop our own custom kernel panic handler.
We then moved on to what kernel lockup – hard, soft, and RCU CPU stalls – means and how to configure the kernel to detect it (with small examples to show what it looks like when it locks up!). The final section covered how to detect hung tasks (unresponsive tasks that remain in the D state for a long while) and workqueue stalls.
Once issues like this are detected, examining the kernel log (where, typically, you'll have the kernel warning and CPU backtraces) can provide you with valuable clues as to where an issue lies, thus helping you fix it.
I'll see you in the next chapter, where we will learn to leverage kernel GDB tooling to interactively debug kernel code.
Further reading
- Official kernel documentation on collecting kernel logs via the kernel ramoops and pstore facilities:
- Ramoops oops/panic logger: https://www.kernel.org/doc/html/latest/admin-guide/ramoops.html#ramoops-oops-panic-logger
- pstore block oops/panic logger: https://www.kernel.org/doc/html/latest/admin-guide/pstore-blk.html?highlight=pstore#pstore-block-oops-panic-logger
- Persistent storage for a kernel's "dying breath", Jake Edge, LWN, Mar 2011: https://lwn.net/Articles/434821/
- Use ramoops for logging under Linux, embear blog: https://embear.ch/blog/using-ramoops
- XDA Basics: How to take logs on Android, July 2021, G. Shukla: https://www.xda-developers.com/how-to-take-logs-android/
- Official kernel docs: Linux Magic System Request Key Hacks: https://www.kernel.org/doc/html/latest/admin-guide/sysrq.html
- Notifier chains:
- Notification Chains in Linux Kernel: https://0xax.gitbooks.io/linux-insides/content/Concepts/linux-cpu-4.html
- The Crux of Linux Notifier Chains, R. Raghupathy, January 2009: https://www.opensourceforu.com/2009/01/the-crux-of-linux-notifier-chains/
- Watchdogs and lockups:
- Linux Kernel Watchdog Explained, 2018, Zak H: https://linuxhint.com/linux-kernel-watchdog-explained/
- IT log book: Linux – what are "CPU lockups"?, January 2018: https://blog.seibert-media.com/2018/01/04/log-book-linux-cpu-lockups/
- Official kernel documentation: Using RCU's CPU Stall Detector: https://www.kernel.org/doc/html/latest/RCU/stallwarn.html#using-rcu-s-cpu-stall-detector
- RUNNING FOREVER WITH THE RASPBERRY PI HARDWARE WATCHDOG, D. Letz, July 2020: https://diode.io/raspberry%20pi/running-forever-with-the-raspberry-pi-hardware-watchdog-20202/