
Chapter 3: Debug via Instrumentation – printk and Friends
Quick, think: how often have you interspersed printf() instances (or the equivalent) in your program in order to follow its progress as it executes code, and indeed, to see at approximately which point it (perhaps) crashes? Often, I'm guessing! Don't feel bad at all, this is a really good debugging technique! It has a fancy name to boot: instrumentation.
What you've been doing is instrumenting your code, allowing you to see the flow (depending on the granularity of your print statements); this allows you to understand where it's been. Often enough, this is all that's required to debug many situations. Do recollect, though, what we discussed in the previous chapter – a technique like instrumentation is typically useful in certain circumstances, not all. For example, a resource leak (such as a memory leak) defect is difficult, if not impossible, to debug with instrumentation. For most other situations though, it's a really useful technique!
In this chapter, we're going to understand how to instrument kernel (or driver) code, primarily using the powerful printk() – and friends – APIs. Further, we shall continue along this path in the following chapter as well, focusing our efforts on another kernel technology than can be used for instrumentation on production systems – kprobes.
In this chapter, we will focus on covering the following main topics:
- The ubiquitous kernel printk
- Leveraging the kernel printk for debug purposes
- Using the kernel's powerful dynamic debug feature
These very practical topics are important: knowing how to efficiently debug via instrumentation can result in a quick cure for annoying bugs!
Technical requirements
The technical requirements and workspace remain identical to what's described in Chapter 1, A General Introduction to Debugging Software. The code examples can be found within the book's GitHub repository here: https://github.com/PacktPublishing/Linux-Kernel-Debugging.
The ubiquitous kernel printk
There's a good reason the famous and familiar Kernighan and Ritchie (K&R) Hello, world C program employs the printf() API: it's the preferred API via which any output is written to the screen (well, technically, to the standard output channel stdout of the calling process). After all, it's how we can actually see that our program is really doing something, right?
You will surely recall using this API when writing your very first C program. Did you write the code that incorporates the printf() function? No, of course not; then where is it? You know: it's part of the (typically rather large) standard C library – GNU libc (glibc) on Linux. Pretty much every binary executable program on a Linux box automatically and dynamically links into this library; thus printf() is pretty much always available! (On x86, doing ldd $(which ps) will have the useful ldd script show you the libraries that the ps app links into; one of them will be the standard C library libc.so.* – try it.)
Except printf() isn't available within the kernel! Why? This itself is a key point: the Linux kernel does not use libraries – dynamically or statically – in the way userspace applications do. There are what could perhaps pass as the equivalent: the lib/ branch of the kernel source tree (peek at it here if you wish: https://github.com/torvalds/linux/tree/master/lib) contains many useful APIs that get built into the kernel image itself. Also, the kernel's framework for writing modules – the Loadable Kernel Module (LKM) – has facilities that kind of mimic the user mode library: the module stacking approach and the ability to link together several source files into a single kernel module object (.ko) file.
Important Note
These facilities – writing kernel modules with the LKM framework, the module stacking approach, the usage of the printk() API, and so on, are covered in detail in my earlier book Linux Kernel Programming.
So, how is the kernel or driver developer expected to emit a message that can be seen and, even better, logged? Via the ubiquitous printk() API, that's how! We say this because the printk() (and friends) APIs can be used anywhere – within interrupt handlers (all sorts – hardirq/softirq/tasklets), process context, while holding a lock; they're SMP-safe.
For you, the reader of this book, I do assume that you understand the basic usage of the useful printk() API, so I'll mostly skip over the very basics and instead explain a summary of typical basic usage, along with a few examples from the kernel code base.
The printk() API's signature is as follows:
// include/linux/printk.h
int printk(const char *fmt, ...);
If you're curious, the actual implementation is here within the kernel source: kernel/printk/printk.c:printk().
Tip – Browsing Source Trees
Efficiently browsing large code bases is an important skill; the modern Linux kernel source tree's Source Lines Of Code (SLOCs) are in excess of 20 million lines! Though you could go with the typical find <ksrc>/ -name "*.[ch]" |xargs grep –Hn "<pattern>" approach, it quickly gets tiresome.
Instead, please do yourself a big favor and learn to use powerful and efficient purpose-built code-browsing tools like (exuberant!) ctags and cscope (you installed them when following directions in Chapter 1, A General Introduction to Debugging Software). In fact, for the Linux kernel, they're built-in targets to the top-level Makefile; here's how you can build their index files for the kernel:
cd <kernel-src-tree>
make –j8 tags
make –j8 cscope
To build the indices for a particular architecture, set the environment variable ARCH to the architecture name; for example, to build cscope indices for AArch64 (ARM 64-bit):
make ARCH=arm64 cscope
You'll find links to tutorials on using ctags and cscope in the Further reading section of this chapter.
Great – let's actually make use of the famous printk(); to do so, we'll begin by checking out the logging levels at which messages can be emitted.
Using the printk API's logging levels
Syntax-wise, the printk API usage is almost identical to that of the familiar printf(3); the immediately visible difference is the usage of a logging level prefixed to the format specifier, the KERN_<foo> as the first token. Here's a sample printk with the logging level set to KERN_INFO:
printk(KERN_INFO "Hello, kernel debug world
");
First off, notice that KERN_INFO is not a separate parameter; it's part of the format string being passed as the argument. Next, it's not a priority level; it's merely a marker to specify that this printk is being logged as an informational one. Utilities to view logs – such as dmesg(1), journalctl(1), and even GUI tools such as gnome-logs(1) – can subsequently be used to filter log messages by logging level.
The printk has eight available log levels (from 0 to 7); you're expected to use the one appropriate to the situation at hand. We'll show them to you direct from the source. The comment to the right of each log level specifies the typical circumstances under which you're expected to use it:
// include/linux/kern_levels.h
[...]
#define KERN_EMERG KERN_SOH "0" /* system is unusable */
#define KERN_ALERT KERN_SOH "1" /* action must be taken immediately */
#define KERN_CRIT KERN_SOH "2" /* critical conditions */
#define KERN_ERR KERN_SOH "3" /* error conditions */
#define KERN_WARNING KERN_SOH "4" /* warning conditions */
#define KERN_NOTICE KERN_SOH "5" /* normal but significant condition */
#define KERN_INFO KERN_SOH "6" /* informational */
#define KERN_DEBUG KERN_SOH "7" /* debug-level messages */
#define KERN_DEFAULT "" /* the default kernel log level */
[...]
You can see that the KERN_<FOO> log levels are merely strings ("0", "1", ..., "7") that get prefixed to the kernel message being emitted by printk, nothing more. KERN_SOH is simply the kernel Start Of Header (SOH), which is the value �01. The man page on the ASCII code, ascii(1), shows that the numeric 1 (or �01) is the SOH character, a convention that is followed here.
What's the printk Default Log Level?
Within printk(), if the log level is not explicitly specified, what log level is the print emitted at? It's 4 by default, that is, KERN_WARNING. Note, though, that you are expected to always specify a suitable log level when using printk or, even better, use the convenience wrapper macros of the form pr_<foo>() where <foo> specifies the log level (it's coming right up).
Further, the kern_levels.h header contains integer equivalents of the string loglevel we've just seen (KERN_<FOO>) as the macro's LOGLEVEL_<FOO> (fear not, we shall make use of it in the first example code that comes up soon!).
A quick introduction to the pr_*() convenience macros will get us closer to the code. Let's go!
Leveraging the pr_<foo> convenience macros
For convenience, the kernel provides simple wrapper macros over the printk of the form pr_<foo> (or pr_*()) where <foo> specifies the log level; for example, in place of writing the code as follows:
printk(KERN_INFO "Hello, kernel debug world
");
You can – and indeed should! – instead use the following:
pr_info("Hello, kernel debug world
");
The kernel header include/linux/printk.h defines the following pr_<foo> convenience macros; you're encouraged to use them in place of the traditional printk():
- pr_emerg(): printk() at log level KERN_EMERG
- pr_alert(: printk() at log level KERN_ALERT
- pr_crit: printk() at log level KERN_CRIT
- pr_err(): printk() at log level KERN_ERR
- pr_warn(): printk() at log level KERN_WARNING
- pr_notice(): printk() at log level KERN_NOTICE
- pr_info(): printk() at log level KERN_INFO
- pr_debug() or pr_devel(): printk() at log level KERN_DEBUG
Here's an example of using the emergency printk:
// arch/x86/kernel/cpu/mce/p5.c
[...]
/* Machine check handler for Pentium class Intel CPUs: */
static noinstr void pentium_machine_check(struct pt_regs *regs)
{[…]
if (lotype & (1<<5)) { pr_emerg("CPU#%d: Possible thermal failure (CPU on fire ?).
", smp_processor_id());}
[...]
Is the processor on fire!? Whoops! The point: the above message is logged at level KERN_EMERG.
While on the subject of using the pr_*() macros, there's one called pr_cont(). Its job is to act as a continuation string, continuing the previous printk! This can be useful... here's an example of its usage:
// kernel/module.c
if (last_unloaded_module[0])
pr_cont(" [last unloaded: %s]", last_unloaded_module);
   pr_cont("
");
We typically ensure that only the final pr_cont() contains the newline character. Right, let's now learn how to automatically prefix every printk we emit!
Fixing the prefix
In addition, there's a rather special macro, pr_fmt(). It's used to generate a uniform format string for the pr_*() macros (and indeed for any printk()). So, by overriding its definition, by (re)defining it as the very first (non-comment) line of a source file, you can guarantee prefixing a given format to all subsequent pr_*() macro and printk() API invocations. This can be very useful, especially in a debug context, allowing us to automatically prefix, say, the kernel module name, the function name, and the line number to every single printk!
Let's check out an example: our very simple printk_loglevels kernel module demonstrates a couple of things:
- Using the pr_fmt() macro to prefix a custom string to every single printk
- Using the pr_<foo>() macros to emit printks at different logging levels
Don't Forget
The code for this, and all kernel/driver modules and demos presented in this book, is available in its GitHub repo. For this particular demo, you can find the code here: https://github.com/PacktPublishing/Linux-Kernel-Debugging/tree/main/ch3/printk_loglevels Next, when trying out the kernel modules here, please ensure that you have booted into the custom debug kernel (or even the default distro kernel is okay for now). Attempting to use our custom production kernel may not work – why not? This is possibly because its security configuration is tight: it may not even allow you to try out a kernel module that isn't signed or if the signature can't be verified (more on this in the Trying our kernel module on the custom production kernel section).
Let's quickly check out the relevant code from the ch3/printk_loglevels/printk_loglevels.c file:
#define pr_fmt(fmt) "%s:%s():%d: " fmt, KBUILD_MODNAME, __func__, __LINE__
#include <linux/init.h>
#include <linux/module.h>
#include <linux/kernel.h>
[...]
static int __init printk_loglevels_init(void)
{ pr_emerg("Hello, debug world @ log-level KERN_EMERG [%d]
", LOGLEVEL_EMERG); pr_alert("Hello, debug world @ log-level KERN_ALERT [%d]
", LOGLEVEL_ALERT); pr_crit("Hello, debug world @ log-level KERN_CRIT [%d]
", LOGLEVEL_CRIT); pr_err("Hello, debug world @ log-level KERN_ERR [%d]
", LOGLEVEL_ERR); pr_warn("Hello, debug world @ log-level KERN_WARNING [%d]
", LOGLEVEL_WARNING); pr_notice("Hello, debug world @ log-level KERN_NOTICE [%d]
", LOGLEVEL_NOTICE); pr_info("Hello, debug world @ log-level KERN_INFO [%d]
", LOGLEVEL_INFO); pr_debug("Hello, debug world @ log-level KERN_DEBUG [%d]
", LOGLEVEL_DEBUG); pr_devel("Hello, debug world via the pr_devel() macro (eff @KERN_DEBUG) [%d]
", LOGLEVEL_DEBUG);return 0; /* success */
}
static void __exit printk_loglevels_exit(void)
{ pr_info("Goodbye, debug world @ log-level KERN_INFO [%d]
", LOGLEVEL_DEBUG);}
A (partial) screenshot of trying out this code is shown as follows – do study the output:

Figure 3.1 – Screenshot showing output from our printk_loglevels kernel module
(By the way, I often use a simple wrapper bash script named lkm – in the root of our source tree – to automate the build, load (insmod(8)), lsmod(8), and dmesg(1)) of the kernel module. The invocation of the script isn't seen in the preceding screenshot though.)
In the preceding code and screenshot, do notice the following:
- Due to our pr_fmt() macro (in the first line of code), every printk is prefixed with the module name, function name, and line number.
- The pr_<foo>() macros have emitted a printk at the relevant log level. Even the log level integer equivalent is printed within parentheses on the extreme right.
- Any printk at log level emergency (KERN_EMERG) is immediately displayed on all console devices. You can see the output in the preceding screenshot (see the line in the upper portion Message from syslog@dbg-LKD at ...).
- The dmesg utility has the ability to conveniently color-code the log output, helping our eyes to catch the more important kernel messages (so too does the powerful journalctl utility).
- To prevent serious information leakage security issues, many recent distros configure CONFIG_SECURITY_DMESG_RESTRICT to be on by default, thus requiring us to either use sudo(8) or have the appropriate capability bits set to view kernel logs via dmesg.
All right, now that we understand how to use the printk() API as well as the pr_*() macros, let's move on to figuring out a key point: once emitted, where exactly is the printk() / pr_*() / dev_*() output visible?
Understanding where the printk output goes
Without going into too many of the details (they're covered in my earlier Linux Kernel Programming book), let's quickly summarize this key point: we have issued several printks, but where does the output actually go? The following table precisely shows this.
The first important thing to understand is unlike the printf userspace family of APIs, the printk output does not go to stdout:

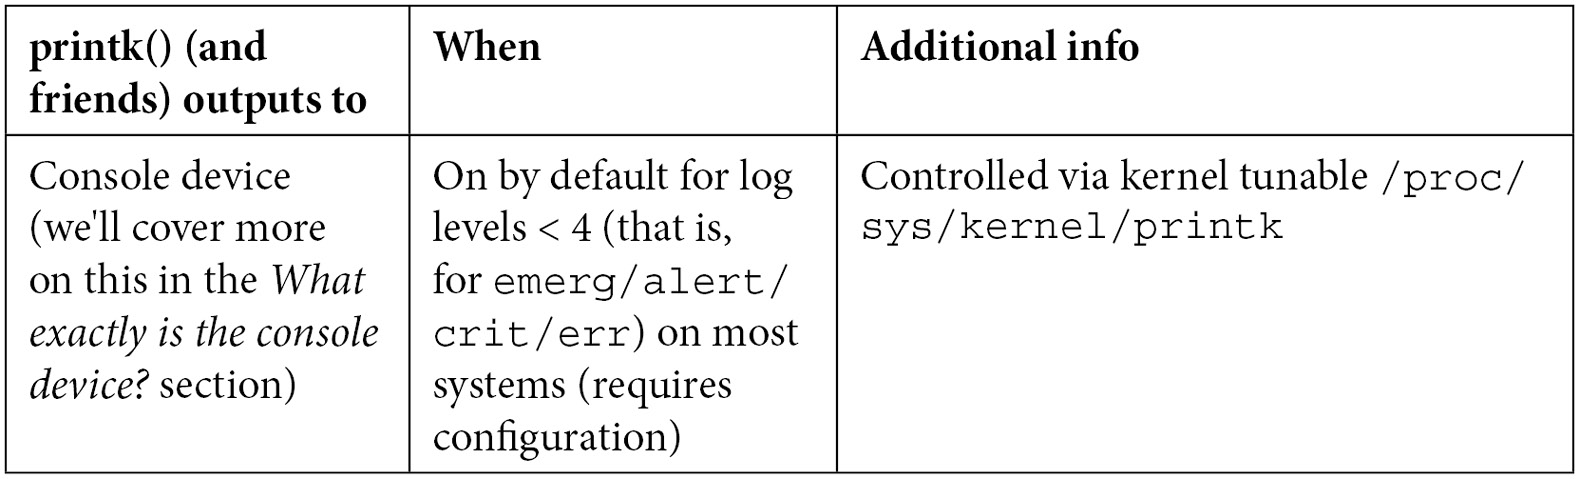
Table 3.1 – Summary of printk output locations
With modern Linux distros (including our x86_64 Ubuntu 20.04 LTS), system daemon (systemd) is the initialization framework used. Systemd is a pretty powerful (and intrusive!) framework, taking over many tasks on the OS. These include bringing up system services, logging, core dump manipulation, the kernel/userspace udev feature, and more. The logging framework includes sophisticated features such as log rotation, archival, and so on.
As well, on many modern distros, the traditional style logging does work along with the modern one. Here, the files logged into for kernel printks depend on the broad type of distro:
- Debian/Ubuntu type distros: /var/log/syslog
- Red Hat/Fedora/CentOS type distros: /var/log/messages
I'll also mention that the output of the kernel printk to the console device depends upon the log level that it's emitted at. The first number output by /proc/sys/kernel/printk specifies that all messages less than this value will appear on the console device (or devices). Recall that the lower the numeric value of the log level, the higher its relative importance. For example, this is on our x86_64 Ubuntu 20.04 LTS:
$ cat /proc/sys/kernel/printk
4 4 1 7
The first number is 4, representing the log level below which messages will appear on the console (as well as getting logged into the kernel log buffer and log files). In this case, we can conclude that all printks at a logging level less than 4 – KERN_WARNING – will appear on the console. In other words, all printks emitted at log levels KERN_EMERG, KERN_ALERT, KERN_CRIT, and KERN_ERR. This is useful as it displays only the more important log messages. Of course, as root, you can change this as you please.
Practically using the printk format specifiers – a few quick tips
Here are a few top-of-mind common printk format specifiers to keep in mind when writing portable code:
- For the size_t and ssize_t typedefs (which represent signed and unsigned integers respectively), use the %zu and %zd format specifiers respectively.
- When printing an address in kernel-space (a pointer):
- Very Important: use %pK for security (it will emit only hashed values and helps prevent info leaks, a serious security issue).
- Use %px for actual pointers, to see the actual address (don't do this in production!).
- Use %pa for printing a physical address (must pass it by reference).
- To print a raw buffer as a string of hex characters, use %*ph (where * is replaced by the number of characters; use this for buffers with fewer than 65 characters and use the print_hex_dump_bytes() routine for buffers with more). Variations are available (see the kernel doc link that follows).
- To print IPv4 addresses, use %pI4, to print IPv6 addresses use %pI6 (a few variations exist).
An exhaustive list of printk format specifiers, which to use when (with examples!) is part of the official kernel documentation here: https://www.kernel.org/doc/Documentation/printk-formats.txt. I urge you to browse through it!
Right, now that you understand the basics of using printk() (and the related pr_*() / dev_*() macros), let's move on to specifics on using the printk for the purpose of debugging.
Leveraging the printk for debug purposes
You might imagine that all you have to do to emit a debug message to the kernel log is simply to issue a printk at the log level KERN_DEBUG. Though there's (a lot) more to it, the pr_debug() (and dev_dbg()) macros are actually designed to be more than mere printers when the kernel's dynamic debug option is enabled. We will learn about this powerful aspect in the coming Using the kernel's powerful dynamic debug feature section.
In this section, let's first learn more about issuing a debug print, followed by slightly more advanced ways that help in the issuing of debug messages to the kernel log.
Writing debug messages to the kernel log
In the simple kernel module we covered in the previous section (printk_loglevel), let's relook at the couple of lines of code that emitted a kernel printk at the debug log levels:
        pr_debug("Hello, debug world @ log-level KERN_DEBUG   [%d]
", LOGLEVEL_DEBUG);
pr_devel("Hello, debug world via the pr_devel() macro (eff @KERN_DEBUG) [%d]
", LOGLEVEL_DEBUG);Both macros pr_debug() and pr_devel() issue a print to the kernel log at log level KERN_DEBUG but only when the symbol (macro) DEBUG is defined! If it isn't defined, they remain silent – no debug output appears. This is precisely what's required!
Module authors should avoid using the pr_devel() macro. It's meant to be used for kernel-internal debug printk instances whose output should never be visible in production systems.
Figure 5.1 revealed that the messages from the pr_debug() and pr_devel() macros did indeed make it to the kernel log, but, recall, in order for this to work, the DEBUG symbol needs to be defined. Where was this done? Especially as it isn't defined in the code. The answer: we defined it within the module's Makefile. Check it out (I've highlighted the key portion here); the following Makefile snippet is kept simple, it unconditionally sets ccflags-y; in the code, we use a variable MYDEBUG to conditionally set ccflags-y):
$ cd ch3/printk_loglevels ; cat Makefile
[ ... ]
# Set FNAME_C to the kernel module name source filename (without .c)
FNAME_C := printk_loglevels
PWD := $(shell pwd)
obj-m += ${FNAME_C}.o# EXTRA_CFLAGS deprecated; use ccflags-y
ccflags-y += -DDEBUG -g -ggdb -gdwarf-4 -Og -Wall -fno-omit-frame-pointer -fvar-tracking-assignments
# man gcc: "...-Og may result in a better debugging experience"
[ ... ]
By appending the value -DDEBUG to the ccflags-y variable, it gets defined in effect. The -D implies define this symbol – useful. Likewise, -U implies undefine this symbol. We typically employ these in the Makefile targets for the debug and production versions of the app, respectively, or, as in this case, the kernel module. So, here, to generate the production version, simply change the value of the Makefile variable MYDEBUG from n to y to enable debug mode.
Important – Building a Kernel Module for Debug or Production
The way your kernel module gets built is heavily influenced by the value that the DEBUG_CFLAGS variable gets set to. This variable is primarily set within the kernel's top-level Makefile. Here, the value it obtains depends upon the kernel config CONFIG_DEBUG_INFO. When it's on (implying a debug kernel), various debug flags make their way into DEBUG_CFLAGS, and thus your kernel module gets built with them. In effect, what I'm trying to emphasize here, is that the presence or absence of the –DDEBUG string within your kernel module's Makefile (as we do here) does not much influence the way that your kernel module is built.
In effect, when you boot via your debug kernel and build your kernel modules, they're automatically built with symbolic info and various kernel debug options turned on. On the other hand, when booted via the production kernel, and (re)built therein, your kernel modules end up without debug information/symbols.
As an example, when I built this kernel module (ch3/printk_loglevels) when on the debug kernel, the printk_loglevels.ko file size was 221 KB, but when built on the production kernel, the size dropped to under 8 KB! (The lack of debug symbols and info, KASAN instrumentation, and so on, account for this major difference.)
Quick tips: Doing make V=1 to actually see all options passed to the compiler can be very enlightening!
Further, and very useful, you can leverage readelf(1) to determine the DWARF format debug information embedded within the binary Executable and Linker Format (ELF) file. This can be particularly useful to figure out exactly which compiler flags your binary executable or kernel module has been built with. You can do so like this:
readelf --debug-dump <module_dbg.ko> | grep producer
Note that this technique typically works only when debug info is enabled; further, when working with a different target architecture (for example, ARM), you'll need to run that toolchain's version: ${CROSS_COMPILE}readelf. Do see the Further reading section for links to a series of articles on the GNU Debugger (GDB), which describe this (and more) in detail (the second part in the series mentioned is the relevant one here).
Let's see an example of actual usage of dev_dbg() within the kernel (drivers). An interesting, easy, and very cool way of emitting output on typical embedded projects is via an Organic Light-Emitting Diode (OLED) device. They typically work over an Inter-Integrated Circuit (I2C) bus, pretty much always available on embedded devices (such as the popular Raspberry Pi or the BeagleBone). We'll take the SSD1307 OLED framebuffer driver as an example from this driver source file within the kernel source tree:
// drivers/video/fbdev/ssd1307fb.c
static int ssd1307fb_init(struct ssd1307fb_par *par)
{[...]
/* Enable the PWM */
pwm_enable(par->pwm);
        dev_dbg(&par->client->dev, "Using PWM%d with a %lluns period.
",
par->pwm->pwm, pwm_get_period(par->pwm));
}
As you can see, the first parameter to the dev_dbg() macro is a pointer to a device structure. Here, it happens to be embedded within an i2c_client structure (as this device is being driven over the popular I2C protocol), which itself is embedded within the driver's context structure (named ssd1307fb_par). This sort of thing is quite typical in drivers.
To make it more interesting, here's a photo of an SSD1306 OLED display panel in action (which the ssd1307fb driver can drive as well):

Figure 3.2 – An SSD1306 OLED display panel
As hinted at, there's much more we can do to leverage the kernel's dynamic debug framework... Before that though, and now that you know the basics of using the printk for debug, let's round this off with a few more practical tips on debugging with the printk and friends.
Debug printing – quick and useful tips
When working on a project or product, you'll perhaps need to generate some debug printk. The pr_debug() macro will get the job done (as long as the symbol DEBUG is defined of course). But think about this: to look up the debug prints, you will need to run dmesg over and over. Several tips on what you can do in this situation follow:
- Clear the kernel log buffer (in RAM) with sudo dmesg -C. Alternatively, sudo dmesg –c will first print the content and then clear the ring buffer. This way, stale messages don't clog the system and you see only the latest ones when you run dmesg.
- Use journalctl -f to keep a watch on the kernel log (in a fashion similar to how tail -f on a file is used). Try it out!
- Make the printk behave like the printf and see its output on the console! We can do this by setting the console log level to the value 8, thus ensuring that all printks (log levels 0 to 7) will be displayed on the console device:
sudo sh –c "echo "8 4 1 7" > /proc/sys/kernel/printk "
I often do this within a startup script when debugging kernel stuff. For example, on my Raspberry Pi, I keep a startup script that contains the following line:
[ $(id -u) -eq 0 ] && echo "8 4 1 7" > /proc/sys/kernel/printk
Thus, when it runs as root, this takes effect and all printk instances directly appear on the minicom(1) (or whichever) console, just as printf output would.
Useful, yes!? But what about a very common case – when you're working on a device driver? The next section delves into the recommended way – using the dev_dbg() macro.
Device drivers – using the dev_dbg() macro
A key point for driver authors: when writing a device driver, you are expected to make use of the dev_dbg() macro to emit a debug message (and not the usual pr_debug()).
Why? The first parameter to this macro is struct device *dev, a pointer to struct device. This device structure is always present when writing a driver and serves to describe the device in detail. It's often embedded in a wrapper structure particular to the kind of driver being written. Printing via the dev_dbg() macro not only gets the debug printk across and into the kernel log (and possibly the console), but it also typically has useful information prefixed to the message (such as the name and (sometimes) the class of the device, the major:minor numbers if appropriate, and so on).
An example from the kernel's Network Block Device (nbd) driver will serve to show how it's used. I searched, via cscope, for kernel code that calls dev_dbg() on the 5.10.60 kernel and got over 22,000 hits! An important reason is that it's used for dynamic debug as we'll shortly learn:
// drivers/block/nbd.c
dev_dbg(nbd_to_dev(nbd), "request %p: got reply
", req);
Here, the nbd_to_dev() inline function retrieves the device structure pointer from the nbd_device structure, where it's embedded.
Remember, when writing a driver, in place of the pr_*() macros, please use the equivalent dev_*() macros! The header include/linux/dev_printk.h contains their definitions – the dev_emerg(), dev_crit(), dev_alert(), dev_err(), dev_warn(), dev_notice(), dev_info(), and of course, as already covered, dev_dbg(). Everything remains as with the pr_*() macros except that the first parameter is a pointer to the device structure.
Trying our kernel module on the custom production kernel
As an experiment, boot into the custom production kernel we built back in Chapter 1, A General Introduction to Debugging Software. While running on this production kernel, let's build and then attempt to load the kernel module (notice we're running as root):
# make
[...]
# dmesg -C; insmod ./printk_loglevels.ko ; dmesg
insmod: ERROR: could not insert module ./printk_loglevels.ko: Operation not permitted
[ 1933.232266] Lockdown: insmod: unsigned module loading is restricted; see man kernel_lockdown.7
#
It fails due to the fact that, in our custom production kernel's configuration, we enabled the kernel lockdown mode (a recent kernel feature, from the 5.4 kernel, enabled via CONFIG_SECURITY_LOCKDOWN_LSM=y). This (and related) config options disallow the loading of any kernel module that isn't signed or if the signature cannot be validated by the kernel.
This implies that we can't even test our kernel module on the production kernel. You can, in one of two ways:
- Actually sign the kernel module (official kernel documentation – Kernel module signing facility: https://www.kernel.org/doc/html/v5.0/admin-guide/module-signing.html#kernel-module-signing-facility).
(Also, FYI, with CONFIG_MODULE_SIG_ALL=y, all kernel modules are auto-signed upon installation, during the make modules_install step of the kernel build.)
- Or, you can always disable these kernel configs, rebuild the kernel, reboot with it, and then test. We do precisely this in the Disabling the kernel lockdown section, which follows.
FYI, here's a link to the man page on the kernel lockdown feature: https://man7.org/linux/man-pages/man7/kernel_lockdown.7.html.
All good with the debug prints, except what are you to do when there are multiple voluminous printks, especially in a high-volume code path? The following section has you covered.
Rate limiting the printk
Let's take a plausible scenario: you're writing a device driver for some chipset or peripheral device... Often, especially during development, and sometimes in order to debug in production, you of course intersperse your driver code with the now-familiar dev_dbg() (or similar) macro. This works well until your code paths containing the debug prints turn out to run (very) often. What will happen? It's quite straightforward:
- The kernel ring (circular) buffer isn't very large (typically between 64 KB and 256 KB, configurable at kernel build time). Once full, it wraps around. This causes you to lose perhaps precious debug prints.
- Debug (or other) prints in a very high-volume code path (within interrupt handler routines and timers, for instance), can dramatically slow things down (especially on an embedded system with prints traveling across a serial line), even leading to a livelock situation (a situation where the system becomes unresponsive as the processor(s) are tied up working on logging stuff – console output, framebuffer scrolling, log file appends, and so on).
- The very same debug (or other) printk message being repeated over and over again umpteen times (for example, a warning or debug message within a loop) doesn't really help anyone.
- Also, do realize that it's not just the printk (and similar) APIs that can lead to logging issues and failures; the usage of kprobes or indeed any kind of event tracing on high-volume code paths can cause this same issue to crop up (we cover kprobes in the following chapter and tracing in later ones).
In such situations, you'll notice this message or similar (typically from the systemd-journald process):
/dev/kmsg buffer overrun, some messages lost.
(By the way, if you're wondering what the /dev/kmsg character device node is all about, please do refer to the kernel documentation here: https://www.kernel.org/doc/Documentation/ABI/testing/dev-kmsg.)
To mitigate exactly these situations, the community came up with the rate-limited printk – a means to throttle down and not emit prints (the same or different) when certain (tunable) thresholds have been exceeded!
We'll discuss these thresholds in just a moment... The kernel provides the following macros to help you rate-limit your prints/logging (#include <linux/kernel.h>):
- printk_ratelimited(): Warning! Do not use it – the kernel warns against this.
- pr_*_ratelimited(): Where the wildcard * is replaced by the usual (emerg, alert, crit, err, warn, notice, info, debug).
- dev_*_ratelimited(): Where the wildcard * is replaced by the usual (emerg, alert, crit, err, warn, notice, info, dbg).
Ensure you use the pr_*_ratelimited() macros in preference to printk_ratelimited(); driver authors should use the dev_*_ratelimited() macros.
But how exactly are the prints rate limited? The kernel provides two tunable thresholds via the usual control file interfaces within procfs (under the /proc/sys/kernel folder), named printk_ratelimit and printk_ratelimit_burst for this purpose. Here, we directly reproduce the sysctl documentation (from https://www.kernel.org/doc/Documentation/sysctl/kernel.txt) that explains the precise meaning of these two (pseudo) files:
printk_ratelimit:
Some warning messages are rate limited. printk_ratelimit specifies the minimum length of time between these messages (in jiffies), by default we allow one every 5 seconds.
A value of 0 will disable rate limiting.
===========================================================
printk_ratelimit_burst:
While long term we enforce one message per printk_ratelimit seconds, we do allow a burst of messages to pass through. printk_ratelimit_burst specifies the number of messages we can send before ratelimiting kicks in.
On my x86_64 Ubuntu 20.04 LTS guest system, we find that their (default) values are as follows:
$ cat /proc/sys/kernel/printk_ratelimit
5
$ cat /proc/sys/kernel/printk_ratelimit_burst
10
This implies that, by default, a burst of up to 10 printk messages occurring within a 5-second time interval can make it through before rate-limiting kicks in and further messages are suppressed (until the next time interval).
The printk rate-limiter code, when it does suppress kernel printk instances, emits a helpful message mentioning exactly how many earlier printk callbacks were suppressed.
We write a simple kernel module to test printk rate limiting (again, only the relevant snippets are shown here):
// ch3/ratelimit_test/ratelimit_test.c
#define pr_fmt(fmt) "%s:%s():%d: " fmt, KBUILD_MODNAME, __func__, __LINE__
[…]
#include <linux/kernel.h>
#include <linux/delay.h>
[...]
static int num_burst_prints = 7;
module_param(num_burst_prints, int, 0644);
MODULE_PARM_DESC(num_burst_prints, "Number of printks to generate in a burst (defaults to 7).");
static int __init ratelimit_test_init(void)
{int i;
    pr_info("num_burst_prints=%d. Attempting to emit %d printks in a burst:
", num_burst_prints, num_burst_prints);
for (i=0; i<num_burst_prints; i++) { pr_info_ratelimited("[%d] ratelimited printk @ KERN_INFO [%d]
", i, LOGLEVEL_INFO);mdelay(100); /* the delay helps magnify the rate-limiting effect, triggering the kernel's "'n' callbacks suppressed" message... */
}
return 0; /* success */
}
If you build and run this module with defaults, not modifying the num_burst_prints module parameter (it defaults to the value 7), you can see that we emit seven rate-limited printks in a short time interval. This, in spite of the 100-millisecond delay (the delay is deliberate – you will soon see its effect).
Let's push it a bit: we test by passing the module parameter num_burst_prints, setting its value to some number greater than the maximum allowed burst (the value of /proc/sys/kernel/printk_ratelimit_burst – 10 by default). We set it to 60. The screenshot shows what happens at runtime:

Figure 3.3 – Screenshot showing our ratelimit_test LKM in action
The preceding screenshot should make it clear: we attempt to emit 60 printks in a burst – but of course, it's the rate-limited version of the printk (via the pr_info_ratelimited() macro). The kernel's limit gets hit after just 10 printk (the default value of /proc/sys/kernel/printk_ratelimit_burst), thus, the kernel now prevents or suppresses further prints. This is clearly seen: you can see prints [0] to [9] – 10 of them being issued and then the message:
40 callbacks suppressed
After that, sufficient time elapsed (5 seconds here, as the /proc/sys/kernel/printk_ratelimit value is 5 by default) that the prints resumed! Our using mdelay(100) helped create a sufficient delay so that prints could resume... So, out of the 60 attempted prints, only 20 actually made it to the log (or console). This is a good thing and clearly demonstrates the point. As root, you can modify the rate-limit sysctl parameters to suit your requirements.
The ftrace trace_printk() API
The kernel's powerful ftrace subsystem (which we shall cover in detail in Chapter 9, Tracing the Kernel Flow) provides another way to mitigate high-volume logging issues: the trace_printk() API. The syntax is identical to the regular printf() (not printk()!) API. It has two major advantages over the typical printk: one, it's very fast (as it only writes to a RAM buffer); two, the size of the trace buffer is large by default and tunable by root.
So, in conclusion, if you have a code path with a high volume of printks, you can mitigate the potential ill effects by either employing the rate-limiting printk (and/or macros) or by using trace_printk() (more on the latter in Chapter 9, Tracing the Kernel Flow, in the Using the trace_printk() for debugging section).
So, by now you have the skills and knowledge to emit a debug printk (typically via the pr_*[_ratelimited]() or dev_*[_ratelimited]() macros)! It seems this is sufficient but only until you learn about and start using the kernel's pretty awesome dynamic debug framework. This is precisely what follows – read on and learn!
Using the kernel's powerful dynamic debug feature
The instrumentation approach to debugging – interspersing your kernel (and module) code with many printk is indeed a good technique. It helps you narrow things down and debug them! But as you've no doubt realized, there can be a (pretty high) cost to this:
- It eats into your disk (or flash) space as logs get filled in. This can be especially problematic on constrained embedded systems. Also, writing to disk is much slower than writing to RAM.
- It's fast in RAM, but the ring buffer is not that large and would thus quickly get overwhelmed; older prints will soon be lost.
- Even more important, on many production systems, a high volume of printks would have an adverse performance impact, creating bottlenecks and even possible livelocks! Rate limiting helps with this, to some extent...
A solution would be to use the pr_debug() and/or the dev_dbg() APIs! They're especially useful during development and testing as it's really easy to turn these debug printk on or off: the presence of the DEBUG symbol implies the debug printk will run (and be logged); its absence implies it won't.
That's great; however, think about this: when running in production (using the production kernel), the DEBUG symbol will almost certainly be undefined by default. Now let's say you have a situation while running in production where you want your debug prints for a given kernel module to appear, and thus get logged. Changing the code (or Makefile) to define the DEBUG symbol, then recompiling and re-installing it is very unlikely to be allowed during production.
So, what do you do (besides giving up)? There are two broad approaches to dynamically toggling debug prints: one, via module parameters, and two, via the kernel's powerful built-in dynamic debug facility – the latter being the superior one and very much the focus of this section. First, though, let's briefly check out the first option.
Dynamic debugging via module parameters
One approach is to use a module parameter to hold a debug predicate; keep it off by default (the value 0). You can define it like this:
static int debug;
module_param(debug, int, 0644);
This has the kernel set up the module's parameter named debug under the sysfs pseudo filesystem (at /sys/module/<module_name>/parameters/debug, with the owner and group as root and the octal permissions as specified in the third parameter to the module_param macro).
Interestingly, the i8042 keyboard and mouse controller driver (very often found in x86-based laptops) does precisely this; it defines this module parameter:
// drivers/input/serio/i8042.c
static bool i8042_debug;
module_param_named(debug, i8042_debug, bool, 0600);
MODULE_PARM_DESC(debug, "Turn i8042 debugging mode on and off");
This has the OS set up a module parameter named debug (notice the usage of the module_param_named() macro to achieve this), which is a Boolean and off (false) by default. A given module's parameters can be easily seen by leveraging the modinfo(8) utility; for example, let's look up the parameters you can supply to the kernel's hid driver:
$ modinfo -p /lib/modules/5.10.60-prod01/kernel/drivers/hid/hid.ko
debug:toggle HID debugging messages (int)
ignore_special_drivers:Ignore any special drivers and handle all devices by generic driver (int)
Okay, back to the i8042 driver; once loaded up, you can spot it's debug parameter under sysfs as follows:
$ ls -l /sys/module/i8042/parameters/debug
-rw------- 1 root root 4096 Oct 3 07:42 /sys/module/i8042/parameters/debug
Of course, this sysfs-based pseudo file will only be seen after the module has been loaded into memory, for its lifetime.
Notice the permissions. In this case, only root can read or write to the debug pseudo file:
$ sudo cat /sys/module/i8042/parameters/debug
[sudo] password for letsdebug: xxxxxxxxxx
N
The root user can always turn it on dynamically, by writing the value Y (or 1) into the sysfs pseudo-file representing it! This way, you can dynamically turn on or off debugging. So, here, to turn debugging on at runtime, do the following, as root of course:
# echo "Y" > /sys/module/i8042/parameters/debug
And turn it off again with the following:
# echo "N" > /sys/module/i8042/parameters/debug
Simple. In fact, think about this – you can easily extend this idea: one way to do so is to use an integer debug parameter, which, depending on its value, will have the module emit debug messages at various levels of verbosity. (For example, 0 means all debug messages are off, 1 implies only a few key debug prints will be emitted, 2 implies more debug verbosity, and so on.)
This general approach does work, but with a significant drawback, especially when compared to the kernel's dynamic debug facility:
- Performance – you will require a conditional statement of some sort (an if, switch, and so on) to check whether a debug print should be emitted or not every time. With multiple levels of verbosity, more checking is required.
- With the kernel's dynamic debug framework (which is covered next), you get several advantages:
- The formatting of debug messages with useful information prefixed is part of the feature set, with a gentle learning curve.
- Performance remains high, with next to no overhead when debugging is off (typically the default in production). This is achieved by sophisticated dynamic code patching techniques that the kernel employs (as is the case for ftrace as well).
- It's always part of the mainline kernel (from way back, since the 2.6.30 kernel), not requiring home-brewed solutions that may or may not be maintained, available or working.
So, for the remainder of this section, we shall focus on learning to use and leverage the kernel's powerful dynamic debug framework, available right since the 2.6.30 kernel. Read on!
When the kernel config option CONFIG_DYNAMIC_DEBUG is enabled, it allows you to dynamically turn on or off debug prints that have been compiled in the kernel image as well as within kernel modules. This is done by having the kernel always compile in all pr_debug() and dev_dbg() callsites. Now, the really powerful thing is that you can not only enable or disable these debug prints but do so at various levels of scope: at the scope of a given source file, a kernel module, function, or even a line number.
This does imply that the kernel image will be larger; it's not by too much, approximately a 2% increase in kernel text size. If this is a concern (on a tightly constrained embedded Linux, perhaps), you can always just set the kernel config CONFIG_DYNAMIC_DEBUG_CORE. This enables the core support for dynamic printks but it only takes effect on kernel modules that are compiled with the symbol DYNAMIC_DEBUG_MODULE defined. Thus, our module Makefile always defines it. You could always comment it out.... This is the relevant line within our module Makefile:
# We always keep the dynamic debug facility enabled; this
# allows us to turn dynamically turn on/off debug printks
# later... To disable it simply comment out the following
# line
ccflags-y += -DDYNAMIC_DEBUG_MODULE
In fact, it's not just pr_debug(); all the following APIs can be dynamically enabled/disabled per callsite: pr_debug(), dev_dbg(), print_hex_dump_debug(), and print_hex_dump_bytes().
Specifying what and how to print debug messages
As with many facilities, control over the kernel's dynamic debug framework – deciding which debug printks are enabled and what extraneous information is prefixed to them – is determined via a control file. Where's this control file then? It depends. If the debugfs pseudo filesystem is enabled within the kernel config (typically it is, with CONFIG_DEBUG_FS=y) and the kernel configs CONFIG_DEBUG_FS_ALLOW_ALL=y and CONFIG_DEBUG_FS_DISALLOW_MOUNT=n – usually the case for a debug kernel – then the control file is here:
/sys/kernel/debug/dynamic_debug/control
On many production environments though, for security reasons, the debugfs filesystem is present (functional) but invisible (it can't be mounted) via CONFIG_DEBUG_FS_DISALLOW_MOUNT=y.
In this case, the debugfs APIs work just fine but the filesystem isn't mounted (in effect, it's invisible). Alternately, debugfs might be disabled altogether by setting the kernel config CONFIG_DEBUG_FS_ALLOW_NONE to y. In either of these cases, an identical but alternate control file for dynamic debug under the pseudo proc filesystem (procfs) should be used:
/proc/dynamic_debug/control
As with other pseudo filesystems, this control file under debugfs or procfs is a pseudofile; it exists only in RAM. It gets populated and manipulated by kernel code. Reading its content will give you a comprehensive list of all debug printk (and/or print_hex_dump_*()) callsites within the kernel. Thus, its output is typically pretty large (over here, we're on the custom debug kernel and can hence use the debugfs location for the control file). Let's begin to interrogate it:
# ls -l /sys/kernel/debug/dynamic_debug/control
-rw-r--r-- 1 root root 0 Sep 16 12:26 /sys/kernel/debug/dynamic_debug/control
# wc -l /sys/kernel/debug/dynamic_debug/control
3217 /sys/kernel/debug/dynamic_debug/control
Notice it's only writable as root (and we're running as root). Let's look up the first few lines of output:
# head -n5 /sys/kernel/debug/dynamic_debug/control
# filename:lineno [module]function flags format
drivers/powercap/intel_rapl_msr.c:151 [intel_rapl_msr]rapl_msr_probe =_ "failed to register powercap control_type.�12"
drivers/powercap/intel_rapl_msr.c:94 [intel_rapl_msr]rapl_msr_read_raw =_ "failed to read msr 0x%x on cpu %d�12"
sound/pci/intel8x0.c:3160 [snd_intel8x0]check_default_spdif_aclink =_ "Using integrated SPDIF DMA for %s�12"
sound/pci/intel8x0.c:3156 [snd_intel8x0]check_default_spdif_aclink =_ "Using SPDIF over AC-Link for %s�12"
#
The format of each entry is shown first; it's reproduced here:
filename:lineno [module]function flags format
Besides the flags member, all are obvious. The last one, format, is the actual printf-style format string that the debug print uses. So, let's zoom into the first actual entry seen and examine it minutely, with a (hopefully) helpful diagram:
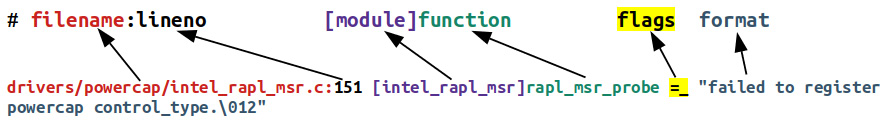
Figure 3.4 – The dynamic debug control file format specifier
Here's the detailed breakdown, as per the control file output format specifier:
- filename: drivers/powercap/intel_rapl_msr.c: This is the full pathname of the source file.
- lineno: 151: This is the line number within the source file, the place in code where the debug print lives (so complicated; yup, I can be sarcastic).
- [module]: [intel_rapl_msr]: The name of the kernel module where the debug print lives. It's optional: if the debug print callsite is in a kernel module, this – the module name – shows up in square brackets.
- function: rapl_msr_probe: The function containing the debug print.
- flags: =_: Ah, this is really the interesting, juicy bit. We explain it shortly (Table 3.2).
- format: "failed to register powercap control_type.�12": This is the actual printf-style format string that's to be printed/logged.
Just to fully verify this, here's the actual code snippet of this example from the kernel code base (version 5.10.60: I've highlighted the relevant line – # 151 – below):
// drivers/powercap/intel_rapl_msr.c
149 rapl_msr_priv.control_type = powercap_register_control_type(NULL, "intel-rapl", NULL);
150 if (IS_ERR(rapl_msr_priv.control_type)) {151 pr_debug("failed to register powercap control_type.
");152 return PTR_ERR(rapl_msr_priv.control_type);
153 }
You can see how it perfectly matches the control file's understanding of it.
(Interestingly, you can use Bootlin's online kernel code browser to look it up as well: https://elixir.bootlin.com/linux/v5.10.60/source/drivers/powercap/intel_rapl_msr.c#L151 – useful!)
The real magic lies in the so-called flags specifier. Using flags, you can program the dynamic debug framework to emit the debug print (thus having it logged) along with various useful prefixes. The following table summarizes how to program and interpret the flags specifier:

Table 3.2 – Dynamic debug framework flags specifier
In addition, quite intuitively, you can use the following symbols:
- +: Add the flag(s) specified.
- -: Remove the flag(s) specified.
- =: Set to the flag(s) specified.
A quick experiment: let's grep for the number of debug printk callsites currently enabled within the kernel (notice how I use sed to strip away the first line, as it's the format string explanatory line and not an actual entry):
# cat /sys/kernel/debug/dynamic_debug/control |sed '1d' |wc -l
3216
So, here and now, we have a total of 3,216 debug prints recognized by the kernel's dynamic debug framework. Now let's grep the flags, only matching the ones that are turned off:
# grep " =_ " /sys/kernel/debug/dynamic_debug/control |sed '1d' |wc -l
3174
So, of the total 3,216 debug printks in the kernel right now, 3,174 of them are turned off, leaving only 3216 - 3174 = 42 turned on (by the kernel/drivers/whatever). Let's verify this, by negating the sense of the grep:
# grep -n -v " =_ " /sys/kernel/debug/dynamic_debug/control |wc -l
42
It's verified. Of the ones that are turned on, here's the last three:
# grep -v " =_ " /sys/kernel/debug/dynamic_debug/control |tail -n3
init/main.c:1340 [main]run_init_process =p " with arguments:�12"
init/main.c:1129 [main]initcall_blacklisted =p "initcall %s blacklisted�12"
init/main.c:1090 [main]initcall_blacklist =p "blacklisting initcall %s�12"
So, as their flags value is =p, (just) the debug print will be emitted and logged when the line of code is hit; nothing will be prefixed to it.
Next, how do you program the dynamic debug framework? Very simple: just write the command – often via a simple echo statement – into the control file! Needless to say, it will only go through with root access (or, with the better and modern capabilities model, having a capability bit such as CAP_SYS_ADMIN set). The command syntax essentially is the following:
echo –n <match-spec* flags> > <control-file>
match-spec is one of the following:
match-spec ::= 'func' string |
'file' string |
'module' string |
'format' string |
'line' line-range
line-range ::= lineno | '-'lineno |
lineno'-' | lineno'-'lineno
lineno ::= unsigned-int
The match-spec syntax shown is taken direct from the kernel documentation on dynamic debug here: https://www.kernel.org/doc/html/latest/admin-guide/dynamic-debug-howto.html#command-language-reference.
The flags specifier has already been covered – see Table 3.2. Here's a table summarizing how to use match-spec to form a command, with examples:
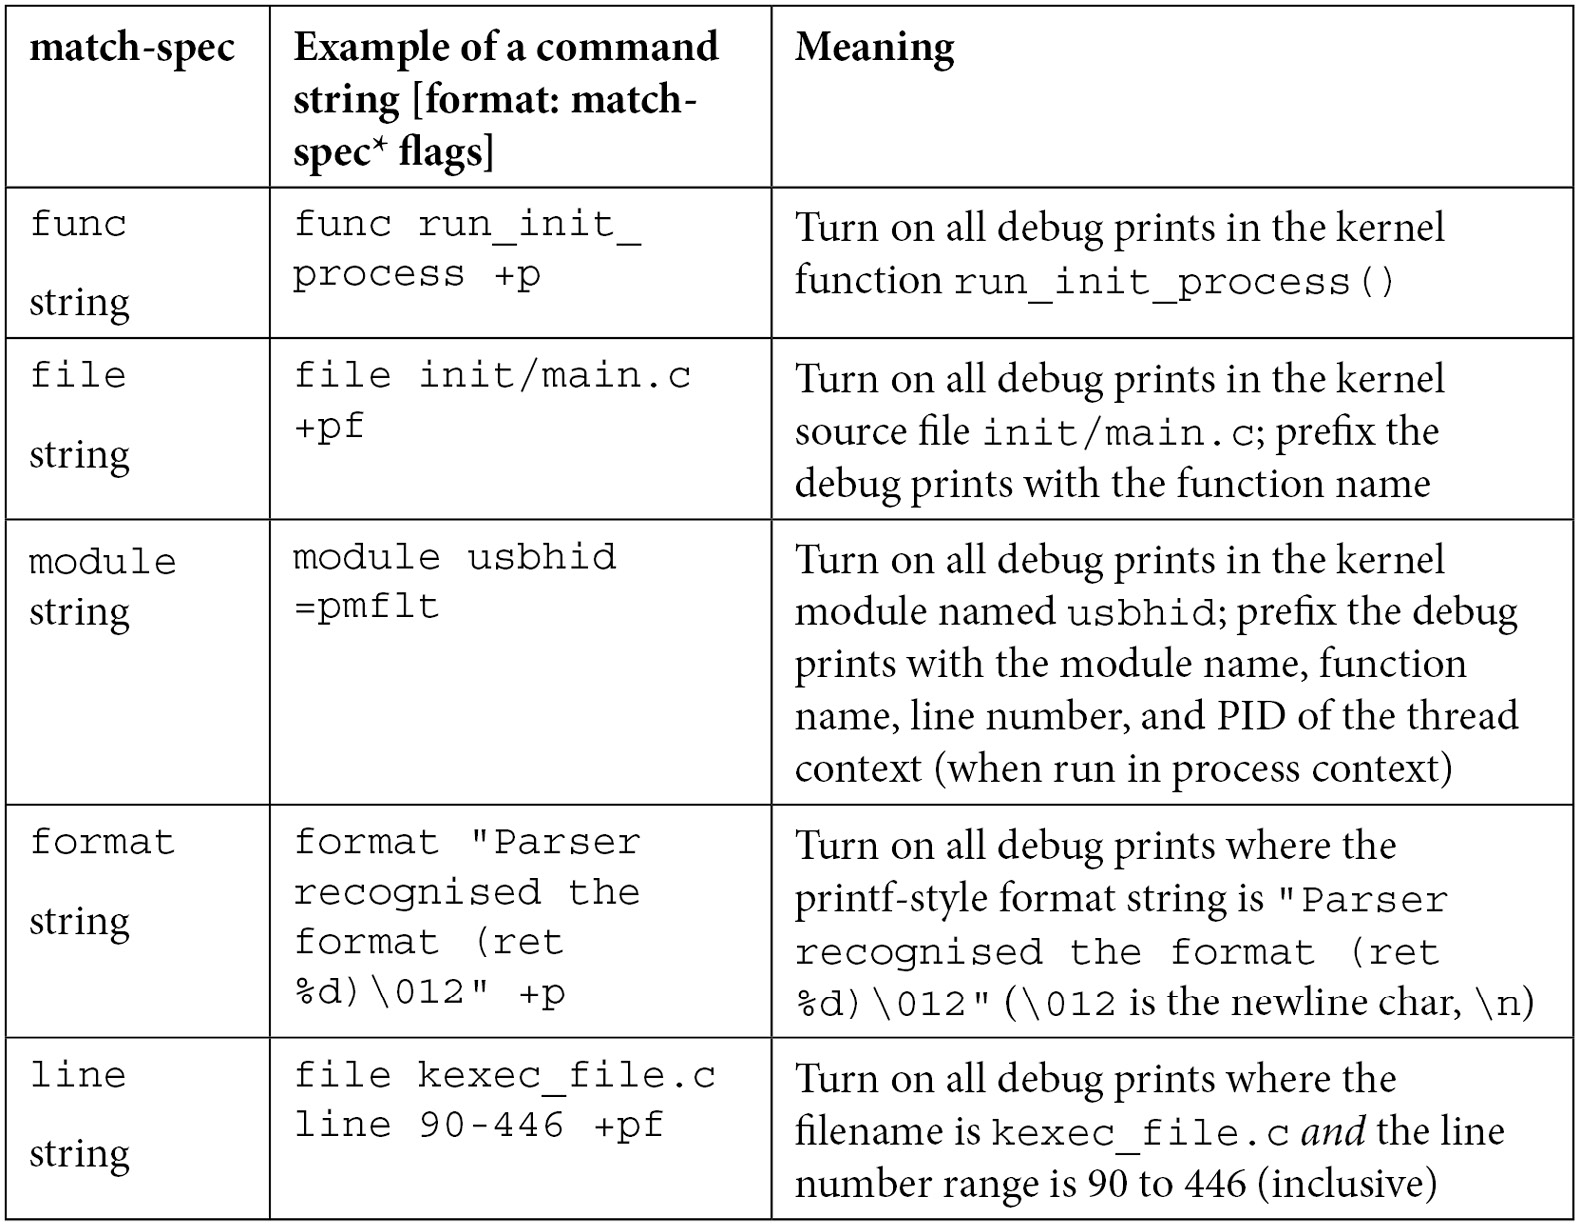
Table 3.3 – Dynamic debug framework match-spec specifiers with examples
Issue the command or program it like this:
# echo –n "<command string>" > <control-file>
Where the <command string> parameter to echo is the command formed in the match-spec* flags format and <control-file> is either <debugfs-mount>/dynamic_debug/control or /proc/dynamic_debug/control.
Adding to this, several match specifications can be given in a single command; you can think of them as being implicitly ANDed to form a match to a subset of debug prints. You can even batch several commands into a file and write the file to the control file. More examples are available on the kernel documentation page on dynamic debug here: https://www.kernel.org/doc/html/latest/admin-guide/dynamic-debug-howto.html#examples.
Exercising dynamic debugging on a kernel module on a production kernel
For most of us module authors, using this powerful dynamic debug framework on our kernel module when it's running in production will be a useful thing indeed. A demo will help you understand how to do so. To make the demo a bit more realistic, let's boot up via our custom production kernel to help mimic an actual production environment.
Disabling the kernel lockdown
However, what if – as recommended back in the first chapter – you've configured the custom production kernel for security, by enabling (among other things) the kernel lockdown mode by default (by setting CONFIG_LOCK_DOWN_KERNEL_FORCE_CONFIDENTIALITY=y). If this isn't the case, and you can load up your (and other third-party) kernel modules on the production kernel, then all's well for this experiment and you can skip this section.
This lockdown mode is good for security, preventing you from loading unsigned kernel modules (along with other safety measures). But now that we'd like to test our kernel module on the production kernel, we will have to tweak the production kernel's configuration, setting the following within the make menuconfig UI:
- Under Security options | Basic module for enforcing kernel lockdown:
- Enable lockdown LSM early in init: Set it to n (off).
- Kernel default lockdown mode: Set it to None.
- Next, save the config, rebuild, and reboot via the new production kernel.
- On the (GRUB) bootloader screen, press a key and edit the kernel command-line parameters, appending lockdown=none. This disables kernel lockdown mode.
For more details, please refer to the man page on kernel lockdown: https://man7.org/linux/man-pages/man7/kernel_lockdown.7.html.
Now let's get that debug printk working dynamically!
Demonstrating dynamic debugging on a simple misc driver
For the purposes of this demo, we'll grab a simple misc class character device driver from my earlier book, Linux Kernel Programming – Part 2 (the original code's here: https://github.com/PacktPublishing/Linux-Kernel-Programming-Part-2/tree/main/ch1/miscdrv_rdwr). Of course, we will keep a copy in this book's GitHub repo as well...
Looking at the code, you will notice several instances of the dev_dbg() macro being invoked. Obviously, these are the debug prints that will only get logged when DEBUG is defined or we use the kernel's dynamic debug facility – the latter being what this demo is all about!
Here's a sample of the debug prints in the driver (due to space constraints, I won't show all the code here of course, only a few relevant bits):
// ch3/miscdrv_rdwr/miscdrv_rdwr.c
#define pr_fmt(fmt) "%s:%s(): " fmt, KBUILD_MODNAME, __func__
static int open_miscdrv_rdwr(struct inode *inode, struct file *filp)
{struct device *dev = ctx->dev;
char *buf = kzalloc(PATH_MAX, GFP_KERNEL);
[...]
dev_dbg(dev, " opening "%s" now; wrt open file:
            f_flags = 0x%x
",
file_path(filp, buf, PATH_MAX), filp->f_flags);
kfree(buf);
[...]
}
static ssize_t write_miscdrv_rdwr(struct file *filp, const char __user *ubuf, size_t count, loff_t *off)
{int ret = count;
void *kbuf = NULL;
[...]
    dev_dbg(dev, "%s wants to write %zu bytes
",
get_task_comm(tasknm, current), count);
[...]
ret = count;
dev_dbg(dev, " %zu bytes written, returning...
            (stats: tx=%d, rx=%d)
",
count, ctx->tx, ctx->rx);
[...]
}
[...]
Note that the Makefile file for this module will conditionally set the DEBUG symbol to undefined (as we're building in production mode). Thus, the debug prints will not make it to the console or kernel logs.
A quick mount |grep -w debugfs shows no output, implying that the debugfs filesystem isn't visible. This, again, is intentional, a security feature we enabled for our custom production kernel by setting CONFIG_DEBUG_FS_DISALLOW_MOUNT=y. Don't panic (yet) – as mentioned, there's a solution. Simply make use of the control file available here: /proc/dynamic_debug/control.
Grepping it for our module before it's inserted into memory reveals no data, as expected:
# grep miscdrv_rdwr /proc/dynamic_debug/control
#
Okay, now we can get it running. The following screenshot shows the source files via ls, the build (via our convenience lkm script), the resulting dmesg output, and the device node this driver creates:

Figure 3.5 – Screenshot of our miscdrv_rdwr loading up on our custom production kernel
Also notice (in the preceding screenshot) the following:
- The kernel version is 5.10.60-prod01, showing that we're running on our custom production kernel.
- The value of the ccflags-y (or the older EXTRA_CFLAGS) variable is -UDEBUG –DDYNAMIC_DEBUG_MODULE, as expected.
With the current settings, the debug prints do not get logged. Let's try this out and see (remember: "be empirical"!):
# echo "DEBUG undefined, no logging?" > /dev/llkd_miscdrv_rdwr
# dmesg
[ 9177.333822] miscdrv_rdwr:miscdrv_rdwr_init(): LLKD misc driver (major # 10) registered, minor# = 58, dev node is /dev/llkd_miscdrv_rdwr
#
As is expected, the kernel log (seen via dmesg) shows only the earlier printk (which, being pr_info() does show up); none of the debug prints appear. So, let's set up to make them appear!
Now that our kernel module is loaded up, let's grep the dynamic debug control file again:
# grep "miscdrv_rdwr" /proc/dynamic_debug/control
<…>/miscdrv_rdwr.c:303 [miscdrv_rdwr]miscdrv_rdwr_init =_ "A sample print via the dev_dbg(): driver initialized�12"
<…>/miscdrv_rdwr.c:242 [miscdrv_rdwr]close_miscdrv_rdwr =_ " filename: �42%s�42�12"
<…>/miscdrv_rdwr.c:239 [miscdrv_rdwr]close_miscdrv_rdwr =_ "%03d) %c%s%c:%d | %c%c%c%u /* %s() */�12"
[...]
#
Clearly, the dynamic debug control is aware that our module has debug prints. It's currently off, the flags value of =_ proving this (for readability, I've truncated the pathname and shown only the first few lines of output).
Now let's set it up such that any and all debug prints from our miscdrv_rdwr kernel module will get logged via the dynamic debug framework:
# echo –n "module miscdrv_rdwr +p" > /proc/dynamic_debug/control
You'll need to do this only once per session. The value is retained until the module is removed or a power cycle (or reboot) occurs. Now let's retry the grep command. The following screenshot shows our setting the debug prints on – by using the +p flags specifier syntax, the subsequent grep shows that this has been noticed and set up:

Figure 3.6 – Screenshot showing setting on of debug prints for our miscdrv_rdwr module
Let's reprint and study the first line of output:
# grep "miscdrv_rdwr" /proc/dynamic_debug/control
<…>/miscdrv_rdwr.c:303 [miscdrv_rdwr]miscdrv_rdwr_init =p "A sample print via the dev_dbg(): driver initialized�12"
This shows us the following:
- Source line 303 is a debug print callsite. It also shows the source file pathname, the module and the function name, and then the actual print format string.
- More importantly, between the function name and the format string, you can see =p. This implies of course that this debug print's callsite is known and, when this line of code is hit at runtime, the print will be emitted and logged!
To verify that this works, let's exercise our driver a bit (lazy fellow):

Figure 3.7 – Dynamic debug in action!
It works indeed! The preceding screenshot clearly shows the debug printks have actually run and been logged.
Now let's turn it off:
# echo –n "module miscdrv_rdwr -p" > /proc/dynamic_debug/control
# grep "miscdrv_rdwr" /proc/dynamic_debug/control |head -n1
<…>/miscdrv_rdwr.c:303 [miscdrv_rdwr]miscdrv_rdwr_init =_ "A sample print via the dev_dbg(): driver initialized�12"
And let's retry it:
# echo "DEBUG undefined, dynamic debug now OFF for this module" > /dev/llkd_miscdrv_rdwr
# dmesg
[…]
[ 1010.813777] misc llkd_miscdrv_rdwr: filename: "/dev/llkd_miscdrv_rdwr"
As expected, no debug prints have appeared (the one in the log is the earlier one – see the timestamp).
One more experiment: we turn on the display of the module name (m) and thread context PID (t: shows the thread PID that runs this driver code in process context):
# echo –n "module miscdrv_rdwr +ptm" > /proc/dynamic_debug/control
Write to the device node and check dmesg:
# echo "DEBUG undefined, dynamic debug now ON for this module" > /dev/llkd_miscdrv_rdwr
# dmesg
[…]
[ 1010.813777] misc llkd_miscdrv_rdwr: filename: "/dev/llkd_miscdrv_rdwr"
[ 1457.376915] [1080] miscdrv_rdwr: miscdrv_rdwr:open_miscdrv_rdwr(): 001) bash :1080 | ...0 /* open_miscdrv_rdwr() */
[ 1457.376931] [1080] miscdrv_rdwr: misc llkd_miscdrv_rdwr: opening "/dev/llkd_miscdrv_rdwr" now; wrt open file: f_flags = 0x8241
[…]
#
Aha! This time you can see the PID of the thread that performed the write in square brackets ([1080] it's in fact the PID of our bash shell, as echo is a bash built-in!) followed by the name of the module.
Super – you now know how to activate and deactivate debug prints on a production system using the kernel's dynamic debug framework.
Activating debug prints at boot and module init
It's important to realize that any debug prints within the early kernel initialization (boot) code paths or the initialization code of a kernel module, will not automatically be enabled. To enable them, do the following:
- For core kernel code and any built-in kernel modules, that is, for activating debug prints during boot, pass the kernel command-line parameter dyndbg="QUERY" or module.dyndbg="QUERY", where QUERY is the dynamic debug syntax (explained earlier). For example, dyndng="module myfoo* +pmft" will activate all debug prints within the kernel modules named myfoo* with the display as set by the flags specifier pmft.
- To activate debug prints at kernel module initialization, that is, when modprobe myfoo is invoked (by systemd, perhaps), there are several ways, by passing along module parameters (with examples):
- Via /etc/modprobe.d/*.conf (put this in the /etc/modprobe.d/myfoo.conf file): options myfoo dyndbg=+pmft
- Via the kernel command line: myfoo.dyndbg="file myfoobar.c +pmf; func goforit +mpt"
- Via parameters to modprobe itself: modprobe myfoo dyndbg==pmft (this, the = and not the +, overrides any previous settings!)
Interesting: dyndbg is an always-available kernel module parameter, even though you don't see it (even in /sys/module/<modname>/parameters). You can see it by grepping the dynamic debug control file or /proc/cmdline.
(FYI, details on passing parameters to and auto-loading kernel modules have been fully covered in my earlier Linux Kernel Programming book.)
The official kernel documentation on dynamic debug is indeed very complete; be sure to have a look: https://www.kernel.org/doc/html/latest/admin-guide/dynamic-debug-howto.html#dynamic-debug.
Kernel boot-time parameters
As an important aside, the kernel has an enormous (and useful!) number of kernel parameters that can be optionally passed to it at boot (via the bootloader). See the complete list here in the documentation: The kernel's command-line parameters: https://www.kernel.org/doc/html/v5.10/admin-guide/kernel-parameters.html (here, we've shown the link for the 5.10 kernel documentation).
While on the topic of the kernel command line, several other useful options with regard to printk-based debugging exist, enabling us to enlist the kernel's help for debugging issues concerned with kernel initialization. For example, the kernel provides the following parameters in this regard (taken directly from the link):
debug
[KNL] Enable kernel debugging (events log level).
[...]
initcall_debug
[KNL] Trace initcalls as they are executed. Useful for working out where the kernel is dying during startup.
[...]
ignore_loglevel
[KNL] Ignore loglevel setting - this will print /all/ kernel messages to the console. Useful for debugging. We also add it as printk module parameter, so users could change it dynamically, usually by /sys/module/printk/parameters/ignore_loglevel.
Useful indeed – do try them out! The sheer volume of information posted is surprising at first; try to carefully and patiently analyze it.
We're almost done here. Let's complete this chapter with some miscellaneous but useful printk-related logging functions and macros.
Remaining printk miscellany
By now, you're familiar with most of the typical and pragmatic means to leverage the kernel's powerful and ubiquitous printk and its related APIs, macros, and frameworks. Of course, innovation never stops (especially in the open source universe). The community has come up with more and more ways (and tooling) to use this simple and powerful tool. Without claiming to cover absolutely everything, here's what I think is the remaining and relevant tooling to do with the printk that we haven't had a chance to cover until now. Do check it out – it will probably turn out to be useful one day!
Printing before console init – the early printk
You understand that the printk output can be sent to the console device of course (we covered this in the Understanding where the printk output goes section(see Table 3.1). By default, on most systems, it's configured such that all printk messages of log level 3 and below (<4) are auto-routed to the console device as well (in effect, all kernel printks emitted at log levels emerg/alert/crit/err will find their way to the console device).
What exactly is the console device?
Before going any further, it's useful to understand what exactly the console device is... Traditionally, the console device is a pure kernel feature, the initial Terminal window that the superuser logs into (/dev/console) in a non-graphical environment. Interestingly, on Linux, we can define several consoles – a teletype terminal (tty) window (such as /dev/console), a text-mode VGA, a framebuffer, or even a serial port served over USB (this being common on embedded systems during development).
For example, when we connect a Raspberry Pi to an x86_64 laptop via a USB-to-RS232 TTL UART (USB-to-serial) cable (see the Further reading section of this chapter for a blog article on this very useful accessory and how to set it up on the Raspberry Pi!) and then use minicom(1) (or screen(1)) to get a serial console, this is what shows up as the tty device – it's the serial port:
rpi # tty
/dev/ttyS0
Now, what's the problem? Let's find out!
Early init – the issue and a solution
Via the printk, you can send messages to the console (and kernel log). Yes, but think about this: very early in the boot process when the kernel is initializing itself, the console device isn't ready, it's not initialized, and thus can't be used. Obviously, for any printk emitted at this early boot time, their output can't be seen on the screen – the console (even though it may be logged within the kernel log buffer, but we don't yet have a shell to look it up).
Pretty often (especially during things such as embedded board bring-up), hardware quirks or failures can cause the boot to hang, endlessly probe for some non-existent or faulty device, or even crash! The frustrating thing is that these issues become hard to debug (to say the least!) in the absence of console – printk – output, which, if visible, can instrument the kernel's boot process and pretty clearly show where the issue(s) is occurring (recall the kernel command-line parameters debug and initcall_debug can be really useful at times like this – look back at the Kernel boot-time parameters section if you need to).
Well, as we know, necessity is the mother of invention: the kernel community came up with a possible solution to this issue – the so-called early printk. With it configured, kernel printks are still able to be sent to the console device. How? Well, it's pretty arch and device-specific, but the broad and typical idea is that bare minimal console initialization is performed (this console device is called the early_console) and the string to be displayed on it is literally bit-banged out over a serial line one character at a time within a loop (with typical bitrates ranging between 9,600 and 115,200 bps).
To make use of the facility involves doing three things:
- Configure and build the kernel to support the early printk (set CONFIG_EARLY_PRINTK=y), one time only.
- Boot the target kernel with the appropriate kernel command-line parameter – earlyprintk=<value>.
- The API to use to emit the early printk is called early_printk(); the syntax is identical to that of printf().
Let's check out each of the above points briefly, first, configuring the kernel for early printk.
The kernel config for this feature tends to be arch-dependent. On an x86, you'll have to configure the kernel with CONFIG_EARLY_PRINTK=y (it's under the Kernel Hacking | x86 Debugging | Early printk menu). Optionally, you can enable early printk via a USB debug port. The file that forms the UI – the menu system – for the kernel config (via the usual make menuconfig) for the kernel debug options is the file arch/x86/Kconfig.debug. We'll show a snippet of it here – the section where the early printk menu option is:

Figure 3.8 – Screenshot showing the early printk portion of the Kconfig.debug file
Reading the help screen shown here is indeed helpful! As it says, this option isn't recommended by default as the output isn't well-formatted and can interfere with normal logging. You're typically only to use it to debug an early init issue. (If interested, you'll find the details on the kernel's Kconfig grammar and usage in my earlier Linux Kernel Programming book.)
On the other hand, on an ARM (AArch32) system, the kernel config option is under Kernel Hacking | Kernel low-level debugging functions (read help!) with the config option being called CONFIG_DEBUG_LL. As the kernel clearly insists, let's read the help screen:

Figure 3.9 – Screenshot showing the make menuconfig UI menu for early printk on ARM-32
Do take note of what it says! Further, the sub-menu following it allows you to configure the low-level debug port (it's set to the EmbeddedICE DCC channel by default; you can change it to a serial UART if you have one available).
Okay, that's as far as kernel config goes, a one-time thing. Next, enable it by passing the appropriate kernel command-line parameter – earlyprintk=<value>. The official kernel documentation shows all possible ways to pass it (here: https://www.kernel.org/doc/html/latest/admin-guide/kernel-parameters.html):
earlyprintk= [X86,SH,ARM,M68k,S390]
earlyprintk=vga
earlyprintk=sclp
earlyprintk=xen
earlyprintk=serial[,ttySn[,baudrate]]
earlyprintk=serial[,0x...[,baudrate]]
earlyprintk=ttySn[,baudrate]
earlyprintk=dbgp[debugController#] earlyprintk=pciserial[,force],bus:device.function[,baudrate
earlyprintk=xdbc[xhciController#]
(The remaining paragraphs of the kernel doc are useful to read as well.)
An optional keep parameter can be appended implying that printk messages sent via the early printk facility aren't disabled even after the VGA subsystem (or whatever the real console is) begins to function. Once the earlyprintk= parameter is passed, the kernel is primed to use it (essentially redirecting printk onto a serial, VGA, or whatever console you specified via this parameter). To emit a print, simply invoke the early_printk() API. Here's an example within the kernel code base:
// kernel/events/core.c
if (!irq_work_queue(&perf_duration_work)) { early_printk("perf: interrupt took too long (%lld > %lld), lowering ""kernel.perf_event_max_sample_rate to %d ",
__report_avg, __report_allowed,
sysctl_perf_event_sample_rate);
}
What we've described above is mostly the arch-independent stuff. As an example, (only) on the x86, you can leverage a USB debug port (provided your system has one), as follows. Pass the kernel command-line parameter earlyprintk=dbgp. Note that it requires a USB debug port on the (x86) host system and a NetChip USB2 debug port key/cable (to connect to the client or target system). The kernel documentation details this facility here: https://www.kernel.org/doc/html/latest/x86/earlyprintk.html#early-printk.
Designating the printk to some known presets
The kernel provides macros that give you the ability to prefix – and thus designate – a printk as a firmware bug or warning, a hardware error, a message regarding a deprecated feature, and so on. This is specified via some kernel-defined macros. The value of the macro – a string (for example, "[Firmware Bug]: ") – is what will be prefixed to the message you're emitting:
// include/linux/printk.h
#define FW_BUG "[Firmware Bug]: "
#define FW_WARN "[Firmware Warn]: "
#define FW_INFO "[Firmware Info]: "
[…]
/*
* HW_ERR
* Add this to a message for hardware errors, so that user can report it to hardware vendor instead of LKML or software vendor.
*/
#define HW_ERR "[Hardware Error]: "
/*
* DEPRECATED
* Add this to a message whenever you want to warn userspace about the use of a deprecated aspect of an API so they can stop using it
*/
#define DEPRECATED "[Deprecated]: "
Be sure to read the useful comments atop each of these.
An example or two of their usage follows:
// drivers/acpi/thermal.c
static int acpi_thermal_trips_update(struct acpi_thermal *tz, int flag)
{[…]
/*
* Treat freezing temperatures as invalid as well; some
* BIOSes return really low values and cause reboots at startup. Below zero (Celsius) values clearly aren't right for sure..
[…] */
} else if (tmp <= 2732) {pr_warn(FW_BUG "Invalid critical threshold (%llu) ", tmp);
Here's another example of a printk issuing a deprecated warning (notice the use of rate-limiting as well!):
// net/batman-adv/debugfs.c
pr_warn_ratelimited(DEPRECATED "%s (pid %d) Use of debugfs file "%s".
%s", current->comm, task_pid_nr(current), name, alt);
Let's move along to the next point...
Printing exactly once
To emit a printk exactly once, use the macro printk_once(). It guarantees it will emit the message exactly once, no matter how many times you call it (thus making it similar to macros such as WARN_[ON]_ONCE()).
As with the usual pr_*() macros, their equivalents are defined for printing a message exactly once: pr_*_once(). The wildcard * is replaced by the usual log levels (emerg, alert, crit, err, warn, notice, info, and debug).
The IPv4 TCP code has an example of using pr_err_once():
// net/ipv4/tcp.c
[...]
if (unlikely(TCP_SKB_CB(skb)->tcp_flags & TCPHDR_SYN))
pr_err_once("%s: found a SYN, please report !
", __func__); [...]
Driver authors: you'll realize that the equivalent macros exist in include/linux/dev_printk.h. You're expected to use the dev_*_once() (in place of the pr_*_once()) macros. As one example, this i.MX53 Real Time Clock (RTC) chip driver uses it:
// drivers/rtc/rtc-mxc_v2.c
if (!--timeout) {dev_err_once(dev, "SRTC_LPSCLR stuck! Check your hw. ");
return;
Then – again, dear driver authors, do take note - there's the dev_WARN() and dev_WARN_ONCE() macros; the kernel comment explains it clearly:
// include/linux/dev_printk.h
/*
* dev_WARN*() acts like dev_printk(), but with the key difference of using WARN/WARN_ONCE to include file/line information and a backtrace.
*/
Do think before using these [pr|dev]_*_once() macros; they're to be used when you want to emit a message exactly once.
Exercise
How many instances of using dev_WARN_ONCE() can you find within the 5.10.60 kernel code base? (Tip: use cscope!)
Emitting a printk from userspace
Testing is a critical part of the SDLC. While testing, it's often the case that you will run an automated batch (or suite) of test cases via a script. Now, say that your test (bash) script has initiated a test on your driver by invoking something like this:
echo "test data 123<...>" > /dev/mydevnode
That's fine, but you'd like to see the point at which the script initiated some action within our kernel module, by printing out a certain distinct (signature) message. As a concrete example, say we want the log to look something like this:
my_test_script:------------- start testcase 1
my_driver_module:
msg1, ..., msgn, msgn+1, ..., msgn+m
my_test_script:------------- end testcase 1
[...]
You can have your userspace test script write a message into the kernel log buffer, just like a kernel printk would, by writing the given message into the character device file /dev/kmsg:
sudo bash -c "echo "my_test_script: start testcase 1" > /dev/kmsg"
(Note how we code it to run with root access.)
The message written to the kernel log via the special /dev/kmsg device file will be printed at the current default log level, typically, 4: KERN_WARNING. We can override this by actually prefixing the message with the required log level (as a number in string format, within angle brackets). For example, to write from the userspace into the kernel log at log level 6:KERN_INFO, use this:
sudo bash -c "echo "<6>my_test_script: start testcase 1" > /dev/kmsg"
$ sudo dmesg --decode |tail -n1
user :info : [33561.862960] my_test_script: start testcase 1
Notice how I used the --decode option to dmesg to provide more human-readable output. Also, you can see that our latter message is emitted at log level 6 as specified within the echo statement.
There is really no way to distinguish between a user-generated kernel message and a kernel one generated by printk(); they look identical. So, of course, it could be as simple as prefixing some special signature byte or string within the message, such as @myapp@, in order to help you distinguish these user-generated prints from the kernel ones.
Easily dumping buffer content
Once, when working on a network driver, I wrote C code to quite painstakingly dump the content of the Ethernet (link) header, IP header, and so on, in order to analyze and understand exactly how things were working... My code did the typical thing: within a loop, dump each byte of the header structure, printing it in hexadecimal (and, if you're feeling adventurous, when printable, in ASCII as well on the right side). Sure, we can do these things, but don't waste time – the kernel provides!
The macro, print_hex_dump_bytes() is there for precisely this kind of work; it's a wrapper over a similar macro. The comments within its code clearly show you the meaning of each of its four parameters, and thus how to use it to efficiently dump memory buffer content:
// include/linux/printk.h
/**
* print_hex_dump_bytes - shorthand form of print_hex_dump() with default params
* @prefix_str: string to prefix each line with; caller supplies trailing spaces for alignment if desired
* @prefix_type: controls whether prefix of an offset, address, or none is printed (%DUMP_PREFIX_OFFSET, %DUMP_PREFIX_ADDRESS, %DUMP_PREFIX_NONE)
* @buf: data blob to dump
* @len: number of bytes in the @buf
* Calls print_hex_dump(), with log level of KERN_DEBUG, rowsize of 16, groupsize of 1, and ASCII output included.
*/
#define print_hex_dump_bytes(prefix_str, prefix_type, buf, len)
print_hex_dump_debug(prefix_str, prefix_type, 16, 1, buf, len, true)
Great, but why does the macro invoke the debug version? Ah, it's tied into the kernel's dynamic debug circuitry! Thus (as we already mentioned in the Using the kernel's powerful dynamic debug feature section), every print_hex_dump_debug() and print_hex_dump_bytes() callsite is able to be dynamically toggled via the dynamic debug control file. Useful!
Here's an example of this macro in action (within a Qualcomm wireless network driver):
// drivers/net/wireless/ath/ath6kl/debug.c
void ath6kl_dbg_dump(enum ATH6K_DEBUG_MASK mask,
const char *msg, const char *prefix,
const void *buf, size_t len)
{ if (debug_mask & mask) {if (msg)
            ath6kl_dbg(mask, "%s
", msg);
print_hex_dump_bytes(prefix,
DUMP_PREFIX_OFFSET, buf, len);
}
[…]
There – all done! Well, no, it's never actually all done, is it...?
Remaining points – bootloader log peeking, LED flashing, and more
A common problem when debugging kernel crashes is that once the kernel has crashed or panicked, the system is unusable (typically hung). Reading the kernel log will almost certainly help in debugging the (root) cause... But – I'm sure you see this – how can we see the kernel log if the system is hung?! Moreover, there's no iron-clad guarantee that the log data has been flushed from RAM into non-volatile log files before the system went into a tailspin...
For these reasons, more exotic debug techniques are required at times. One of them is this: after the system hangs (or panics), "warm" boot or reset back into the bootloader prompt (this is assuming that there is a way to do so – let's assume there is).
Warm Reset – How?
A warm reset or reboot is one where the board reboots but RAM content is preserved. I once worked on a prototyping project on a TI PandaBoard. It had a soft reset button; pressing it led to the board performing a warm reboot.
The PC's Ctrl + Alt + Delete (the famous "three-finger salute" – the temptation to say "read between the lines" and put in a smiley here is great!) is the equivalent... But that's typically not configured on Linux; you can use the kernel's Magic SysRq facility (again, assuming it's so configured) to do so (fear not, we shall cover this in Chapter 10, Kernel Panic, Lockups, and Hangs, in the What's this Magic SysRq thingy anyway? section).
Once at the bootloader prompt, use its intelligence to dump the kernel log buffer memory region and you will see the kernel printks! (For example, many embedded systems use the powerful and elegant Das U-Boot as their bootloader; the command to dump a memory region is memory display (md).) Hang on though – a key point: even if you know the kernel log buffer address (that's easy: just do sudo grep __log_buf /proc/kallsyms to get it), it's not a physical address; it's a kernel virtual address. You will first have to figure out how to translate it to its physical counterpart – as that's all the bootloader sees. This is typically done by referring to the Technical Reference Manual (TRM) for the board or platform you're working on. Once you have the physical address, simply issue the md (or equivalent – GRUB has the dump command) command to dump the memory content. You will, in effect, see the kernel log!
I refer you to a few actual examples in this (older but excellent) information here: https://elinux.org/Debugging_by_printing#Debugging_early_boot_problems).
Flashing LEDs to debug
Sometimes, especially during the very early stages of board bring-up and likewise, all we really need to know is that some line of code got executed. You can do this by toggling an LED on/off or flashing it as lines of code are hit! Developers at times go to the extent of rigging up the system's GPIO pins (or equivalent) to do so and insert custom code in the kernel to trigger the LED. This is really nothing new – it's the poor man's printf.
(Interestingly, the Raspberry Pi does precisely this when it can't boot – it flashes an onboard LED a given number of times (short and long flashes)... Here's the documentation that explains how to interpret the LED flashes and thus understand what's causing the boot issue: https://www.raspberrypi.com/documentation/computers/configuration.html#led-warning-flash-codes).
Even better, you could perhaps even rig up a device such as the OLED display mentioned earlier to display debug messages. Of course, this will require that I2C initialization has been performed.
Another thing: you may have heard of the kernel's netconsole facility. Isn't that something to delve into? It certainly is – netconsole is a powerful thing, a means to send kernel printks across a network to a target system, which will store it for later perusal! (We cover it here: Chapter 7, Oops! Interpreting the Kernel Bug Diagnostic, in the An Oops on an ARM Linux system and using netconsole section; keep a keen eye out!).
Summary
Good going! You've just completed the first of many techniques for debugging the kernel. Instrumentation, though deceptively simple, almost always proves to be a useful and powerful debugging technique.
In this chapter, you began by learning the basics regarding the ubiquitous kernel printk(), pr_*(), and dev_*() routines and macros. We then went into more detail about the specific use of these routines to help in debug situations and tips and tricks that will prove useful in debugging your (driver) modules... This included leveraging the kernel's ability to rate-limit printks, often a necessity on high-volume code paths.
The kernel's elegant and powerful dynamic debug framework was the highlight of this chapter. Here, you learned about it, and how to leverage it to be able to toggle your (and indeed the kernel's) debug prints even on production systems, with virtually no performance degradation when turned off.
We finished this chapter with a few remaining uses of printk macros that are sure to prove useful at some point in your kernel/driver journeys.
With these tools in hand, we'll move on to another powerful technology in the coming chapter: the kernel's kprobes framework where we'll of course focus on using it to aid us to debug things, primarily via the instrumentation approach. See you there!
Further reading
- Code browser tutorials:
- Ctags Tutorial: https://courses.cs.washington.edu/courses/cse451/10au/tutorials/tutorial_ctags.html
- The Vim/Cscope tutorial: http://cscope.sourceforge.net/cscope_vim_tutorial.html
- The printk and /dev/kmsg: https://www.kernel.org/doc/Documentation/ABI/testing/dev-kmsg
- Debugging by printing: https://elinux.org/Debugging_by_printing; covers useful info on debugging with the early printk facility, even debugging by dumping the kernel log from the bootloader as well!
- Signing kernel modules; official kernel documentation: Kernel module signing facility: https://www.kernel.org/doc/html/v5.0/admin-guide/module-signing.html#kernel-module-signing-facility
- Red Hat Developer series on GDB:
- The GDB developer's GNU Debugger tutorial, Part 1: Getting started with the debugger, Seitz, RedHat Developer, Apr 2021: https://developers.redhat.com/blog/2021/04/30/the-gdb-developers-gnu-debugger-tutorial-part-1-getting-started-with-the-debugger#
- The GDB developer's GNU Debugger tutorial, Part 2: All about debuginfo, Seitz, RedHat Developer, Jan 2022: https://developers.redhat.com/articles/2022/01/10/gdb-developers-gnu-debugger-tutorial-part-2-all-about-debuginfo
- Printf-style debugging using GDB, Part 3, Buettner, RedHat Developer, Dec 2021: https://developers.redhat.com/articles/2021/12/09/printf-style-debugging-using-gdb-part-3#
- Dynamic debug:
- Official kernel doc: Dynamic debug: https://www.kernel.org/doc/html/latest/admin-guide/dynamic-debug-howto.html#dynamic-debug
- The dynamic debugging interface, Jon Corbet, LWN, March 2011: https://lwn.net/Articles/434833/