Monitoring and Analysis Tools
Linux, like most versions of Unix, is known for its well-rounded command set for real-time troubleshooting and monitoring. A good knowledge of the commands covered in Chapter 7, “Kernel Support Tools,” combined with the network analysis tools covered here will ensure that you administer better operating networks.
Network monitoring and analysis tools should not only be useful to the network administrator, but also to network operations center technicians and management.
Simple Network Management Protocol Overview (SNMP)
SNMP was designed to provide an open protocol and means to configure, manage, and monitor network nodes. SNMP is used generically to refer to one of the three commonly used versions: 1, 2, and 3.Versions 1 and 2 are widely supported with version 3 support increasing. The SNMP Internet Engineering Task Force approved version 3 as a draft standard in March 1999.
SNMP Topology
SNMP defines a topology referred to as a network management system.The network management system includes the manager that interacts with the network management station and network nodes. The management system is used to manage and monitor nodes that are referred to as managed devices.
The managed device then includes the SNMP application stack, the agent in SNMP terminology (which acts as the interface to the managed devices’ objects), and the UDP and IP layers of the protocol stack. Figure 15.1 shows the logical view of a network management system.
Figure 15.1. Network management system.

SNMP messages between the manager and agent identify the objects that are being managed using a management information base (MIB), with the current and most widely deployed MIB being version 2, known as MIB-II. It is defined in RFC 1213, “Management Information Base for Network Management of TCP/IP-based internets: MIB-II.” The MIB is a tree structure used to identify the data (statistics, counters, interface status, and so on) that is being used by the network node. Figure 15.2 shows the MIB tree for MIB-II.
Figure 15.2. MIB-II.

Notice that each leaf, which is referred to as an SNMP object, is identified by its location in the MIB tree.Therefore, eth0 on a Linux node can be identified as:
.iso.org.dod.internet.mgmt.mib-2.interfaces.ifTable.ifEntry.ifIndex.2
eth0 also can be identified using the object ID equivalent of the one just listed. Here part of the tree is shown using the object IDs:
.1.3.6.1.2.1.2.ifTable.ifEntry.ifIndex.2
When using MIB-II, most SNMP packages enable the user to specify only within the MIB-II tree, so:
.iso.org.dod.internet.mgmt.mib-2.interfaces.eth0
also can be identified as:
interfaces.ifTable.ifEntry.ifIndex.2
SNMP Communication
SNMP defines five message types for communicating between the manager and agent: get, get next, set, response, and trap.
The GET, GET NEXT, and SET commands are all issued from the manager to the agent. The GET command is used to poll the specific value of a specific object within the agent’s MIB structure. The GET NEXT tells the agent to poll the next value within the MIB structure. The SET is used by the manager to tell the agent to set a particular object’s value to the value transmitted by the manager.
The RESPONSE message is an agent that manages communication and is sent in response to the GET, GET NEXT, and SET commands.
The TRAP message is the only SNMP messaging initiated by the agent and is used to send an alarm message to the manager. For example, should an interface lose physical connectivity, the agent typically sends a TRAP message with the appropriate object identification (OID) identified in the TRAP message.
Use of these commands using Linux command-line tools is covered in the next section.
SNMP Authentication
Because SNMP can be used to monitor and manage network nodes, some means of security is required to ensure that network nodes cannot easily be compromised.
SNMP defines two access levels of security: public and private.The public level is granted read-only access to the node, and the private is given full control of the node (read and write). Unfortunately, these levels are passed in clear text.
SNMP Security The SNMP Internet Engineering Task Force did seek to improve the security with version 2 of the protocol, but the members could not agree on the security requirements, which caused two spin-offs of version 2 with some of the security requirement left to be created: V2u and V2c. The version 3 working group is trying to fix this weakness with a standards track specification (see html.charters/snmpv3-charter.html). http://www.ietf.org/ |
SNMP on Linux
SNMP for Linux was previously supported by two packages: ucd-snmp and the CMU SNMP project. Although both of these packages are still available on the Internet, SNMP development for Linux has moved to the NET-SNMP package.
NET-SNMP
The NET-SNMP package available at http://net-snmp.sourceforge.net/ is the SNMP package known earlier as the ucd-snmp package. The current distribution, 4.2.1, is still referred to as the ucd-snmp package, but all future distributions will be named using the new name. The NET-SNMP package provides an SNMP agent for Linux, an SNMP library, and SNMP command-line tools for issuing SNMP commands and traps.
In addition to supporting the standard MIB-II, the NET-SNMP agent also directly supports monitoring disk usage, as well as provides support to ensure processes are running. The agent will send a trap to the management station when disk usage becomes low or a particular process has stopped executing. The agent also can make use of scripts to add further capabilities to the trap functionality.
The following section provides a brief overview of the installation of NET-SNMP.
Installation To install the NET-SNMP distribution, download the current version of the package as pointed to in the download section of http://net-snmp.sourceforge.net/. At the time of publication of this book, version 4.2.1 is the current version. Place the downloaded distribution in the appropriate place where source files are kept on your Linux system. For this example we use /usr/src/.
The installation should be performed as the root user.
Unzip the tarball distribution:
[root@lefty src]# gunzip ucd-snmp-4.2.1.tar.gz
And untar the tarball:
[root@lefty src]# tar xvf ucd-snmp-4.2.1.tar
Now move into the directory created by untarring the distribution:
[root@lefty src]# cd ucd-snmp-4.2.1
At a minimum, read through the README and INSTALL files for any last minute changes to the installation procedures. The FAQ and NEWS files are also worth taking a look at.
Execute the configure script, which will query your system for various settings— such as which C compiler to use, what libraries are present, and so on:
[root@lefty ucd-snmp-4.2.1]# ./configure
The configure script also will prompt for the name of the contact for the SNMP agent. This is the information the Linux node will return should it be queried via SNMP as soon as the agent is running.
After prompting for the contact name, the configure script will prompt for the geographic location of the Linux node and then the log directory location, which can be customized (or the default of /var/log/snmpd.log can be used).
Finally, the configure script will prompt for the configuration directory. /var/ucd is the default location.
At this point the configure script will create a makefile, so that the make command can be run:
[root@lefty ucd-snmp-4.2.1]# make
To ensure permissions are set correctly, execute:
[root@lefty ucd-snmp-4.2.1]# umask 022
And then have make install the distribution in the appropriate locations:
[root@lefty ucd-snmp-4.2.1]# make install
This will install the distribution into the /usr/local/ directory structure. For this chapter, RedHat 6.1 was used for installation; however, the installation instructions apply to most current distributions. RedHat’s root account has the /usr/local/bin/ and /usr/local/sbin/ in its path, so if your distribution does not have these directories in your path, there are three workarounds:
Add /usr/local/bin/ and /usr/local/sbin/ to the root account. This might not be desirable depending on what other programs are located in these directories and how tight the security is on the box and within the directories.
Use absolute path names when executing the programs. For some advanced features this could require additional parameters to tell the particular SNMP program where to find particular programs.
Install the NET-SNMP package in its own directory and set the path accordingly.
Log out of the root account and log back in. (This will return root’s umask setting back to its original setting.) Then log back in as root.
Should SNMPv3 support be needed, OpenSSL (http//www.openssl.org/) will need to be installed if it is not already present.
The NET-SNMP agent runs as a daemon and is appropriately named snmpd. snmpd uses a configuration file to determine community access strings and trap settings as is expected of an snmp agent. In addition, the snmpd also allows advanced configuration settings such as limiting particular community strings to particular object identifications and limiting manager queries to particular IP addressees.
Before starting snmpd, create the snmpd configuration file: /usr/local/share /snmp/snmpd.conf with the following entries:
#
# snmpd.conf
# example
#
# Access Control Setup

# rwcommunity: a SNMPv1/SNMPv2c read-write access community name
#   arguments:  community [default|hostname|network/bits] [oid]

rwcommunity fullaccess

# rocommunity: a SNMPv1/SNMPv2c read-only access community name
#arguments:  community [default|hostname|network/bits] [oid]

rocommunity readaccess
This is a simple and straightforward snmpd.conf file with only the community strings defined. NET-SNMP uses the field name rwcommunity as the private community string, which is defined as fullaccess in this example.
rocommunity is the public, read-only, community string, defined as readaccess in this example.
Should snmpd be started without the community strings defined, then anyone can query the box via snmp, leaving the box vulnerable to attacks.
Now snmpd can be started:
[root@lefty /root]# snmpd
Assuming all has gone well, the daemon should start and begin listening for requests. The daemon also will create an entry in the log file:
[root@lefty /root]# cat /var/log/snmpd.log
UCD-SNMP version 4.2.1
To get a closer look at how the agent works, we will take a look at the snmp tools that come with NET-SNMP. The command-line tools are not typical managers but rather provide the functionality of the particular messages supported by managers: GET, GET NEXT, and SET.
NET-SNMP Manager Commands The NET-SNMP command-line utilities are snmpget, snmpgetnext, and snmpset and correspond with GET, GET NEXT, and SET. These commands are very useful for network troubleshooting, network management system troubleshooting, and getting a better understanding of SNMP. Additionally, there is the snmpwalk command, which uses the GET NEXT message to retrieve all variables under a specific object identification. The examples that follow use the NET-SNMP tools with the snmpd daemon that was installed with the package and started earlier.
snmpget agent communitystring object-id. The snmpget command will query the designated agent for the specific object-id using the community string specified. (For users of earlier versions of the command-line utilities, notice that the format community, string@agent, is no longer used.)
To get the system uptime, snmpget can be used:
[root@lefty /root]# snmpget 192.168.1.254 readaccess system.sysUpTime.0
system.sysUpTime.0 = Timeticks: (76980) 0:12:49.80
The snmpd agent supports most of the complete MIB-II standard, so there is all sorts of useful information that can be gathered for later analysis or used to check up on a system.
For example, the icmp branch keeps track of icmp traffic. So to determine how many pings (using ICMP-echo) have been received by the host, the following command can be used:
[root@lefty /root]# snmpget 192.168.1.254 readaccess icmp.icmpInEchos.0
icmp.icmpInEchos.0 = Counter32: 43
This shows that the system has received 43 ping packets.
While snmpget cannot replace a well-designed network management system, it does add a tremendous amount of analysis power to an existing network management system, as well as adding flexibility to existing automation tools that monitor system activity.
snmpgetnext agent communitystring object-id. The snmpgetnext can be used to get the next object in the MIB tree as such:
[root@lefty /root]# snmpgetnext 192.168.1.254 readaccess icmp.icmpInEchos.0
icmp.icmpInEchoReps.0 = Counter32: 3
This returns the number of ICMP echo responses the system has received. snmpgetnext functionality is limited to the next entry; whereas, the snmpwalk is much more useful.
snmpwalk agent communitystring object-id. snmpwalk will use SNMP GET NEXT commands until all the variables under the current object identifier are retrieved. This can be useful for creating tables or even finding specific object identifiers when you are not sure of the exact name. For example, the following snmpwalk reports all icmp information maintained:
[root@lefty /root]# snmpwalk 192.168.1.254 readaccess icmp
icmp.icmpInMsgs.0 = Counter32: 12
icmp.icmpInErrors.0 = Counter32: 0
icmp.icmpInDestUnreachs.0 = Counter32: 6
icmp.icmpInTimeExcds.0 = Counter32: 0
icmp.icmpInParmProbs.0 = Counter32: 0
icmp.icmpInSrcQuenchs.0 = Counter32: 0
icmp.icmpInRedirects.0 = Counter32: 0
icmp.icmpInEchos.0 = Counter32: 3
icmp.icmpInEchoReps.0 = Counter32: 3
icmp.icmpInTimestamps.0 = Counter32: 0
icmp.icmpInTimestampReps.0 = Counter32: 0
icmp.icmpInAddrMasks.0 = Counter32: 0
icmp.icmpInAddrMaskReps.0 = Counter32: 0
icmp.icmpOutMsgs.0 = Counter32: 9icmp.
icmpOutErrors.0 = Counter32: 0
icmp.icmpOutDestUnreachs.0 = Counter32: 6
icmp.icmpOutTimeExcds.0 = Counter32: 0
icmp.icmpOutParmProbs.0 = Counter32: 0
icmp.icmpOutSrcQuenchs.0 = Counter32: 0
icmp.icmpOutRedirects.0 = Counter32: 0
icmp.icmpOutEchos.0 = Counter32: 0
icmp.icmpOutEchoReps.0 = Counter32: 3
icmp.icmpOutTimestamps.0 = Counter32: 0
icmp.icmpOutTimestampReps.0 = Counter32: 0
icmp.icmpOutAddrMasks.0 = Counter32: 0
icmp.icmpOutAddrMaskReps.0 = Counter32: 0
Here is an snmpwalk that shows all the data that makes up the IP routing table:
[root@lefty /root]# snmpwalk 192.168.1.254 readaccess ip.ipRouteTable
ip.ipRouteTable.ipRouteEntry.ipRouteDest.0.0.0.0 = IpAddress: 0.0.0.0
ip.ipRouteTable.ipRouteEntry.ipRouteDest.127.0.0.0 = IpAddress: 127.0.0.0
ip.ipRouteTable.ipRouteEntry.ipRouteDest.192.168.1.0 = IpAddress: 192.168.1.0
ip.ipRouteTable.ipRouteEntry.ipRouteDest.192.168.1.254 = IpAddress: 192.168.1.25
4
ip.ipRouteTable.ipRouteEntry.ipRouteIfIndex.0.0.0.0 = 2
ip.ipRouteTable.ipRouteEntry.ipRouteIfIndex.127.0.0.0 = 3
ip.ipRouteTable.ipRouteEntry.ipRouteIfIndex.192.168.1.0 = 2
ip.ipRouteTable.ipRouteEntry.ipRouteIfIndex.192.168.1.254 = 2
ip.ipRouteTable.ipRouteEntry.ipRouteMetric1.0.0.0.0 = 1
ip.ipRouteTable.ipRouteEntry.ipRouteMetric1.127.0.0.0 = 0
ip.ipRouteTable.ipRouteEntry.ipRouteMetric1.192.168.1.0 = 0
ip.ipRouteTable.ipRouteEntry.ipRouteMetric1.192.168.1.254 = 0
ip.ipRouteTable.ipRouteEntry.ipRouteNextHop.0.0.0.0 = IpAddress: 192.168.1.1
ip.ipRouteTable.ipRouteEntry.ipRouteNextHop.127.0.0.0 = IpAddress: 0.0.0.0
ip.ipRouteTable.ipRouteEntry.ipRouteNextHop.192.168.1.0 = IpAddress: 0.0.0.0
ip.ipRouteTable.ipRouteEntry.ipRouteNextHop.192.168.1.254 = IpAddress: 0.0.0.0
ip.ipRouteTable.ipRouteEntry.ipRouteType.0.0.0.0 = indirect(4)
ip.ipRouteTable.ipRouteEntry.ipRouteType.127.0.0.0 = direct(3)
ip.ipRouteTable.ipRouteEntry.ipRouteType.192.168.1.0 = direct(3)
ip.ipRouteTable.ipRouteEntry.ipRouteType.192.168.1.254 = direct(3)
ip.ipRouteTable.ipRouteEntry.ipRouteProto.0.0.0.0 = local(2)
ip.ipRouteTable.ipRouteEntry.ipRouteProto.127.0.0.0 = local(2)
ip.ipRouteTable.ipRouteEntry.ipRouteProto.192.168.1.0 = local(2)
ip.ipRouteTable.ipRouteEntry.ipRouteProto.192.168.1.254 = local(2)
ip.ipRouteTable.ipRouteEntry.ipRouteMask.0.0.0.0 = IpAddress: 0.0.0.0
ip.ipRouteTable.ipRouteEntry.ipRouteMask.127.0.0.0 = IpAddress: 255.0.0.0
ip.ipRouteTable.ipRouteEntry.ipRouteMask.192.168.1.0 = IpAddress: 255.255.255.0
ip.ipRouteTable.ipRouteEntry.ipRouteMask.192.168.1.254 = IpAddress: 255.255.255.
255
ip.ipRouteTable.ipRouteEntry.ipRouteInfo.0.0.0.0 = OID: .ccitt.zeroDotZero
ip.ipRouteTable.ipRouteEntry.ipRouteInfo.127.0.0.0 = OID: .ccitt.zeroDotZero
ip.ipRouteTable.ipRouteEntry.ipRouteInfo.192.168.1.0 = OID: .ccitt.zeroDotZero
ip.ipRouteTable.ipRouteEntry.ipRouteInfo.192.168.1.254 = OID: .ccitt.zeroDotZero
[root@lefty /root]# snmpwalk 192.168.1.254 readaccess ip.ipRouteTable
ip.ipRouteTable.ipRouteEntry.ipRouteDest.0.0.0.0 = IpAddress: 0.0.0.0
ip.ipRouteTable.ipRouteEntry.ipRouteDest.127.0.0.0 = IpAddress: 127.0.0.0
ip.ipRouteTable.ipRouteEntry.ipRouteDest.192.168.1.0 = IpAddress: 192.168.1.0
ip.ipRouteTable.ipRouteEntry.ipRouteDest.192.168.1.254 = IpAddress: 192.168.1.25
4
ip.ipRouteTable.ipRouteEntry.ipRouteIfIndex.0.0.0.0 = 2
ip.ipRouteTable.ipRouteEntry.ipRouteIfIndex.127.0.0.0 = 3
ip.ipRouteTable.ipRouteEntry.ipRouteIfIndex.192.168.1.0 = 2
ip.ipRouteTable.ipRouteEntry.ipRouteIfIndex.192.168.1.254 = 2
ip.ipRouteTable.ipRouteEntry.ipRouteMetric1.0.0.0.0 = 1
ip.ipRouteTable.ipRouteEntry.ipRouteMetric1.127.0.0.0 = 0
ip.ipRouteTable.ipRouteEntry.ipRouteMetric1.192.168.1.0 = 0
ip.ipRouteTable.ipRouteEntry.ipRouteMetric1.192.168.1.254 = 0
ip.ipRouteTable.ipRouteEntry.ipRouteNextHop.0.0.0.0 = IpAddress: 192.168.1.1
ip.ipRouteTable.ipRouteEntry.ipRouteNextHop.127.0.0.0 = IpAddress: 0.0.0.0
ip.ipRouteTable.ipRouteEntry.ipRouteNextHop.192.168.1.0 = IpAddress: 0.0.0.0
ip.ipRouteTable.ipRouteEntry.ipRouteNextHop.192.168.1.254 = IpAddress: 0.0.0.0
ip.ipRouteTable.ipRouteEntry.ipRouteType.0.0.0.0 = indirect(4)
ip.ipRouteTable.ipRouteEntry.ipRouteType.127.0.0.0 = direct(3)
ip.ipRouteTable.ipRouteEntry.ipRouteType.192.168.1.0 = direct(3)
ip.ipRouteTable.ipRouteEntry.ipRouteType.192.168.1.254 = direct(3)
ip.ipRouteTable.ipRouteEntry.ipRouteProto.0.0.0.0 = local(2)
ip.ipRouteTable.ipRouteEntry.ipRouteProto.127.0.0.0 = local(2)
ip.ipRouteTable.ipRouteEntry.ipRouteProto.192.168.1.0 = local(2)
ip.ipRouteTable.ipRouteEntry.ipRouteProto.192.168.1.254 = local(2)
ip.ipRouteTable.ipRouteEntry.ipRouteMask.0.0.0.0 = IpAddress: 0.0.0.0
ip.ipRouteTable.ipRouteEntry.ipRouteMask.127.0.0.0 = IpAddress: 255.0.0.0
ip.ipRouteTable.ipRouteEntry.ipRouteMask.192.168.1.0 = IpAddress: 255.255.255.0
ip.ipRouteTable.ipRouteEntry.ipRouteMask.192.168.1.254 = IpAddress: 255.255.255.
255
ip.ipRouteTable.ipRouteEntry.ipRouteInfo.0.0.0.0 = OID: .ccitt.zeroDotZero
ip.ipRouteTable.ipRouteEntry.ipRouteInfo.127.0.0.0 = OID: .ccitt.zeroDotZero
ip.ipRouteTable.ipRouteEntry.ipRouteInfo.192.168.1.0 = OID: .ccitt.zeroDotZero
ip.ipRouteTable.ipRouteEntry.ipRouteInfo.192.168.1.254 = OID: .ccitt.zeroDotZero
snmpset agent privatecommunitytstring object-id type value. The snmpset uses the SNMP SET message to set objects values to a particular value. For example, to change the system contact, the following snmpset command can be used:
[root@lefty apps]# snmpset 192.168.1.254 fullaccess system.sysContact.0 s
[email protected]
In the preceding example, the s is the type of value being assigned, which must match the type supported by the object.The s stands for “string.” The types supported by the snmpset command are listed in Table 15.1.
| Type Abbreviation | Meaning |
|---|---|
| a | IP Address in xxx.xxx.xxx.xxx format |
| b | Bits |
| d | Decimal |
| i | Integer |
| n | Null Object |
| o | Object Identifier |
| s | String |
| t | Time Ticks |
| u | Unsigned |
| x | Hexadecimal |
The snmpset command requires “private” access to the SNMP agent because actual configuration is being changed. Although a change has been accepted by an SNMP agent, the change may not be saved across a reboot. For example, the NET-SNMP package, like many Unix SNMP packages, has very little support for making permanent changes via SNMP. The previous example showing the change of system contact will be lost during the next restart of snmpd or a system reboot. Router and other network elements’ support of SNMP support varies, so a thorough investigation and testing on a nonproduction system is highly recommended.
Multi–Router Traffic Grapher (MRTG)
MRTG is likely the most popular open source network analysis tool. MRTG uses SNMP get commands to query a router’s interfaces traffic statistics. The results of the get command are then recorded, and the traffic statistics are used to graph the network statistics, which will show trends such as high and low utilization periods, averages, and changes in network patterns.
Specifically, MRTG measures the number of packets sent in and out of an interface, the average number of in and out packets, and the current in and out packets.
MRTG is available for most versions of Unix including Linux. (There is also a Windows version.) MRTG is available at http://www.mrtg.org/, which is a pointer to the original MRTG site at http://people.ee.ethz.ch/∼oetiker/webtools/mrtg/. MRTG makes use of the NET-SNMP package covered in the previous section, so NET-SNMP should be installed and configured before installing MRTG.
Parts of MRTG are written in Perl, so Perl also must be installed on the system. Version 5.05 or later is recommended. Several graphics libraries also are required for MRTG to function correctly, but their installation is beyond the scope of this chapter. Refer to the doc/unix-guide.txt document (in the MRTG source directory covered shortly) for the exact requirements.
MRTG Installation
MRTG should be downloaded from http://people.ee.ethz.ch/oetiker/webtools/mrtg/pub/ and placed in the appropriate directory. For this example, /usr/src/ is used. The current version of MRTG at the time of publication is 2.9.12, which is used here.
After downloading the MRTG package, follow these steps.
Log in as root and move into the directory where the package was downloaded:
[root@lefty /root]# cd /usr/src
Unzip the distribution:
[root@lefty src]# gunzip mrtg-2.9.12.tar.gz
Untar the tarball:
tar xvf mrtg-2.9.12.tar
This will create the MRTG source tree. Move into the source tree:
[root@lefty src]# cd mrtg-2.9.12
Execute the configure script:
[root@lefty mrtg-2.9.12]# ./configure
Execute the make command:
[root@lefty mrtg-2.9.12]# make
Finally, execute the make install:
[root@lefty mrtg-2.9.12]# make install
This will create the installation directory structure, /usr/local/mrtg-2/, and move all the binaries and appropriate files into the directory. Move into the directory structure:
[root@lefty mrtg-2.9.12]# cd /usr/local/mrtg-2/
MRTG needs a directory that is accessible to the web server. A common directory location for HTML documents for the Apache Web Server on Linux is /home/httpd/html/, so the MRTG files can be placed in a subdirectory:
[root@lefty mrtg-2]# mkdir /home/httpd/html/mrtg
Be sure to use an appropriate directory based upon the web server’s configuration. A configuration directory for MRTG also should be created:
[root@lefty mrtg-2]# mkdir cfg
MRTG Configuration
Now MRTG can be configured using the cfgmaker script:
[root@lefty mrtg-2]# bin/cfgmaker - -global 'WorkDir: /home/httpd/html/mrtg' - -
output /usr/local/mrtg-2/cfg/mrtg.cfg [email protected]
The -global option with the parameter WorkDir tells cfgmaker which directory structure to use in the config file, mrtg.cfg, which will be used by the MRTG program, mrtg, to store the files created. The -output parameter tells cfgmaker where to write the configuration information to—in this case /usr/local/mrtg-2/cfg/mrtg.cfg. The final parameter is the public community string and agent being queried.
After the cfgmaker script completes, there will be an mrtg.cfg file in /usr/local/mrtg-2/cfg/, which can be used with the mrtg program to test the setup:
[root@lefty mrtg-2]# /usr/local/mrtg-2/bin/mrtg /usr/local/mrtg-2/cfg/mrtg.cfg Rateup WARNING: /usr/local/mrtg-2/bin/rateup could not read the primary log file for 192.168.1.254_2 Rateup WARNING: /usr/local/mrtg-2/bin/rateup The backup log file for 192.168.1.254_2 was
invalid as well Rateup WARNING: /usr/local/mrtg-2/bin/rateup Can’t remove 192.168.1.254_2.old updating
log file Rateup WARNING: /usr/local/mrtg-2/bin/rateup Can’t rename 192.168.1.254_2.log to 192.168
.1.254_2.old updating log file
The warnings just shown are normal for the first time mrtg is run given that no log files exist. Run the command again:
[root@lefty mrtg-2]# /usr/local/mrtg-2/bin/mrtg /usr/local/mrtg-2/cfg/mrtg.cfg Rateup WARNING: /usr/local/mrtg-2/bin/rateup Can't remove 192.168.1.254_2.old updating logfile
There is only one warning this time. After a third run, the warnings are now cleaned up:
[root@lefty mrtg-2]# /usr/local/mrtg-2/bin/mrtg /usr/local/mrtg-2/cfg/mrtg.cfg
After the three previous executions, MRTG has created some data that can be viewed. By pointing a web browser to the web server’s mrtg directory (http://192.168.1.254/mrtg/), data similar to Figure 15.3 should be seen. (If the graphs are being created but no data is being mapped, then execute the mrtg command just listed several more times.)
Figure 15.3. MRTG web directory.

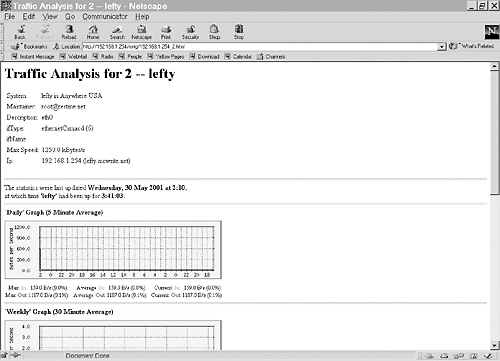
The data is still in somewhat raw format, so click the .html file in the mrtg directory to see the graphic representation of the interface. In this example the file is 192.168.1.254_2.html. The 192.168.1.254 is the interface’s IP address, and the 2 is the interface’s index (the loopback is number 1). The graphic representation should be similar to that shown in Figure 15.4.
Figure 15.4. MRTG interface statistics.
Now the system must be configured to run mrtg on a regular basis. Use crontab with the -e option to make mrtg run every five minutes:
[root@lefty mrtg-2]# crontab -e
and add the following entry:
0,5,10,15,20,25,30,35,40,45,50,55 * * * * /usr/local/mrtg-2/bin/mrtg
/usr/local/mrtg-2/cfg/mrtg.cfg
Additional routers and nodes can be added to the mrtg.cfg with the following command:
[root@lefty mrtg-2]# bin/cfgmaker –global 'WorkDir: /home/httpd/html/mrtg'
[email protected] >>/usr/local/mrtg-2/cfg/mrtg.cfg
As mentioned, the data is still in a somewhat raw format. MRTG includes a tool called indexmaker that will create an index page that links to all the nodes being monitored. To create an index for this example, the following command is used:
[root@lefty mrtg-2]# bin/indexmaker /usr/local/mrtg-2/cfg/mrtg.cfg
>/home/httpd/html/mrtg/index.html
Permissions and Ownership Issues With the index.html FileThe index.html file’s permissions and ownership might need to be manually set to make the file readable by the owner of the web server process. This creates the index.html with URLs pointing to all the nodes via a graphic summary—as shown in Figure 15.5. |
Figure 15.5. MRTG with index page.

After a new node has been added using cfgmaker, be sure to run the indexmaker again. After mrtg has been configured with the nodes to monitor and given time to collect the statistical information, the index page will resemble Figure 15.6.
Figure 15.6. MRTG with Populated Index.

IPTraf
IPTraf is a network monitoring tool that is geared towards real-time monitoring of network traffic. Unlike a sniffer, such as tcpdump, IPTraf reports the statistics of the traffic as seen by the Linux network driver. Like a sniffer, IPTraf requires the interface to be placed in promiscuous mode; consequently, the program should be run as the root user.
IPTraf installation is very simple and straightforward consisting of unzipping, untarring, and running the setup script, so it will not be covered here.
IPTraf is installed to the /usr/local/bin/ directory, so if /usr/local/bin/ is not in your path, then the complete filename /usr/local/bin/iptraf will need to be executed to start the program.
Getting Around IPTraf
IPTraf is menu driven; therefore, it proves itself almost immediately valuable to most network administrators. Figure 15.7, shows IPTraf’s Main menu. The cursor keys can be used to navigate the window, or each menu also has a short cut key (highlighted) associated with it.
Figure 15.7. IPTraf Main menu.

A closer look at each of the functions supported by IPTraf follows.
IP Traffic Monitor
The IP traffic monitor allows monitoring of IP traffic on a specific interface or on all interfaces recognized by the Linux kernel. Figure 15.8 shows an example of the IP traffic monitor.
Figure 15.8. IP traffic monitor screen.
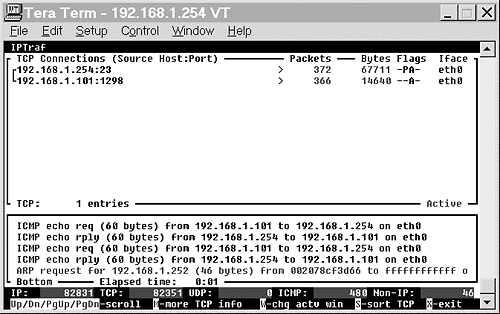
The top portion of the IP traffic monitor reports TCP connections. Figure 15.8 shows a telnet connection (port 23) between 192.168.1.254 and 192.168.1.101. The IPTraf output also shows that station 192.168.1.254 has sent 372 packets over the TCP connection and 192.168.1.101 has sent 366.
The flags column reports how the flags were set in the last TCP packet as defined in RFC 793, “Transmission Control Protocol Darpa Internet Program Protocol Specification.” Table 15.2 summarizes the TCP flags.
| IP Traffic Monitor Abbreviation | TCP Abbreviation | Meaning |
|---|---|---|
| A | ACK | Acknowledgment |
| P | PSH | Push all data to queue |
| U | URG | Packet is marked urgent |
| S | SYN | Synchronization during handshaking. |
IPTraf also will report resets with RST, unacknowledged FINs with DONE, and a properly closed connection with CLOSED. The packet and window size of each of the connections also can be viewed by pressing the m (more) key.
The bottom window in IP traffic monitor shows the most recent non-TCP traffic. In Figure 15.8, this was ICMP-echo requests (pings) and an address resolution protocol (ARP) request.
The bottom of the screen contains two lines.The first line is a real-time view of the packet count for IP, TCP, UDP, ICMP and non-IP traffic.
The second line is the menu for IP traffic monitor. The up and down arrows let you scroll through information when more than one screen is available. The w key switches between the top TCP window and the bottom, all other traffic window.
As mentioned, the m key will report the packet and window size of the TCP connections.
The s key allows the TCP connections to be sorted either using the packet or byte count, which will result in the same ordering; however, the command is useful because the IP traffic monitor does not sort in real time. With the sort command, the connections with the most traffic will “float” to the top of the list.
The x key is used to return to IPTraf’s main window.
General Interface Statistics
The General Interface Statistics screen gives a simple breakdown of traffic for all interfaces as shown in Figure 15.9. The counters include IP packets, non-IP (such as IPX), and bad IP, which are packets that can be identified by the IP header, but something in the header is not compliant with the IP protocol.
Figure 15.9. General Interface Statistics screen.

Specific Interface Statistics
The Specific Interface Statistics allows the administrator to examine the IP statistics related to a particular configured interface. Figure 15.10 shows the statistics for eth0.
Figure 15.10. Specific Interface Statistics for eth0.
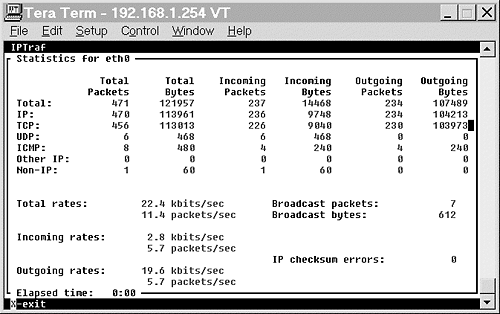
In addition to the breakdown of the types of IP packets, the lower portion of the screen also shows the throughput—both inbound and outbound. The specific interface statistics can be useful for quickly identifying possible problems when troubleshooting a network problem. Refer back to Figure 15.10, and you’ll notice the number of ICMP packets is very high when compared to the total number of packets. A ping flood caused this.
Statistical Breakdown
The Statistical Breakdown screen reports the number of packets received by two criteria, either the packet sizes on a particular interface or the TCP/UDP port of a particular interface. The statistical breakdown by packet size is shown in Figure 15.11 and by TCP/UDP port in Figure 15.12.
Figure 15.11. Statistical Breakdown—packet size.
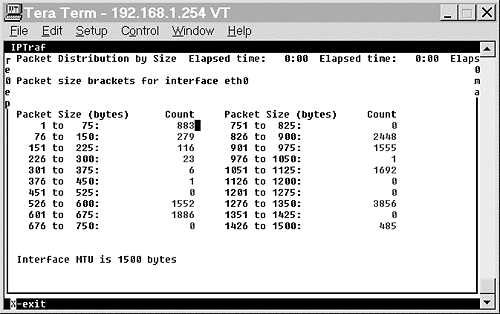
Figure 15.12. Statistical Breakdown—TCP/UDP port.

LAN Station Monitor
The LAN Station Monitor reports statistics based upon the Layer 2 address, or with Ethernet, the MAC address. Its use is limited, but it can be used in conjunction with other tools such as a sniffer to locate Layer 2 related problems. The LAN Station Monitor is shown in Figure 15.13.
Figure 15.13. LAN Station Monitor screen.

TCP Filter and Other Filters
While examining statistics, it is often useful to examine only certain traffic. The TCP Filters and Other Filters menu allow you to define which traffic should or should not be displayed. The TCP filters apply only to TCP traffic. Should other types of traffic be filtered, the Other Filters option should be chosen.
Creating a filter is straightforward—with only a couple of necessary steps.
After choosing TCP Filter, select Define New Filter, which will prompt for a description of the filter as shown in Figure 15.14. Enter Telnet Traffic Only into the description.
Figure 15.14. TCP filter specifying filtering of Telnet Traffic Only.

After entering the description, the screen shown in Figure 15.15 will prompt for IP addresses and ports. The first and second fields are simply the source and destination address in either order. The wildcard mask is actually the netmask that will determine how many addresses are included in the range.
Figure 15.15. TCP filter, IP addresses, and Ports Entry screen.

Because we are only filtering for telnet, 0.0.0.0 is entered in the address and wildcard fields. Telnet’s port number, 23, is entered in the Port Number field. Be sure to use the Tab key to move from field to field—the Enter key will create the entry.
After pressing Enter, the filter function allows you to enter additional addresses and ports. Press CTRL-X to exit out of the Define TCP filter.
Before using the filter with any of IPTraf’s functions, the filter must be applied. The filter is applied using the Apply Filter within the TCP filter section. After Apply Filter is chosen, a list of TCP filters is shown. Select the appropriate filter using the cursor keys and pressing Return on the correct entry. Exit out of the TCP Filter section and then choose the appropriate IPTraf function that should be used with the filter applied. Figure 15.16 shows the filter being used with the IP Traffic Monitor.
Figure 15.16. IP Traffic Monitor with TCP filter.

Should the protocol being examined not be TCP, the Other Filters item should be chosen at the Main menu. Other filters are created similarly to the TCP and follow the same guidelines with addresses and ports.
In addition to covering monitoring and analyzing of network resources, we need to take it the next step and address quality of service issues. This topic is tackled in the next section.
