
Chapter 9: Decoding TCP and UDP
Since being standardized in the early 1980s, the Transmission Control Protocol/Internet Protocol (TCP/IP) suite has defined how data is addressed, packetized, transmitted, and routed. Over the years, modifications have been made to the TCP/IP suite to provide more efficiency in today's changing network. This chapter will focus on the TCP portion of the suite, that is, the transport layer (or Layer 4) of the Open Systems Interconnection (OSI) model. Layer 4 has several protocols to transport data; however, we will focus on the most widely used transport layer protocols, TCP and UDP.
In this chapter, we'll begin by reviewing the role and purpose of the transport layer. We'll then take a closer look at TCP, a connection-oriented protocol, and its uses. So that you can easily analyze TCP, we'll examine the header format and field values in detail, such as sequence number, offset, window size (WS), and TCP flags. We'll summarize with a review of the User Datagram Protocol (UDP), and discuss common uses for this lightweight, connectionless protocol. We'll finish by examining UDP's streamlined four-field header.
This chapter will cover the following:
- Reviewing the transport layer
- Describing TCP
- Examining the 11-field TCP header
- Understanding UDP
- Discovering the four-field UDP header
Reviewing the transport layer
The transport layer of the OSI model is responsible for providing end-to-end data transport, by either using a connectionless or connection-oriented protocol across an IP network. The transport protocol used will depend on the application.
In addition to TCP and UDP, there are several protocols in this layer, including the following:
- Reliable data protocol (RDP): Used to transfer data in a connection-oriented manner
- Stream control transmission protocol (SCTP): Provides the reliable transmission of data streams that have more than one IP address
While there are other transport layer protocols, the two predominant protocols are TCP and UDP, as shown in the following figure:
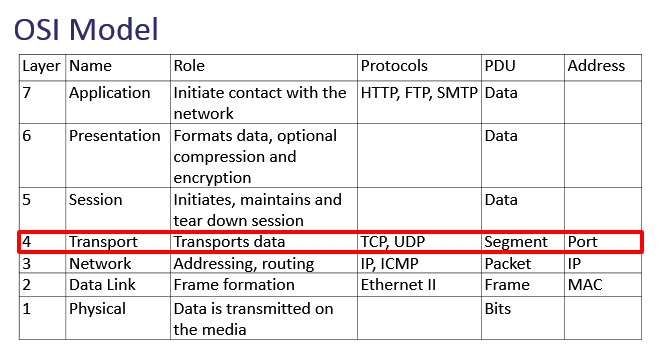
Figure 9.1 – The OSI model—Transport layer
UDP is connectionless and is used when data transport needs to be fast. UDP has a lightweight four-field header that is always 8 bytes in length.
Note
Unlike TCP, UDP currently does not have any header options. However, because of the changing nature of the internet, there has been an active discussion on possibly including options for UDP. You can review the draft called Transport Options for UDP, here: https://www.ietf.org/archive/id/draft-ietf-tsvwg-udp-options-13.txt.
In contrast to UDP, TCP is a connection-oriented protocol. It has an 11-field header that has the ability to include options. In the next section, we'll learn how impressive this protocol is in its ability to ensure the complete delivery of data while monitoring for congestion and providing flow control.
Describing TCP
TCP is a connection-oriented protocol that has end-to-end reliability. These two significant features are described as follows:
- Connection-oriented means that both endpoints must set up a connection before any data is transferred. To begin a session, TCP starts with a (three-way) handshake and ends with a series of finis (FIN) packets to close the session.
- End-to-end reliability means that the data is sequenced and acknowledged during the data transfer. All data is carefully monitored, and if there are any gaps in transmission, TCP will request any missing packets.
Once two hosts establish a connection, TCP monitors the session to ensure the data transfer is complete, without causing undue strain on the host or the network. In the next section, we'll summarize what happens during a TCP connection.
Establishing and maintaining a connection
When using TCP, prior to any exchange of data, the session must begin with a three-way handshake between hosts. The handshake establishes the parameters of the conversation. Both client and server must agree on all parameters before commencing communication.
In many cases, in addition to the TCP header, there are header options that outline and further define the parameters of the conversation.
Any TCP options will be found in the first two packets of the three-way handshake. For example, two common options are as follows:
- Window scaling: A value that expands the stated WS by providing a multiplier that more accurately reflects the true WS.
- Selective Acknowledgements (SACK): When SACK is enabled, the receiver will notify the sender only if there are any missing packets.
Note
TCP options will be covered in detail in Chapter 10, Managing TCP Connections.
Once a connection is established between two hosts, the operating system for both local and foreign (or remote) hosts will create a socket, which is an IP address and a port.
To see all your active TCP connections on a Windows machine, open a command-line prompt and run netstat -anp tcp. This will show your active connections.
Across the top, you will see the following headers:
Proto Local Address Foreign Address State
These are defined as follows:
- Proto (protocol)
- Local Address (local IP address and port)
- Foreign Address (remote IP address and port)
- State of the connection
After running the netstat command, my output was as follows:
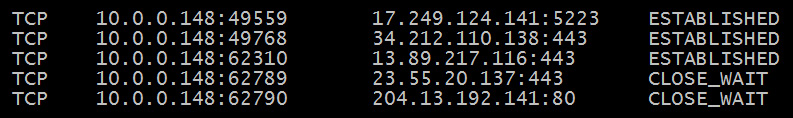
Figure 9.2 – Netstat showing TCP connection status
In Figure 9.2, you see a local IP address and port, along with a foreign (or remote) IP address and port. For example, in the first line, we see the following:
- Proto: TCP
- Local Address: 10.0.0.148:49559
- Foreign Address: 172.249.124.141:5223
- State: ESTABLISHED (or actively communicating)
During the conversation, TCP acknowledges all the packets received to ensure the complete delivery of the data. Every time TCP receives data, the receiving host sends an acknowledgment (ACK) packet back to the sender, notifying the sender of what data was received.
Once the conversation is over, TCP ends the session with an exchange of FIN packets.
Next, let's see how this powerful protocol has methods to assist in controlling the data flow and minimizing network congestion.
Managing the flow
During a connection, TCP actively monitors the connection, and both sender and receiver constantly communicate with each other. During the data exchange, TCP will manage the data to both the host and the network as follows:
- Flow control is an end-to-end control method using the WS, so the sender doesn't transmit too much data and overwhelm the host.
- Congestion control prevents a node from sending too much data and overwhelming the network.
When providing congestion control, there are two state variables that are calculated during data transmission:
- Congestion Window (Cwnd): The sender-side limit defines the amount of data a host can send before receiving an acknowledgment.
- Receiver Window (Rwnd): The receiver-side limit defines the amount of data a host can receive.
The two variables work together in a TCP connection to regulate the flow of data, minimize congestion, and improve network performance.
It's hard to believe, but there is a great deal of detail in one single frame, and each frame can contain many components. Components can include the various headers, field values within the headers, and optional data. In the next section, we'll look at all the information that's found in a single TCP frame.
Exploring a single TCP frame
For a deep dive into the TCP header, go to https://www.cloudshark.org/captures/0012f52602a3. Download and open the HTTP.cap packet capture file in Wireshark.
To follow along, select Frame 4 and focus on the packet details pane, as shown in the following screenshot:
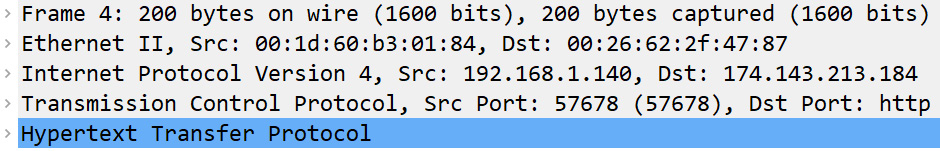
Figure 9.3 – The packet details pane for Frame 4
Each header has a summary, followed by the details of the header. To see the protocol summary, place your cursor on a protocol, right-click, and then select Protocol Preferences, as shown here:
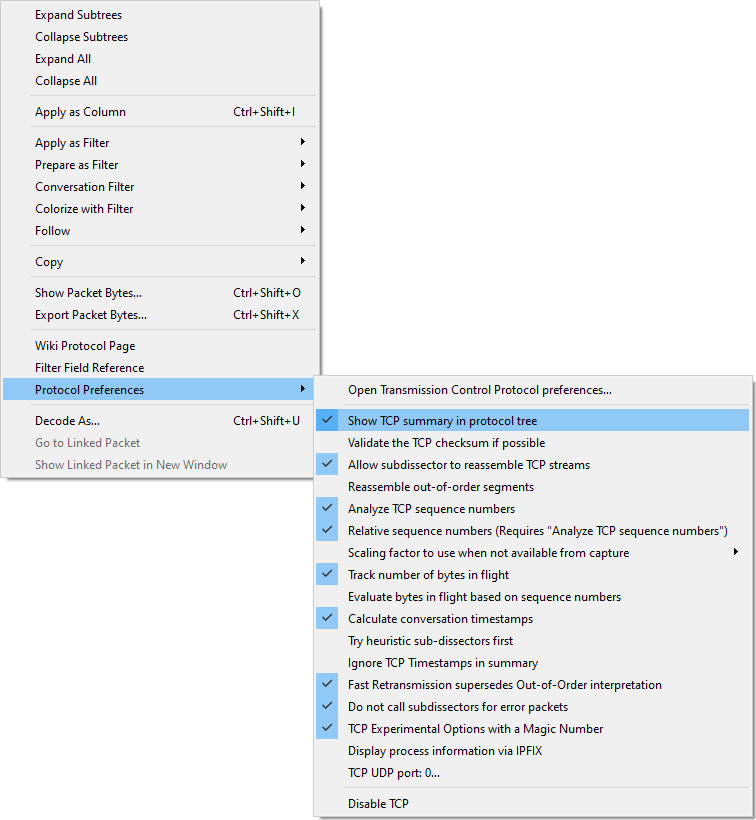
Figure 9.4 – Protocol preferences for TCP
Once there, select Show TCP summary in protocol tree, as shown. In addition, you can expand the header by clicking on the arrow (or caret, >) on the right-hand side to see the details.
Let's break down each element of Frame 4, starting with the frame details.
Describing the frame details
Starting from the top of Figure 9.3, we see Frame 4. Expand the frame identifier by clicking on the arrow on the left-hand side to see the details as follows:
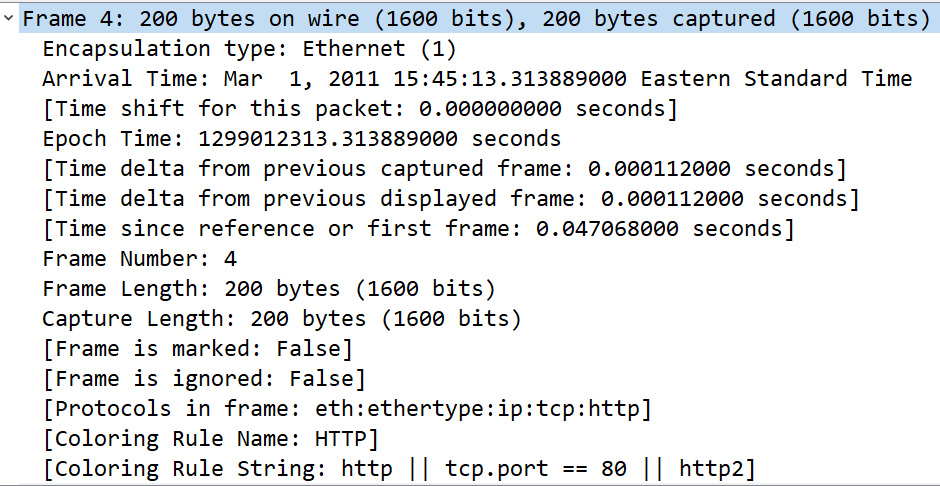
Figure 9.5 – Frame metadata on a single frame
Note
The identifier Frame is not a protocol, it is a list of values generated by Wireshark that describes information (or metadata) about a single frame.
As shown in Figure 9.5, we see the metadata about Frame 4, which summarizes the contents of the frame, such as the frame length and any coloring rules.
The next identifier begins the true frame encapsulation, as we see the Ethernet II header.
Expanding the Ethernet II header
The (true) frame header is the Ethernet II frame, which is a common frame format found on a Local Area Network (LAN). The frame header follows the metadata summary and provides information about the source and destination Media Access Control (MAC) address, as shown in the following screenshot:
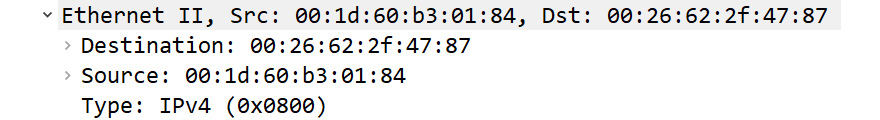
Figure 9.6 – Frame header
Within the header, we see the following in the last line of the frame: Type: IPv4 (0X0800). This means the next header to follow is an IPv4 header, which we'll investigate next.
Viewing the IP header
The Internet Protocol Version 4 header begins with a summary that includes the source and destination IP address, followed by the IPv4 field values.
Note
The IPv4 header will be covered in detail in Chapter 11, Analyzing IPv4 and IPv6.
The IPv4 header for Frame 4 is as shown in the following screenshot:
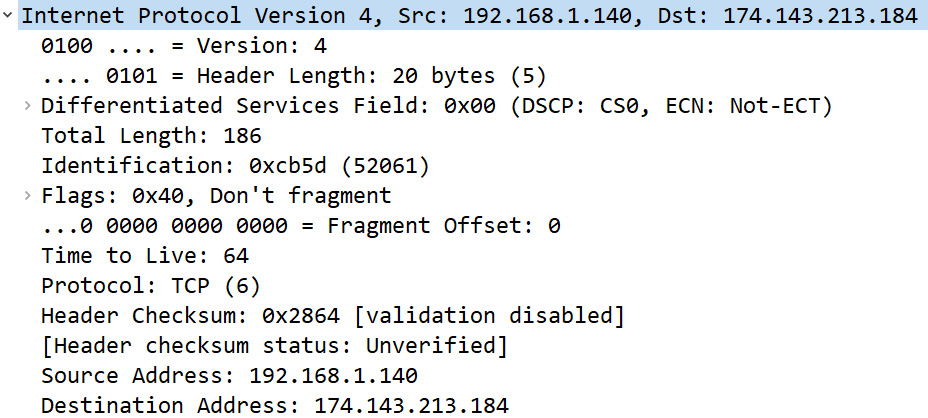
Figure 9.7 – IPv4 header
Similar to the frame header, we see the following within the frame: Protocol: TCP (6). This means the next header to follow is a TCP header.
Navigating the TCP header
The TCP header begins with the identifier Transmission Control Protocol and lists the source and destination ports, sequence, and acknowledgment numbers. In addition, you will also see Wireshark generated data, shown in [ ], such as [Stream index: 0].
The TCP header for Frame 4 is as shown in the following screenshot:
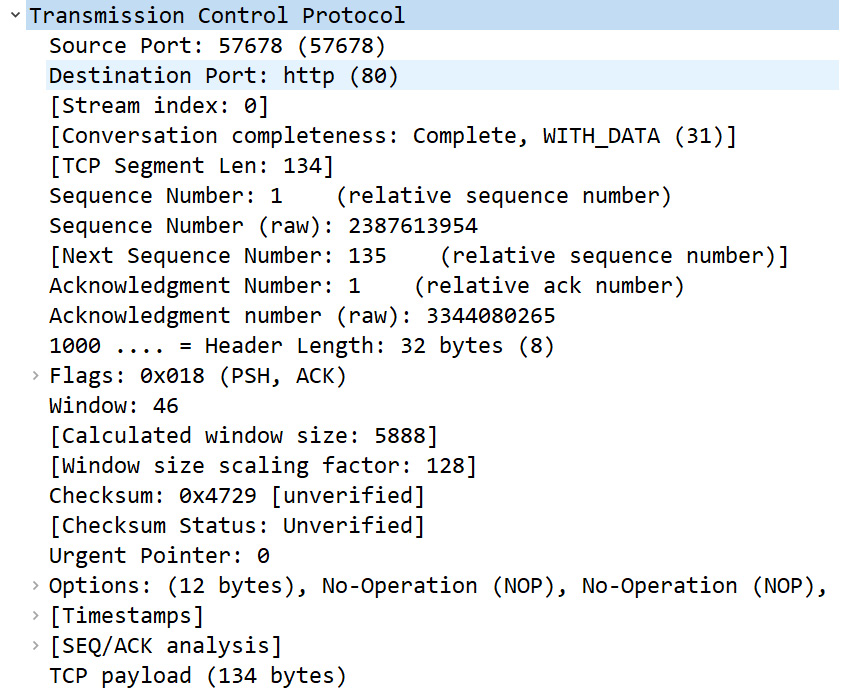
Figure 9.8 – TCP header
Here we see the details of the TCP header. In this case, I have disabled the Show TCP summary in protocol tree protocol preference, so the entire header was able to fit in the page.
The last component of Frame 4 is the Hypertext Transfer Protocol (HTTP) header.
Checking out the HTTP header
Because the client is requesting data from a web server, the application in use is HTTP. In this case, we see the HTTP header, as shown here:
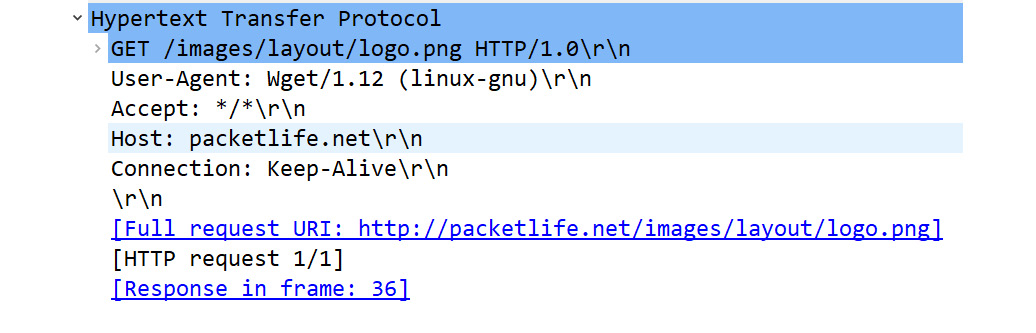
Figure 9.9 – HTTP header
Note
The HTTP protocol will be covered in detail in Chapter 15, Decoding HTTP.
Now that we have covered the details that are found in a single frame, let's examine the TCP header and each of the field values in detail.
Examining the 11-field TCP header
TCP has an 11-field header. The fields hold the values that keep track of the conversation, as shown in the following diagram:
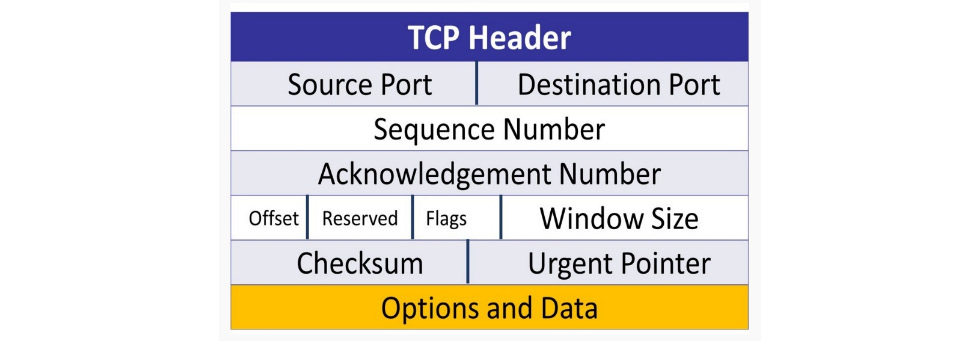
Figure 9.10 – The TCP header
TCP uses the field values to monitor the communication. Once all bytes have been received, TCP will indicate that the end device has successfully received all of the data. If there is trouble during the data transport, TCP will alert the other host of any missing segments.
In this section, we'll take a look at each of the header fields so that you have a better understanding of how TCP is able to provide reliable communication between hosts. I'll list the field and the size in the following manner, [Field: Size], when appropriate, so that you understand the values that comprise a TCP header.
Starting at the top of the TCP header in Frame 4 of HTTP.cap, we can see the label Transmission Control Protocol, as shown in Figure 9.8. Below the label, you can see the TCP header fields.
When looking at the TCP header contents, many times, any information that Wireshark generates will be shown in brackets. This generated content will help you better understand the details of the header, such as [Timestamps] and [SEQ/ACK analysis], as shown near the bottom of Figure 9.8.
Let's step through the first few header fields, starting with the ports and TCP segment length.
Exploring TCP ports
In Wireshark, you can resolve physical, network, and transport layer addresses. The packet capture HTTP.cap uses the transport layer name resolution. As a result, whenever a well-known or registered port is used, Wireshark will identify the application associated with the port number. For example, HTTP uses port 80, and when port 80 is used, it will be identified as HTTP.
The following lists the port numbers, along with the generated information Wireshark provides, such as Stream Index and Segment Length:
- Source port 16-bit: Frame 4 is a request from the client to the server. By indicating a port number, that tells the server, When you deliver the data, use this port. In this case, the value is Source Port: 57678 (57678), which is not associated with any application; it is an ephemeral (or temporarily assigned) port that is used in this connection. As a result, you will not see a protocol listed before the port number.
- Destination port 16-bit: Frame 4 is a request from the client to the server, which is most likely a web server, as the value is Destination Port: http (80).
- Stream index: This value is shown in brackets, as Wireshark calculates this to keep track of the streams, where each stream is a communication between two endpoints. In Frame 4, we can see [Stream index: 0], which means this is the first stream in this capture. This value is a useful tool when doing an analysis, as you can easily right-click on a frame and select Follow, and then select a stream (such as TCP or HTTP) as shown in the following screenshot:
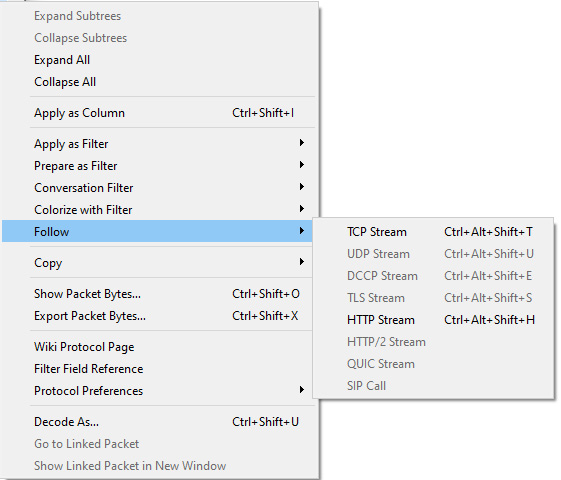
Figure 9.11 – Following the stream
- Conversation completeness: This generated value indicates whether or not the conversation is complete. In this case, we see Complete, WITH_DATA (31)]. This means the captured conversation is complete, as it has all the elements of a complete conversation, such as the handshake, data transfer, and FIN packet exchange.
- TCP segment length: In the transport layer, the Protocol Data Unit (PDU) is a segment. The segment length is the value of the TCP payload, which is the data that follows the TCP header, and any options. Wireshark calculates this value as shown in brackets. In Frame 4, we can see [TCP Segment Len: 134], which is the same value as TCP payload (134 bytes), as shown in the last line of Figure 9.8.
Next, we'll take a look at the fields that keep track of the data that's sent and received during data transmission.
Sequencing bytes
Because TCP is a connection-oriented protocol, the operating system keeps track of every byte (or octet) of data that is received. Each byte is sequenced, and once received, is acknowledged. The three-way handshake starts the sequencing process.
Before taking a look at the sequence numbers, let's discuss how they are calculated.
Synchronizing the sequence numbers
Prior to exchanging data, the client and server must synchronize the sequence numbers. This is achieved by using the Synchronization (SYN) flag in the TCP header. The SYN packets are found in the first two packets of the three-way handshake and are responsible for synchronizing the sequence numbers used during the connection.
For example, as shown in the following screenshot, a client sends a SYN packet to the server with a Sequence (SEQ) number of 100:
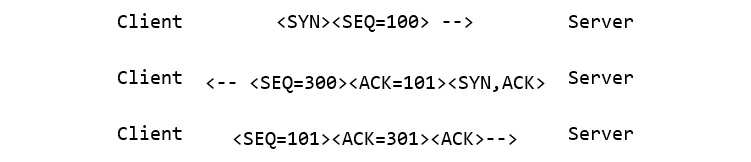
Figure 9.12 – The three-way handshake
Note
The sequence number of 100 was randomly selected for this example. In an actual TCP connection, the OS will generate a random sequence number to start the process.
The server responds by sending a Synchronization Acknowledgement (SYN, ACK) with a sequence number of 300 and an ACK of 101. The client sends a final ACK with a sequence number of 301 and an ACK of 101. The sequence numbers are now synchronized.
Note
You can see an example of the three-way handshake in the first three packets of HTTP.cap.
Next, we'll evaluate how Wireshark can represent the sequence numbers when analyzing data.
Understanding the sequence numbers
When working with a packet capture, you have a choice as to how you would like your sequence numbers represented. Wireshark can generate relative sequence numbers, mainly because the actual (or absolute) sequence number is very large. The relative sequence number is easy to understand and represents a value in relation to a specific conversation.
To switch, right-click anywhere in the TCP header, select Protocol Preferences, and then select Relative Sequence Numbers.
Keep in mind, in order to display relative sequence numbers, you must also select Analyze TCP sequence numbers, as shown in the following screenshot:
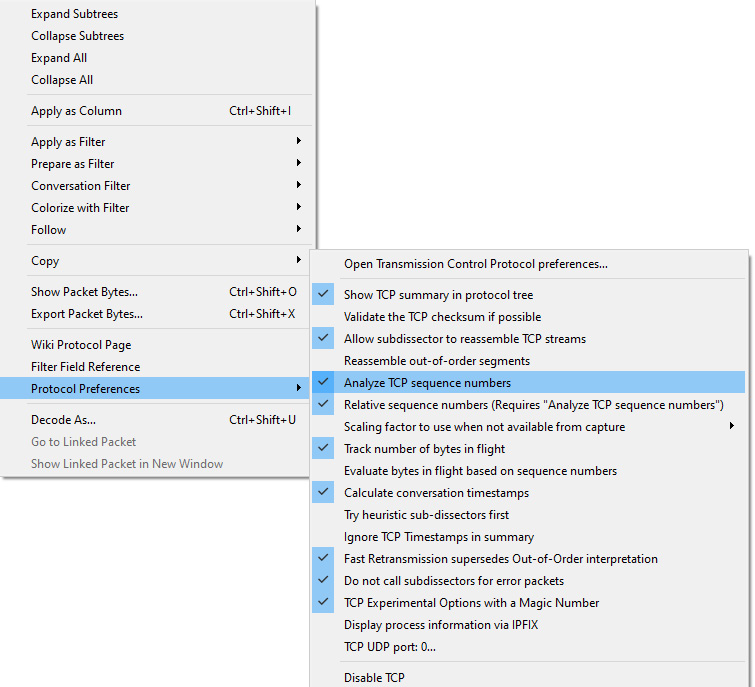
Figure 9.13 – Protocol preferences—relative sequence numbers
This will adjust the sequence numbers to a more understandable value.
When using a relative sequence number, the absolute sequence number is displayed below as Sequence Number (raw): 3344099089, as shown in the following screenshot:
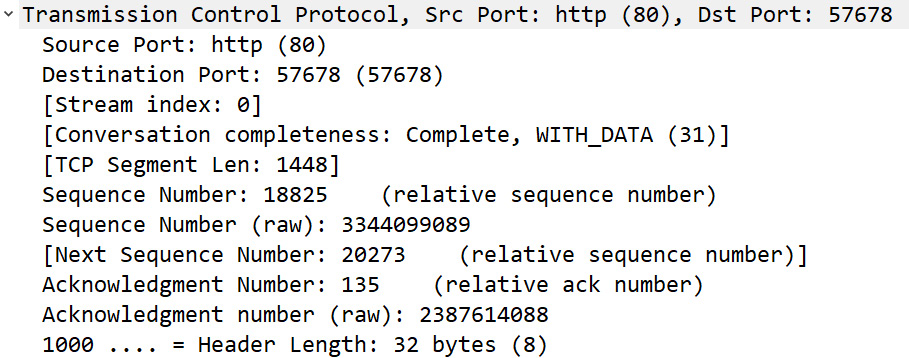
Figure 9.14 – Viewing the sequence numbers
Now that you understand how the sequence numbers are generated and displayed, let's see how they are represented during data transfer.
Reviewing the sequence field values
As we know, the field values that deal with sequencing help provide a snapshot of the data that's exchanged during a TCP connection. The fields are as follows:
- Sequence number (32-bit): After the handshake, the data flow begins. In Frame 4, we can see Sequence number: 18825 (relative sequence number).
- Sequence number (raw): This value represents the unaltered sequence number. In Frame 4, we can see the value as 3344099089.
- Next sequence number: The value is in brackets, as it is calculated. Wireshark adds the current sequence number to the TCP segment length to get the next sequence number.
In addition to sequencing data, TCP also acknowledges receipt of all data.
Acknowledging data
During data transfer, the OS keeps track of all bytes and reordering by using the sequence numbers. Every time the OS receives data, the receiving host acknowledges that the data was received and that they are ready to accept more, starting with the next expected byte.
The process occurs concurrent to the server sending data. As a result, it is called an expectational acknowledgment. As shown in the following diagram, the client sends an ACK to the server stating that they have received 524 bytes of data and they are ready for more, starting with 525:
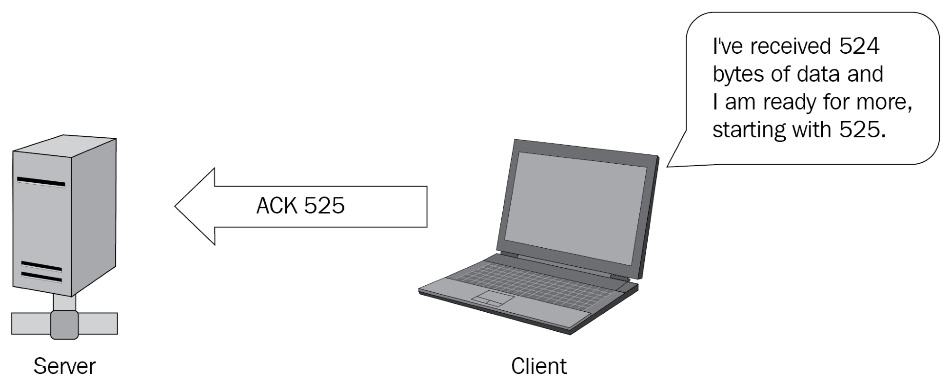
Figure 9.15 – Acknowledging the data
Within the TCP header, there are a couple of fields that are used to acknowledge receipt of the data. The fields are as follows:
- Acknowledgment number 32-bit: In Frame 4, we can see the value as Acknowledgment Number: 1 (relative ack number). The value is 1 because it is the first packet from the client.
- Acknowledgment number (raw): This value represents the unaltered acknowledgment number. In Frame 4, we can see the value as 3344080265.
In the line right after the acknowledgment number in Figure 9.14, you see 1000. This line represents the data offset field, which indicates the length of the TCP header in 32-bit multiples. Let's talk about how this value is calculated.
Calculating the offset
The size of a fixed TCP header field is 20 bytes. However, many times in today's networks, the TCP header has additional options. As a result, the value is not always consistent. So that the receiving device knows when the data begins, the offset field will indicate the length of the header, as immediately after the TCP header, the data portion begins.
The TCP header for Frame 4 is calculated in the following manner:
- The offset value is 1000, which is equal to eight (8) in binary.
- The offset is in increments of four (4) bytes.
- Calculated TCP header length: 8 * 4 = 32 bytes.
The offset value (or TCP header) for Frame 4 is 32 bytes.
Keep in mind the following when evaluating a TCP header:
- The minimum TCP header length is 20 bytes.
- The maximum TCP header length is 60 bytes.
If you want to do a quick check of the header length, place your cursor on the TCP header for Frame 4, and the value will be reflected in the status bar as shown:
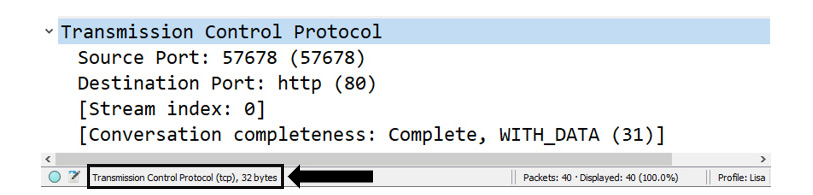
Figure 9.16 – Viewing the TCP header length
While keeping track of the data exchange, another important element in the TCP header is the use of flags, as discussed in the next section.
Following the flags
TCP flags are used to indicate a particular state during a conversation. Some are commonly seen, such as ACK, FIN, and SYN; however, some are rarely seen in practical applications. TCP has eight control flags, as shown here:
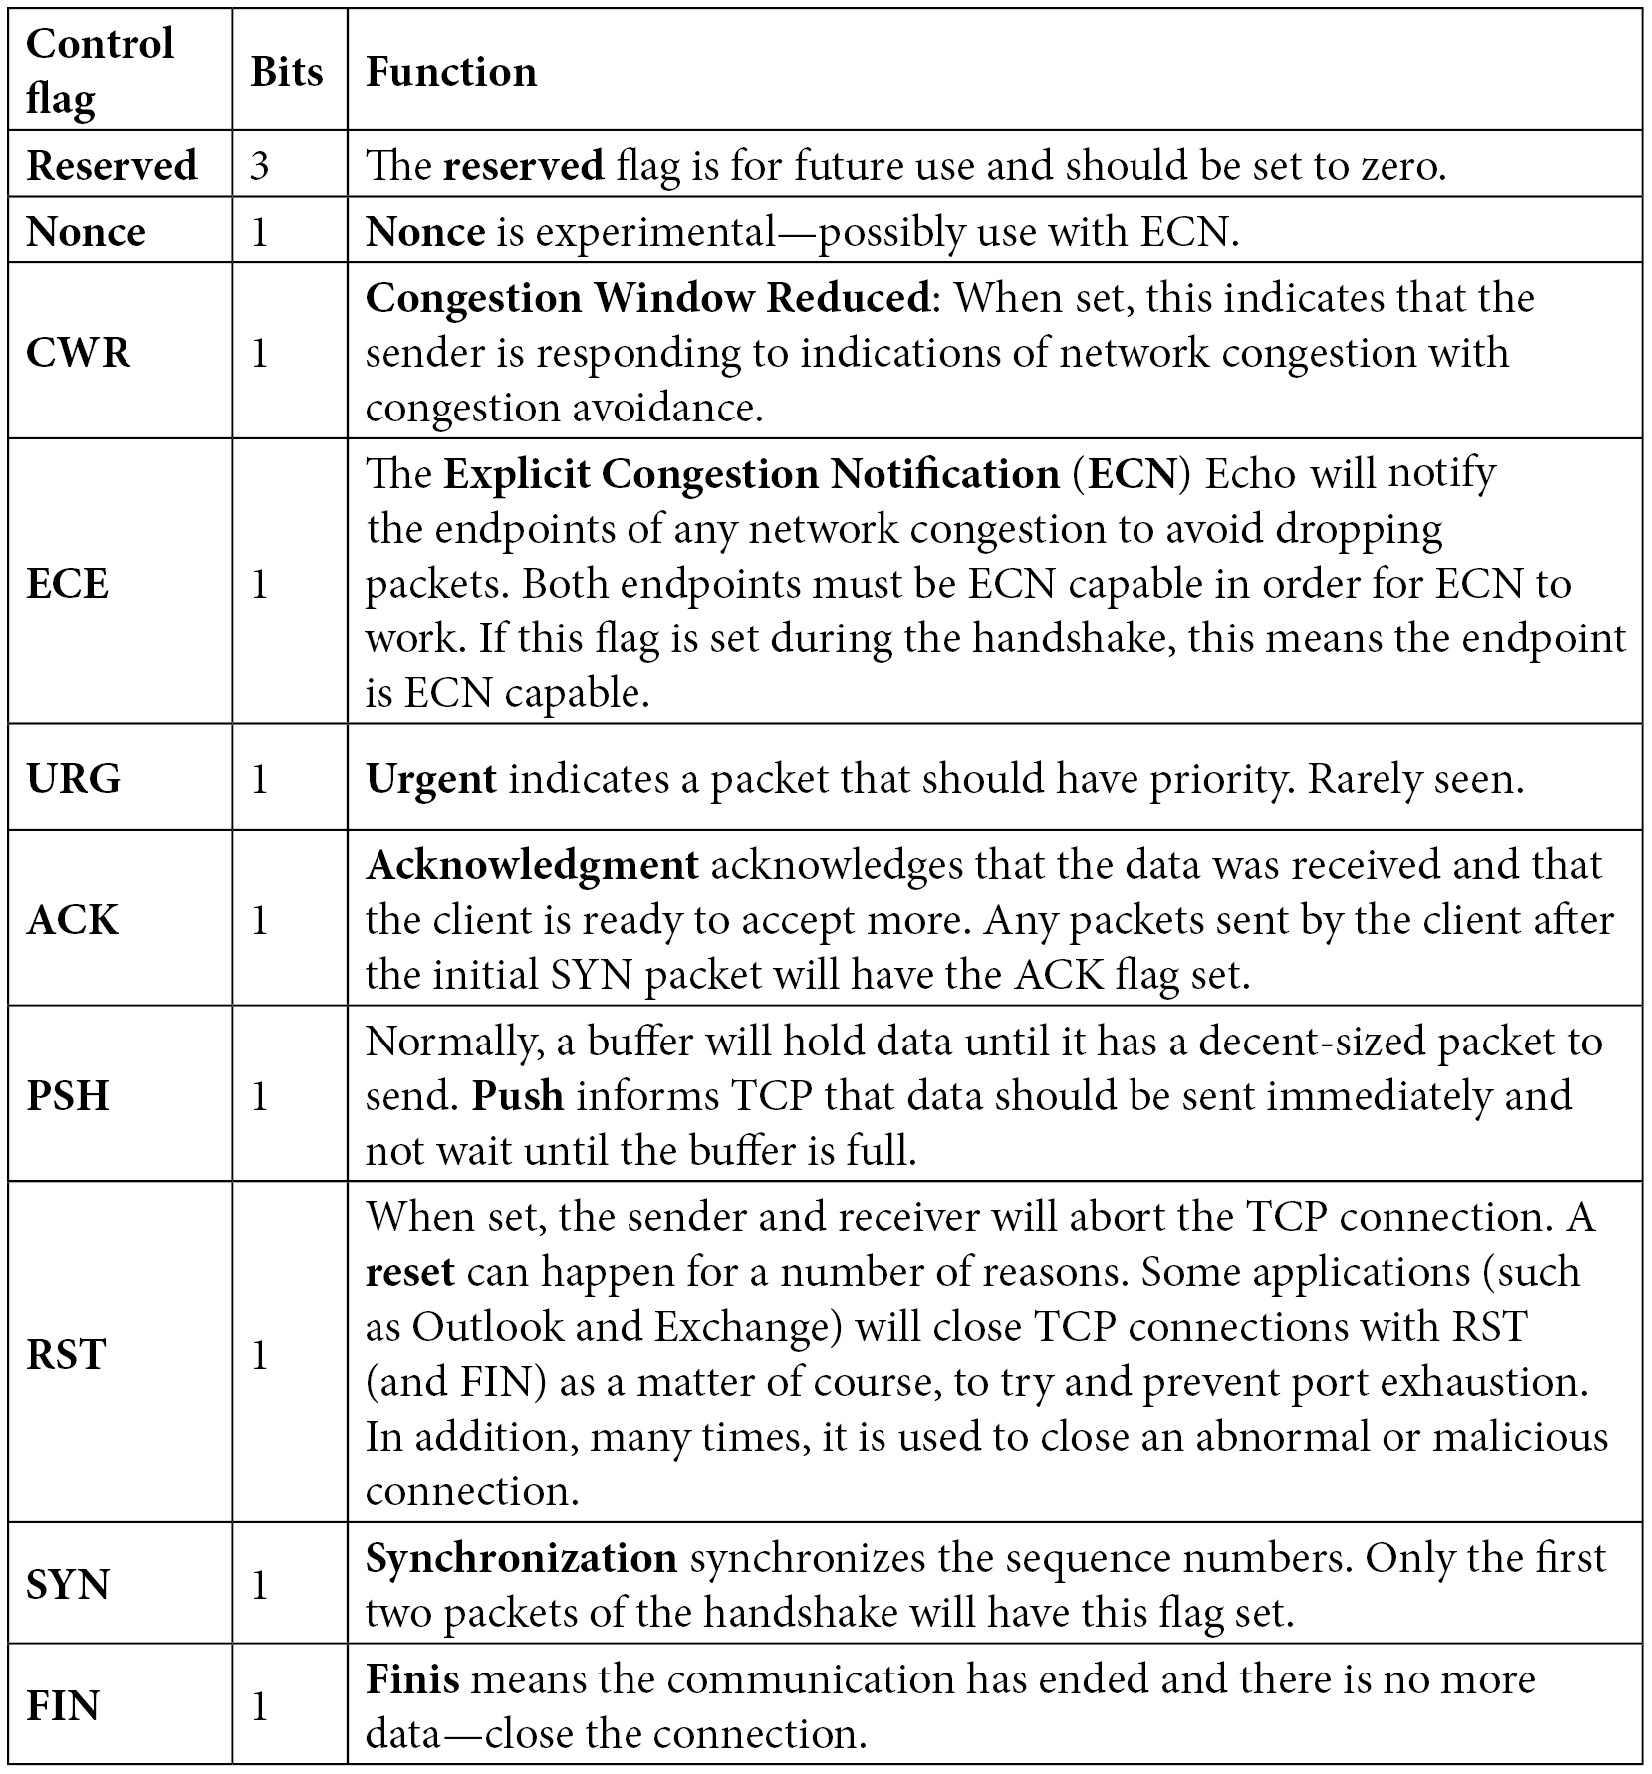
Table 9. 1 – Defining the TCP control flags
The TCP flags, when set, will tell the story of the TCP connection. Wireshark will reflect this state in the Info column of the packet list pane:
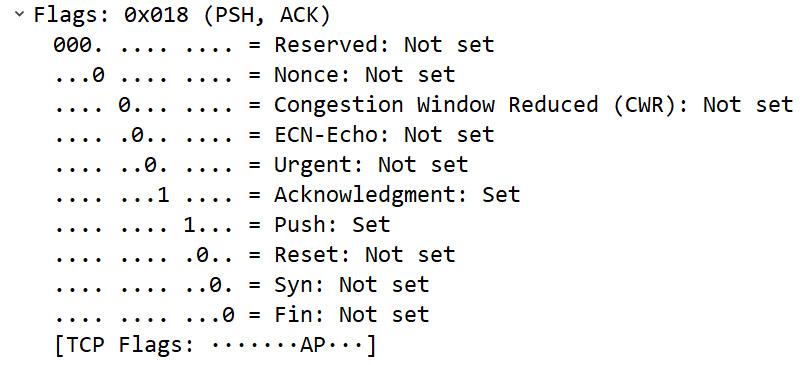
Figure 9.17 – Viewing the TCP flags
Note
TCP is widely used, and the flags are important to control each session. However, TCP flags can be used in a malicious way to launch an attack or evade detection. As a result, the security analyst should make sure devices are tuned to monitor for non-standard and inappropriate use of TCP flags.
The TCP flags provide an indication of what is happening during a conversation. It's important to keep the data moving. As we'll see in the following section, the WS is used to notify the sender about just how much data a host can receive at any given time.
Dissecting the window size
TCP is a full-duplex communication protocol, in which the sender and receiver constantly communicate with each other. During an active connection, the following takes place:
- The server sends data to the client.
- The client responds with an ACK along with a WS value (in bytes), which indicates how much data the client can accept.
Transmitting a WS with every ACK helps control the flow of data. Let's talk about how this works.
Controlling the flow
Flow control is a protocol employed by TCP. In this process, the client sends a WS with each ACK so that the sender does not transmit too much data and overwhelm the host:
- If the client cannot process all the data, the client will send an ACK with a lower WS value.
- Once the client advertises a smaller WS, the server throttles back the data transfer.
- When the client recovers and is able to accept more data, the client sends an ACK with a window update that reflects the new value.
- The server can then continue to send data, until all data is sent to the client.
Keep in mind, the WS value can change at any time during a conversation.
Note
A related term for flow control is called sliding window, as the value will slide back and forth as the endpoint adjusts the amount of traffic it can accept.
In the case of Frame 4, we can see Window: 46:

Figure 9.18 – Viewing the window size
Although the client has indicated the WS as being 46 bytes, this value is most likely larger. Let's talk about why this value is different.
Calculating the window size
Following the Window: 46 line, as shown in Figure 9.18, we can see [Calculated window size: 5888]. This value is larger than the actual WS because this stream uses a scaling factor, which changes the value of the window size. This is due to the difference in the WS over time.
The original TCP Request for Comment (RFC) 793 was written in 1981. At that time, buffer space was smaller, and the 16-bit window size value field would accommodate the actual window size that was available during the 1980s.
If all 16 bits are used, this would mean the window size is equal to 216, or 65,536 bytes. As time passed, hardware improved, and the buffer space expanded beyond that limit. Because of this, options were used to expand the WS value in the TCP header. In the early 1990s, RFCs were written to address the larger buffer sizes, and a window scaling option provides a way to address the actual WS.
As a result, Wireshark calculates the window size by multiplying the scaling factor of 128 by the listed window size field value of 46 bytes, which gives us a calculated window size of 5,888 bytes.
Next, let's take a look at how the scaling factor is determined.
Scaling the window value
[Window Size scaling factor: 128] is calculated by Wireshark. This reflects the scaling factor from the TCP options exchanged during the three-way handshake. As shown in the first packet of the three-way handshake (Frame 1), we can see that the TCP options sent by the server list the last option as Window scale: 7 (multiply by 128), as shown here:
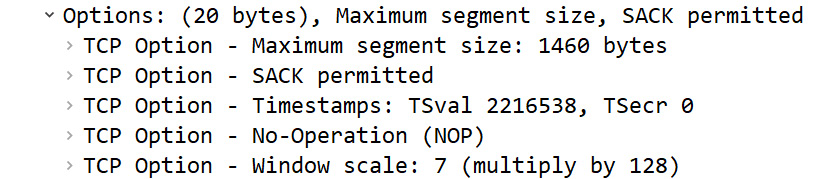
Figure 9.19 – TCP options
Wireshark will determine the calculated WS by multiplying the scaling factor by the window size field value.
If the capture began after the three-way handshake, Wireshark has no way of knowing what the scaling factor is and will display [Window Size scaling factor: -1 (unknown)]. You may also see [Window size scaling factor: -2 (no window scaling used)]. In that case, Wireshark will display the actual window size.
If you do know the scaling factor, you can modify the value. Right-click anywhere in the TCP header and select Protocol Preferences | Scaling factor to use when not available from capture. Once there, select the appropriate value, as shown in the following screenshot:
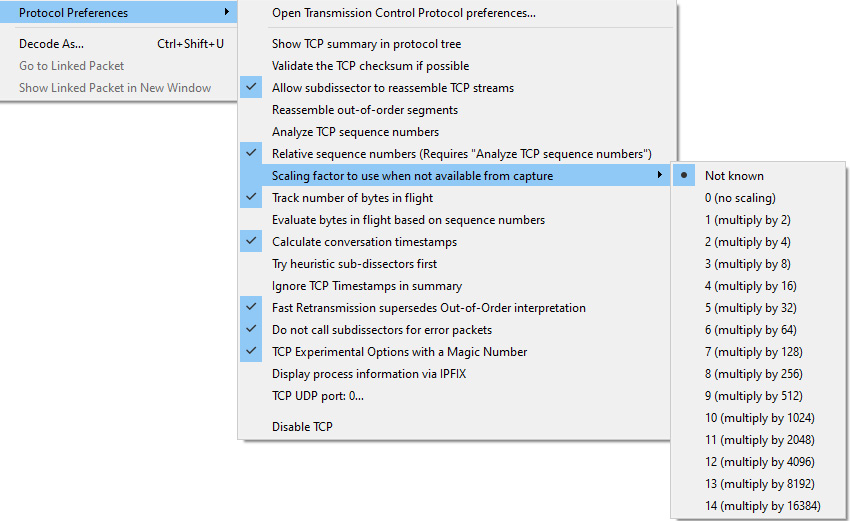
Figure 9.20 – TCP protocol preferences
In addition to the field values that monitor the communication, there are some other field values and options in the TCP header. Let's take a look.
Viewing additional header values
The last part of the header lists additional values and options that help keep a TCP connection on track.
During data transmission, errors may occur. A checksum is a calculated value of the data portion of the packet that is periodically recalculated during transmission to ensure data integrity. The checksum is used for error detection, not correction. If the checksum is not accurate during recalculation, the packet is dropped.
In Frame 4, we can see the value of the checksum as Checksum: 0x4729 [unverified]. When doing a packet capture, the captured packet is presented to Wireshark before the hardware or network driver calculates the checksum. It may be incorrectly calculated, which will result in an error.
To avoid a checksum error, you can disable checksum validation by right-clicking anywhere in the TCP header, selecting Protocol Preferences, and unchecking Validate the TCP checksum if possible.
The TCP flags, which include the URG flag, indicate the packet that should have priority. If the URG flag is set, the receiving host will need to examine the frame to obtain relevant data. This is rarely used. A more commonly used flag is PSH, as it informs the TCP that data should be sent up the stack immediately.
Adding TCP options
Before any TCP conversation, there is a three-way handshake. During the handshake, TCP generally has several options. The options will be listed during the SYN packet exchange. In Frame 4, the options include Timestamps and No-Operation (NOP), as shown here:
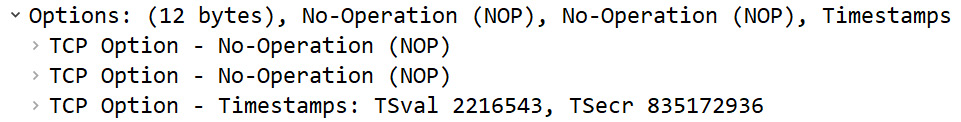
Figure 9.21 – TCP options for Frame 4
During capture, Wireshark gathers statistics and calculates values that can be used for analysis.
Calculating values
At the bottom of the TCP header, there are two calculations, [Timestamps] and [SEQ/ACK analysis], as shown in the following screenshot:
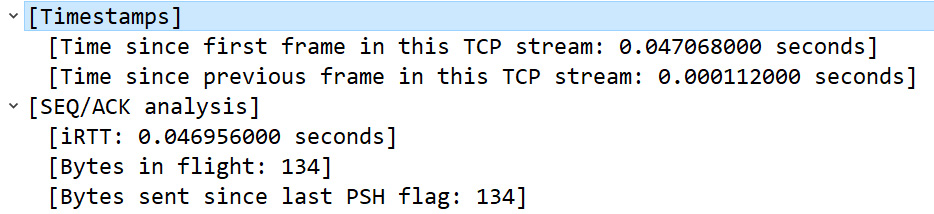
Figure 9.22 – Calculated values in the TCP header
The [Timestamps] calculation indicates the elapsed time and is used to provide details about the capture found in Statistics | Capture File Properties.
[SEQ/ACK analysis] is a calculated field that includes information such as what frame was acknowledged and the Round-Trip Time (RTT), which is used in functions such as the time-sequence graphs found under Statistics | TCP Stream Graphs.
The last component listed is TCP payload (134 bytes), which (as discussed earlier) is the calculated offset value.
As you can see, there is a lot going on with TCP, which provides reliable data transport. In the next section, we will take a look at UDP, a transport protocol to use when speed—not reliability—is required for data transport.
Understanding UDP
UDP is a lightweight, connectionless protocol used for data transfer. UDP does not have a handshake or connection process, nor does it have a teardown.
To see all your active UDP connections on a Windows machine, open a command line and run netstat -anp udp, as shown in the following screenshot:

Figure 9.23 – Netstat command showing UDP connection status
UDP doesn't have any ordering or reliability services; it simply delivers the data. Because of this, there isn't a need for a foreign (or remote) IP address and port. As a result, as shown in Figure 9.23, you will see only a local IP address and port for UDP.
Because of UDP's streamlined nature, it is an appropriate protocol for time-sensitive applications such as the following:
- Dynamic Host Configuration Protocol (DHCP)
- Domain Name System (DNS)
- Trivial File Transfer Protocol (TFTP)
- Voice over Internet Protocol (VoIP)
UDP is a lightweight protocol that is only 8 bytes in length. In the next section, let's look at the elements of a single UDP frame.
Studying a single UDP frame
Unlike TCP, UDP is a lightweight protocol with a very simple header. UDP has only four fields and no options.
To examine UDP and for a deep dive into the UDP header, go to https://www.cloudshark.org/captures/0320b9b57d35 and download the DNS Question & Answer.pcapng file. Go to Frame 1 so you can follow along. Once selected, you will see the following details:
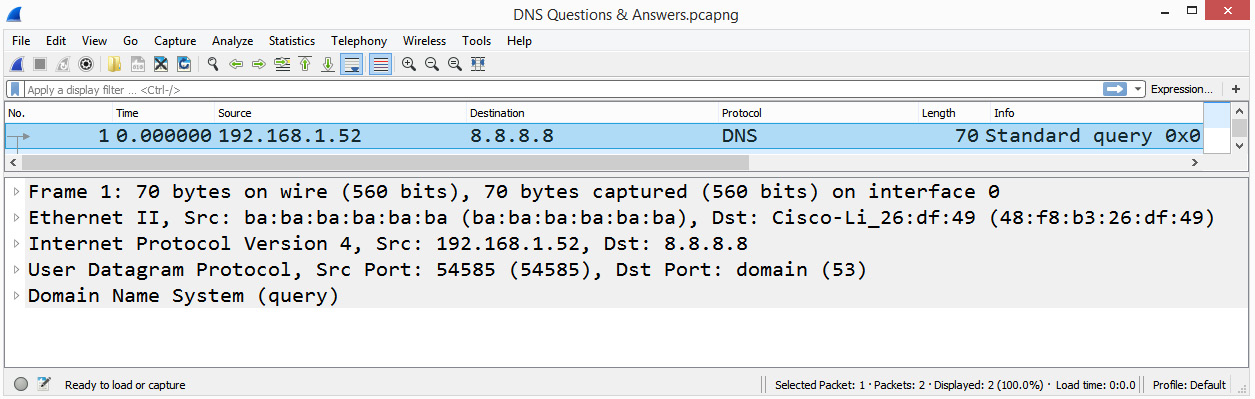
Figure 9.24 – Frame 1 showing the packet details pane
Starting from the top, Wireshark lists the contents of this single frame.
In Frame 1, we can see the following:
- Frame 1: The Frame label is not a protocol. It is a list of values or metadata generated by Wireshark that describes information about a single frame.
- Ethernet II: The frame header follows the metadata and provides information about the source and destination MAC address.
- Internet Protocol Version 4: Provides the details of the IP protocol used and includes the source and destination IP address.
- User Datagram Protocol: Provides the details of the UDP header.
Now that we have taken a look at the information that's found in a single UDP frame, let's examine the UDP header and each of the field values.
Discovering the four-field UDP header
UDP has a four-field header that holds the values that keep track of the conversation, as shown in the following diagram:

Figure 9.25 – The UDP header
Now, let's take a look at each of the four UDP headers.
Analyzing the UDP header fields
Starting at the top of the UDP header, we can see User Datagram Protocol, followed by a summary of what the header represents. Below the header and summary are the UDP header fields, as shown here:
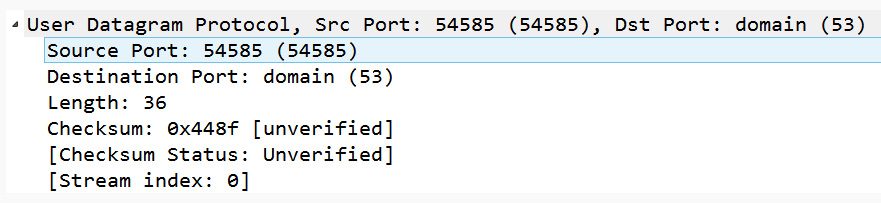
Figure 9.26 – The UDP header as shown in Wireshark
Unlike TCP, UDP has a simple header, with no additional communication details listed, such as Timestamps or SEQ/ACK analysis.
After the header, you will see the following:
- Source Port 16-bit: The source port field is the port on the sender's side. In Frame 1, the sender is a DNS client, using Source Port: 54585, which is not associated with any application; it is an ephemeral or temporarily assigned port that is used in this connection.
- Destination Port 16-bit: The destination port field is the port on the receiver's side. In this case, the port in Frame 1 is Destination Port: domain (53), which is the port on the DNS server accepting requests to resolve a domain name.
- Length 16-bit: In a UDP packet, the length represents the number of bytes in the UDP header and any data that follows. In Frame 1, we can see Length: 36, which is equal to the UDP header (8 bytes) and the DNS header (28 bytes).
- Checksum 16-bit: The UDP checksum is a calculated value of the data portion of the packet that is periodically recalculated during transmission to ensure data integrity.
Note
Using the UDP checksum is optional when using IPv4; however, it is required when using IPv6. The reason the checksum is required when using IPv6 is that IPv6 does not have a checksum, and the value in the UDP header is used to ensure data integrity.
UDP is always 8 bytes long as it does not have any header options. In addition, UDP is connectionless. Therefore, if there is trouble during the data transport, it's up to a higher-level protocol to communicate any issues or request any missing data.
Summary
In this chapter, we focused on the transport layer (or Layer 4) of the OSI model, specifically the two predominant protocols in this layer, TCP and UDP. We started with an overview of the transport layer. We then evaluated TCP, a connection-oriented protocol. We saw that in order to achieve reliability, TCP sequences and acknowledges every octet. We now understand how, in addition to transporting data, TCP monitors the transmission, and provides not only flow control, but congestion control as well. We also took a closer look at the header, along with the eight control flags, then reviewed how window scaling works.
Along with TCP, we looked at the other predominant transport layer protocol, UDP, which ensures fast transportation of time-sensitive data and protocols such as DHCP and DNS. We reviewed the details of the four-field UDP header, which provides enough information to deliver data with no additional overhead.
Now that you have a solid understanding of TCP, the next step is to gain a better understanding of how TCP establishes and tears down a connection in more detail. In the next chapter, we will step through the process of starting a TCP conversation. We'll examine the TCP three-way handshake and resultant socket creation. In addition, we'll then study the packet exchange and have a closer look at the TCP options. Finally, we'll outline how TCP ends data transmission by exchanging FIN packets.
Questions
Now, it's time to check your knowledge. Select the best response, then check your answers, which can be found in the Assessment appendix:
- A _____ is defined as an IP address and a port.
- window
- socket
- checksum
- sequence
- ACK 725 means I have received _____ bytes of data and I am ready for more, starting with _____.
- 700 and 800
- 724 and 725
- 725 and 726
- 725 and 725
- The _____ flag informs TCP that data should be sent immediately.
- RST
- SYN
- ACK
- PSH
- If the offset value is 0101, the TCP header length = ___ bytes.
- 32
- 8
- 20
- 64
- In a normal connection, ___ will use UDP.
- HTTP
- SMTP
- DHCP
- FTP
- Unlike TCP, a UDP header does not have any _____.
- ports
- sockets
- checksums
- options
- If the client advertises a scaling factor of 9, the OS will need to multiply the WS by ____.
- 2
- 9
- 128
- 512
Further reading
To read more about TCP analysis in Wireshark, visit https://www.wireshark.org/docs/wsug_html_chunked/ChAdvTCPAnalysis.html.