
Chapter 2: Using Wireshark
Wireshark is a protocol analyzer that can capture traffic and then present it in a human-readable format. In this chapter, you’ll gain an insight into the overall functionality of Wireshark, and we’ll see how to troubleshoot network traffic, monitor for security issues, and debug applications. We’ll begin by taking a look at some of the features of the interface. We’ll also cover where you can find a list of shortcuts, so you can confidently and quickly capture and analyze packets.
So that you can better appreciate the work that goes into Wireshark, we’ll also review a list of the many authors that contribute to this project and help make Wireshark an exceptional tool. We’ll also see where you can find links on the interface that provide helpful information on how to better use Wireshark.
In order to better understand the packet analysis process, we’ll briefly review each of the phases involved: gather, decode, display, and analyze. We’ll then review the built-in command-line interface (CLI) tools that complement Wireshark’s basic functionality. We’ll then finish with a closer look at tshark, a lightweight CLI application, which you can use when you need to capture traffic without the resource-intensive overhead of using Wireshark.
This chapter will address all of these by covering the following topics:
- Examining the Wireshark interface
- Understanding the phases of packet analysis
- Learning how to use the Wireshark CLI tools
Examining the Wireshark interface
Wireshark offers a comprehensive framework for analyzing network traffic, and it performs well on most operating systems. The interface is streamlined and intuitive, with shortcuts and methods to make navigation easier and get you up and running with analyzing traffic. In this section, we’ll discover how Wireshark presents information, along with where to find a list of keyboard shortcuts. We’ll also take a look at the many authors who have made this application possible, and describe some ways you can obtain help and learn more about Wireshark.
Let’s start with a brief look at the Wireshark interface.
Streamlining the interface
When you first launch Wireshark, you will see a list of active interfaces. Some have a sparkline (or a moving graph symbol) next to the interface(s). When present, a sparkline represents actively exchanging data, and you can select that interface and begin capturing traffic.
As shown in the following screenshot, both the Wi-Fi and VMware network interfaces have active sparklines:

Figure 2.1 – The Wireshark interface
During analysis, Wireshark has many ways to improve your experience. For example, when working with a packet capture within Wireshark, you can easily add columns to the interface. Simply right-click on a value in the packet details area and select Apply as Column, as shown in the following screenshot. Selecting this option will add the Flags field as a column:
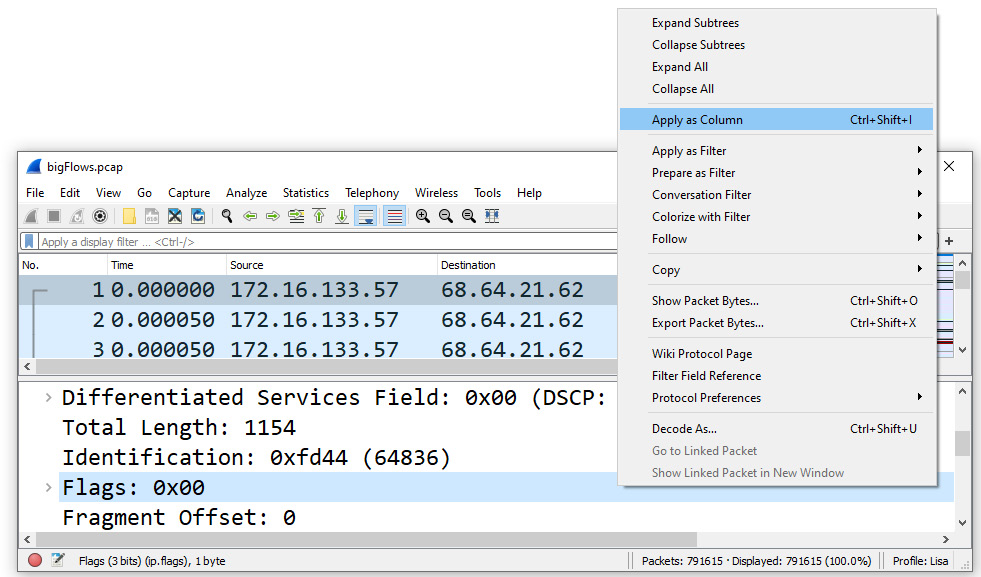
Figure 2.2 – Applying as a column
Wireshark also includes the intelligent scrollbar, which is on the right-hand side of the packet list. When the coloring rules are on, you can see an indication of problems and quickly go to trouble spots, which appear as dark black lines. This is highlighted by 1 in the following screenshot:

Figure 2.3 – The Wireshark interface with enhanced features
Some of the other features include the following:
- There are enhanced graphs – for example, flow graphs and I/O graphs that are easy to use.
- There are coloring rules, which are easy to create and edit.
- Related packets are displayed – you can simply click to see related packets (that is, the dotted line, as highlighted by 2 on the left-hand side of the preceding screenshot).
- It is capable of being translated into several different languages.
With millions of downloads per year, Wireshark has become a significant tool. It has proven to be flexible as an open source utility and encourages developers to add functionality, as well as improve the overall appearance.
Each new version improves the application. Improvements can include fixing a simple visual or display issue to more significant problems that can cause an application to crash, such as faulty dissectors. When you update Wireshark, take the time to read the notes, which will include information such as the following:
- What’s new
- Bug fixes
- New and updated features
- New protocol support
- Updated protocol support
- New and updated capture file support
- New and updated capture interfaces support
- Getting help
- Frequently asked questions
In addition to the many benefits and features, Wireshark also provides a way to navigate using the keyboard. Let’s investigate this concept next.
Discovering keyboard shortcuts
Everyone has preferences as to how they interact with Wireshark. Some individuals prefer using a keyboard, as it’s faster and more intuitive than using a mouse.
Wireshark has a list of keyboard shortcuts that can be found by selecting the Help menu choice, then clicking About Wireshark and selecting the Keyboard shortcuts tab, as shown here:

Figure 2.4 – Keyboard shortcuts
For example, when working with a packet capture, many times I’ll select Ctrl + +, which will zoom in on the main text in the interface.
All of these improvements over the years have been possible because of the generosity of the open source community. The following section outlines how to see who is involved in creating Wireshark.
Recognizing the Wireshark authors
Wireshark is open source and distributed under GNU General Public License (GPL). Its success is attributed to the many developers that have contributed their time to it over the years.
When Gerald Combs and the original development team first released Ethereal, it had limited functionality and could decode less than six protocols. However, over the years, developers have added dissectors, functionality, and ease of use. As a result, Wireshark has become one of the most predominant network protocol analyzers in use today.
Many authors have contributed to the success of Wireshark by providing ongoing development and maintenance of the application. Some consistently jump in to add their expertise, and others contribute only when they need a specific protocol dissector.
Anyone can be involved, as there is plenty of documentation on how to add a basic dissector. If you do modify Wireshark to add a dissector or visual enhancement, share your work with the Wireshark team so that everyone can benefit.
To see a current list of Wireshark authors, go to the Help menu choice, click About Wireshark and select the Authors tab, as shown in the following screenshot:

Figure 2.5 – The list of Wireshark authors
The Wireshark developer’s goal today is to ensure functionality on Windows, macOS, and Linux. You can use Wireshark on any number of computers as necessary. All the source code is available under the GPL and can be found in the current Wireshark source code repository.
At times, you might need a little more information or help to complete a task. Within the interface, there is a list of links that will take you to external resources.
Finding information
Across the bottom on the right-hand side of the Wireshark welcome interface, you will see the Learn label, where you will find the User’s Guide, Wiki, Questions and Answers, and Mailing Lists links. Below the links, Wireshark will list what version you are running and whether or not you are receiving automatic updates.
So that you can better understand what goes on when you are using Wireshark, the next section walks through the process of analyzing packets.
Understanding the phases of packet analysis
Packet analysis is the process of gathering traffic on the network, decoding it and dissecting the raw bits, and presenting it in a human-readable format for analysis, as shown in the following diagram:
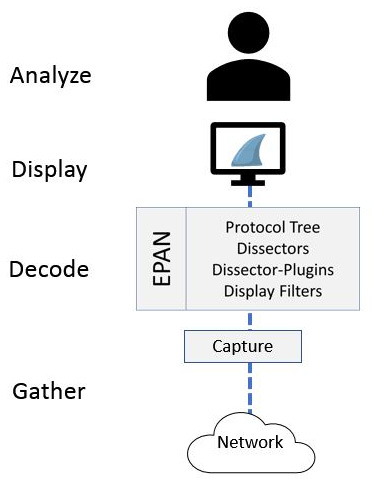
Figure 2.6 – The phases of packet analysis
Regardless of the software used, there are four main phases of packet analysis: gather, decode, display, and analyze. In this section, we’ll review each of the phases, starting with the first step, gather, where we collect the data from the network.
Gathering network traffic
When you launch Wireshark, a welcome screen displays a list of available network connections on your current device. In most cases, you will have more than one interface. To begin capturing immediately, you can select an active sparkline and begin the capture.
Alternatively, you can go to the Capture menu, and then go to the Options tab. This will open the following window:

Figure 2.7 – The Capture Options window
Keep in mind that there are two key areas that will enable you to gather traffic: capturing in promiscuous mode and using a capture engine. Let’s first discuss why it’s important to enable promiscuous mode prior to capture.
Capturing in promiscuous mode
When gathering traffic with Wireshark, you can capture on all interfaces. However, so that you can see all the traffic that is coming into the network interface card, make sure you select one of the following when in the Input tab of the Capture Options dialog box:
- Check the box next to the interface under the Promiscuous column header, as shown in the middle of the Capture Options dialog box.
- Check the Enable promiscuous mode on all interfaces box, as shown in the lower left-hand corner of the Capture Options dialog box.
After choosing an interface to listen on and placing it in promiscuous mode, the interface gathers up network traffic. To achieve this, a capture engine is required. Let’s explore this concept next.
Using a capture engine
Part of effectively capturing traffic is having an appropriate packet capture (pcap) engine installed. A pcap engine provides an application programming interface (API) that can capture traffic from the network so that it can be processed by the operating system.
As a result, when installing Wireshark, you will see a window appear that prompts you to install Npcap. Frequently, people aren’t really sure if they should install Npcap. However, as shown in the following screenshot, Wireshark requires either Npcap or WinPcap to capture data:
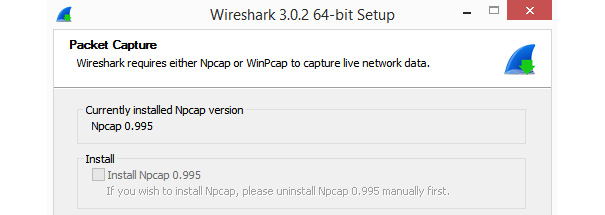
Figure 2.8 – The Wireshark prompt to install Npcap
If you don’t install either Npcap or WinPcap, Wireshark won’t run as expected.
Note
While WinPcap is available for download, it is no longer actively maintained. As a result, Npcap is the preferred capture engine to use when installing Wireshark on a Windows machine.
Once you have gathered the traffic, the next step is to convert the raw bits and decode them into the proper protocol.
Decoding the raw bits
Traffic enters a network interface card in binary form, one frame at a time. The following diagram illustrates converting bits into a human-readable format:
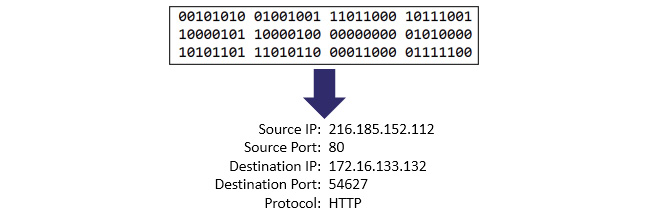
Figure 2.9 – Converting bits into a human-readable format
While in this phase, Wireshark uses the Enhanced Packet Analyzer (EPAN), which decodes the bits into human-readable form.
Stepping through the EPAN
Prior to 2006, Wireshark was called Ethereal. The name has since changed, however, the main core is the same. EPAN is the packet-analyzing engine for Wireshark that uses dissectors (also known as decoders). The dissectors provide information on how to recreate the protocols in the proper format according to the appropriate Request for Comments (RFC) or other specification. EPAN contains four main APIs, as shown in the following diagram:

Figure 2.10 – The contents of the EPAN
The EPAN components are described as follows:
- Protocol tree: This displays the detailed analysis of a single packet.
- Dissectors: These provide information on how to break down the protocols into the proper format.
- Dissector-plugins: These use dissectors as separate functions.
- Display filters: These allow you to filter captured data.
In most cases, Wireshark is able to correctly identify and dissect the protocol. However, there are times when you will need to help Wireshark decode the protocol. You can achieve this by right-clicking the frame and selecting Decode As…, which will bring up the following window:
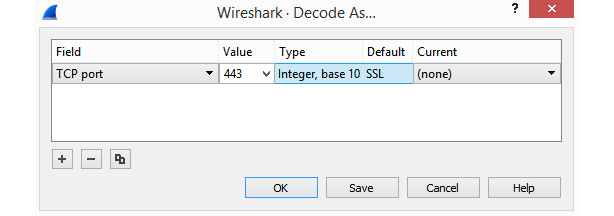
Figure 2.11 – The Decode As... window
Once in this window, you can modify the values to match the appropriate protocol. This function is very useful when protocols either don’t have a dedicated port or they’re running on a different port compared to usual. For example, you should use Decode As… when HTTP is running on port 8080 instead of port 80.
Once the bits have been converted into the proper format, the next step is to display the results in a human-readable format.
Displaying the captured data
In Wireshark, along with many other packet analysis tools, there are many options to enhance your graphical experience. When you open a packet capture in Wireshark, the default layout for the main display is in three panels, as shown in the following screenshot:

Figure 2.12 – Wireshark’s main display, showing three panels
The three panels are defined as follows:
- Packet list: This is a list of all the captured packets, where each line represents a single packet. If there are too many packets to fit in the panel, the user can use the scroll bar on the right to navigate through the capture.
- Packet details: This displays the details of a single packet and includes the protocols and field values. It also displays Wireshark-specific hints. For example, when examining a Transmission Control Protocol (TCP) header, you will see [Stream index: n] listed below the source and destination ports. However, there is no field value called stream index. A stream is a communication between two endpoints that comprises the following:
- Endpoint A’s socket [IP address and port]
- Endpoint B’s socket [IP address and port]
To help keep track of all the streams, Wireshark lists each stream in a TCP header. This is shown in the following screenshot:

Figure 2.13 – A packet details panel
- Packet bytes: This is a hexadecimal representation of a single packet, as shown in the packet details panel. Any plain text data is displayed on the right-hand side, as shown in the following screenshot:

Figure 2.14 – A packet bytes panel
Note
The default view for the packet bytes panel is hexadecimal. However, you can change the view to bits by right-clicking anywhere in the panel and selecting Show bytes as bits.
While the default layout is three panels, you can personalize this view at any time.
Changing the layout
To change the appearance of the main window, go to the Edit menu choice and then select Preferences. Once in the Preferences window, select Layout, where you can change your layout to one of many different configurations, as shown here:
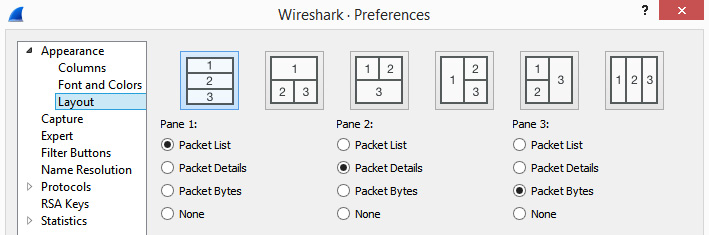
Figure 2.15 – Preferences | Layout
After Wireshark displays the results of the capture, we then move to the final stage of packet analysis: analyze.
Analyzing the packet capture
The analysis phase can be in either real time or by using a pre-captured file to troubleshoot and examine the captured traffic. Analysis can be done by using the many built-in tools in Wireshark, which include the following:
- Filtering traffic to display specific types of flows, such as DNS or HTTP traffic
- Searching for specific packets, for example, tcp.port == 443
- Turning on the coloring rules or using the expert system to easily spot problems
- Following the stream to see the details of a single conversation
- Doing a deep packet analysis of individual frames and examining the field values of each of the headers
Wireshark’s Statistics menu choices can range from basic information features such as Capture File Properties to more detailed analysis such as Conversations, Flow Graphs, and Stream Graphs.
Along with the tools within Wireshark, you can also subset the data to share a smaller file with coworkers and add comments to the entire file or within an individual frame.
Although the GUI is easy to use and understand, the Wireshark interface, with all its enhancements, coloring rules, and shortcuts, can be resource-intensive. As a result, it’s best to become familiar with some of the CLI tools, which we will cover in the next section.
Using CLI tools with Wireshark
Wireshark has several CLI tools that complement its basic functionality and will allow you to perform several tasks, such as editing, splitting, and manipulating packet captures. The following table is a summary of some of the tools available:
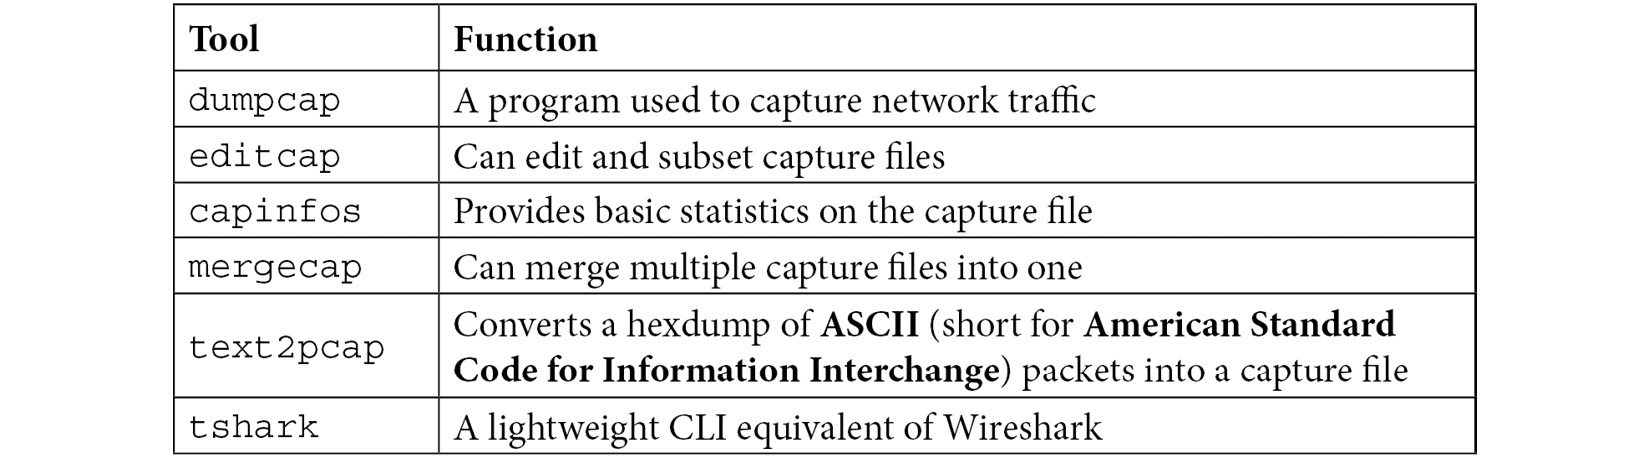
Table 2.1 – Wireshark’s built-in CLI tools
All of the CLI tools are baked into Wireshark, however, they are also available to use as a lightweight solution when working work with packet captures.
Next, let’s take a look at tshark, which is a great alternative to use when you need to conserve resources.
Exploring tshark
Part of the Ethereal development process included Terminal Ethereal (Tethereal), which was a CLI tool. Tethereal was later renamed Terminal Wireshark (tshark).
To capture using tshark on a Windows machine, go into the CLI and build a command as the following example shows:
C:Program FilesWireshark>tshark -i “ethernet 2” -w Test-Tshark.pcap -a duration:10
Keep in mind, if you have multiple interfaces, you will need to find which interface is active by using ipconfig.
Note
Commands on a Windows machine are not case-sensitive.
To run the tshark example, follow these steps:
- Begin the command with tshark.
- Identify the interface by using -i, then entering the interface name.
- To write to a file, use -w, then enter the filename and path. Make sure you add the extension.
- To set the duration, use -a, which is capture auto-stop, and set the duration in seconds.
- Press Enter to begin the capture.
When complete, locate and open the pcap file in Wireshark. If you don't send the output to a file, you will see a list of packets captured on the screen:
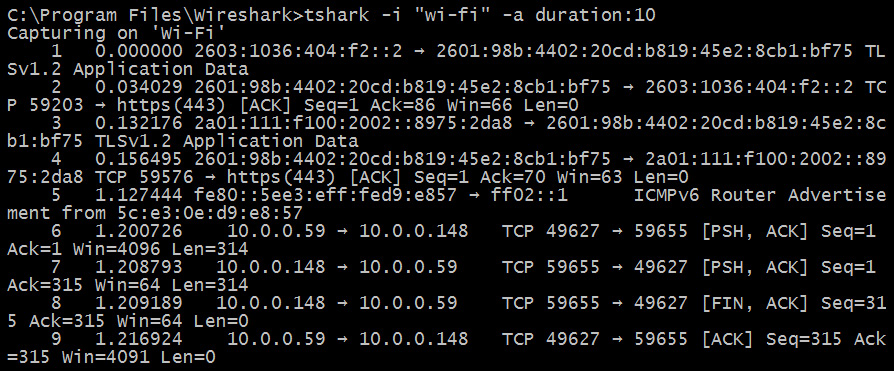
Figure 2.15 – Output from running tshark
The Wireshark documentation found at https://www.wireshark.org/docs/wsug_html_chunked/ChCustCommandLine.html lists a number of switches to use with tshark. Many are the same options that you can use while using the GUI, such as adding filters and specific field values, and include the following:
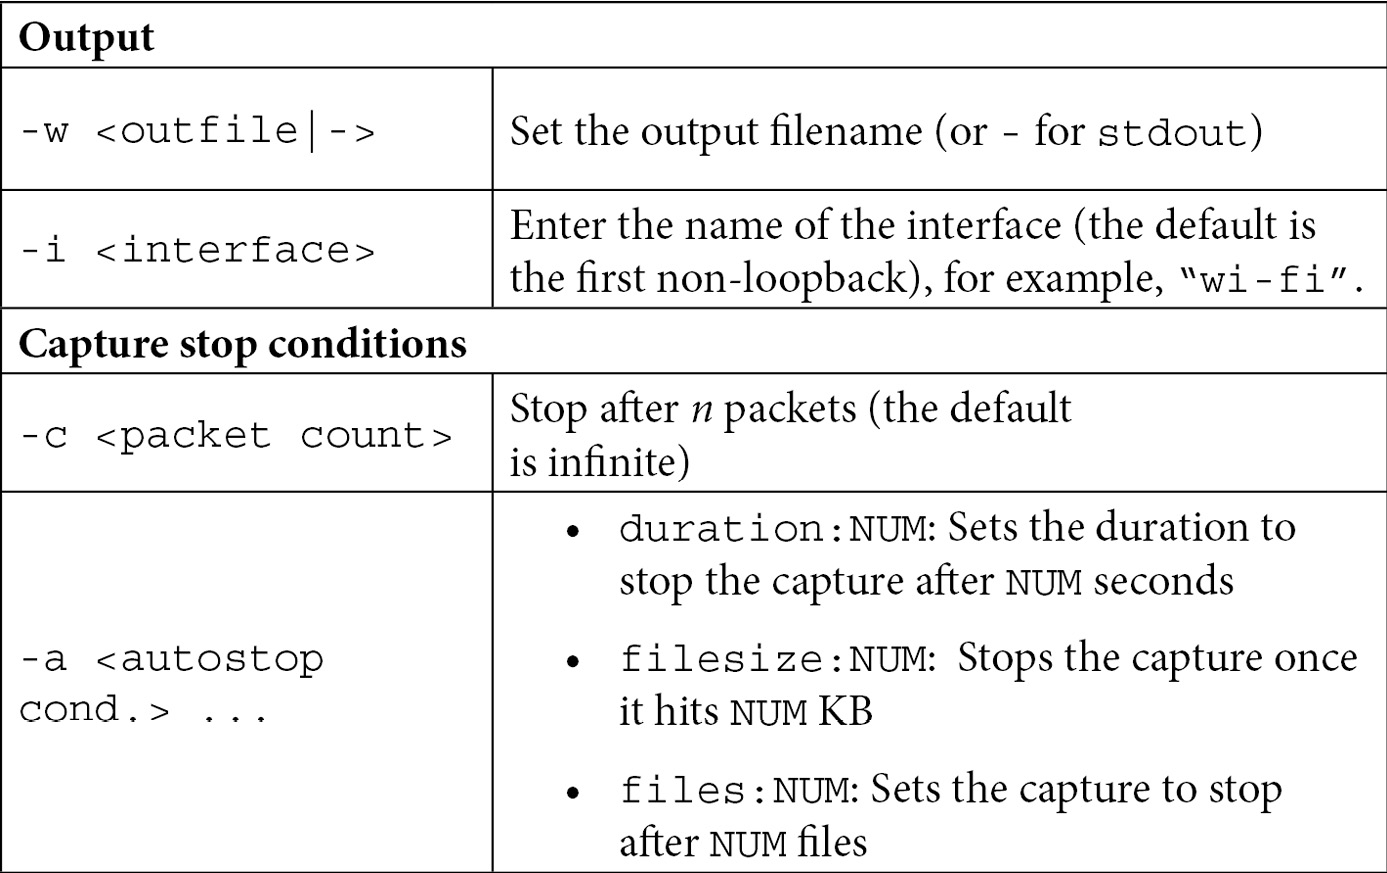
Table 2.2 – tshark options
The tshark CLI tool can evaluate any protocol that can be dissected by Wireshark. If you aren’t sure if a specific protocol is supported, you can check the protocol list in the Preferences dialog box.
Dissecting protocols
Wireshark is loaded with hundreds of protocols to dissect, with new protocols added every year. To see whether a specific protocol is supported, go to Edit, then Preferences (as shown in the following screenshot), and scroll to see the desired protocol:

Figure 2.17 – The Wireshark Preferences dialog with the list of protocols
Once in the protocol Preference window, you can modify the way Wireshark dissects the protocol. For example, in the preceding screenshot, AOL Instant Messager uses TCP port 5190, which can be changed if another port is to be used.
Summary
In this chapter, we took a brief look at the Wireshark interface. We learned how you can quickly begin capturing by clicking on a sparkline, easily add columns to the interface, and use the intelligent scrollbar coloring to identify trouble spots. You can now appreciate how each new version of Wireshark improves with the help of the many developers constantly updating the software. We also covered where you can find keyboard shortcuts and additional information.
We then explored the phases of packet capture, from gathering network traffic to processing it into a human-readable format for analysis. Finally, we saw how because Wireshark can be resource-intensive, it’s sometimes better to use a CLI tool such as tshark, a lightweight application for capturing packets.
In the next chapter, we will explore downloading and installing Wireshark on various operating systems such as Windows, macOS, and Linux. We’ll then take the time to explore the different capture engines, and we’ll walk through a Windows installation and compare the different download options. Finally, we will look at the various resources that are available at https://www.wireshark.org/.
Questions
Now, it’s time to check your knowledge. Select the best response, then check your answers, which can be found in the Assessments appendix:
- A(n) _____(or a moving graph symbol) represents actively exchanging data. If present, you can select that interface and begin capturing traffic.
- GPL
- sparkline
- API
- Wiki
- So that you can see all the traffic that is coming into the network interface card, make sure the card is in _____ mode.
- sparkline
- RFC
- generous
- promiscuous
- A _____ engine provides an API to capture traffic from the network before the traffic is processed by the operating system.
- CACE
- pcap
- tcap
- capinfos
- _____ provides information on how to break down the protocols into the proper format, according to the appropriate RFC or other specification.
- Protocol tree
- Dissector filters
- Capinfos
- Dissectors
- Wireshark has several CLI tools that complement the basic functionality, ____ can merge multiple capture files into one.
- tshark
- capinfos
- mergecap
- text2pcap
- If you don’t install the appropriate _____, such as Npcap or WinPcap, Wireshark won’t run as expected.
- Prior to running tshark on a Windows machine, you’ll need to identify which interface is active using the _____ command.
- netstat
- ipconfig
- ping
- powercfg