
Appendix
Denison Organizational Culture Survey: Overview and Resource Guide
The Denison Organizational Culture Survey played an important role in all of the case studies presented in this book. The survey results were used in two very different ways. First, the survey results were used for tracking the progress of each firm as their story unfolded. This helped to substantiate our claim that these were companies that had made some real progress and also helped us to pinpoint some specific areas that showed more clearly the kind of progress they were making. In fact, several of the cases in the book were originally selected for this study because the positive changes in their survey results suggested that they had made a real transformation in both their organization and their business.
But the survey results were also used in a second way: as an intervention. The strengths and challenges defined by the survey results were used to drive the transformation process. The patterns identified by the survey helped focus attention on key priorities for change and helped guide the transformation process. The results served as a basis for feedback and action planning throughout the organization, so that managers could use the feedback to help plan the improvement process. Annual surveys over a period of several years also brought a new level of accountability to the ongoing change process.
This appendix provides a more detailed background on the survey and serves as a link to an extensive set of resources that back up the simple analyses that we present in each chapter. Here we address several key questions about the survey results, the benchmarking process, and the feedback and action planning process. We also present a description of the validation research and a summary of the research linking culture and performance that is the background for the model and the survey.
Interpreting the Survey Results
The core of the Denison Organizational Culture Survey is a sixty-item survey, with five questions about each of the twelve indexes in the model (Denison & Neale, 1996). The survey uses a five-point Likert scale, in which 1 = strongly disagree and 5 = strongly agree. This survey was developed out of the research done by Denison and his colleagues over the years, linking corporate culture and business performance. The model and the survey questions operationalize the characteristics of an effective organizational culture that were defined by the research. This research stream is summarized in greater detail later in this appendix.
The culture profiles presented in each of the chapters are simply an overview of the survey results. The more detailed results include a summary of the scores for all sixty items. Here we present a sample report and a brief example of how the survey was used in a real project. The seven-page sample report is presented in Figures A.1 through .7. This example shows the profiles for two companies that have recently merged: a large American petrochemical company and the German specialty company it acquired. The acquiring company was about twenty times bigger than the acquisition, and the acquisition was folded into a division of the parent company that combined a set of closely related technologies to form a new global business unit.
Figure A.1 Culture Survey Results for Parent and Acquisition Companies
Source: Denison and Neale, 1996. Reprinted with permission. All rights reserved.
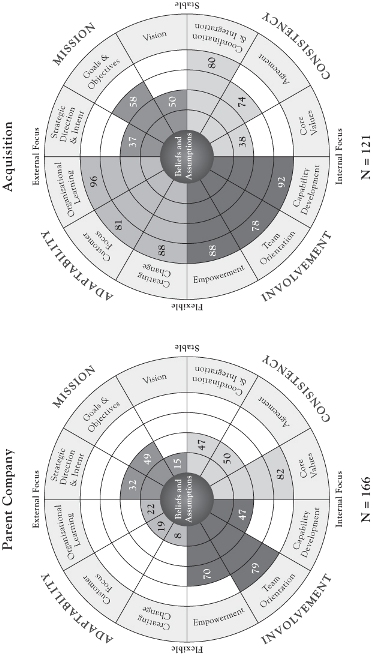
Figure A.2 Gap Report
Source: Denison and Neale, 1996. Reprinted with permission. All rights reserved.
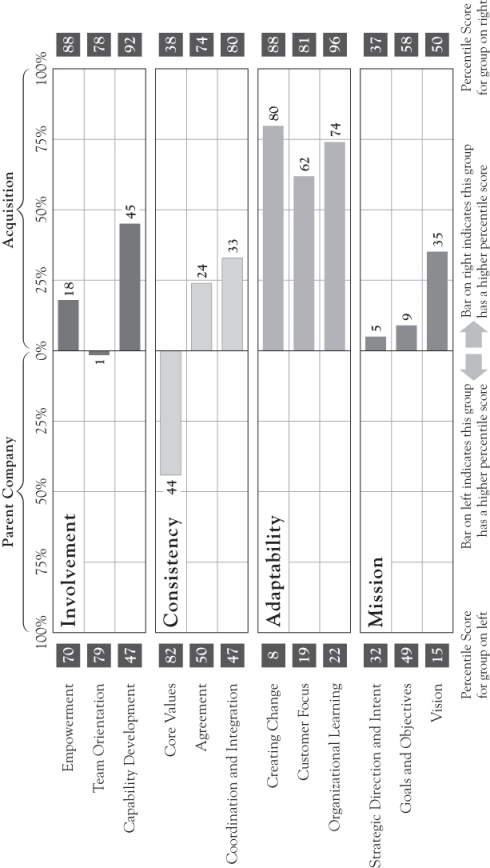
Figure A.3 Company Comparison for Involvement
Source: Denison and Neale, 1996. Reprinted with permission. All rights reserved.
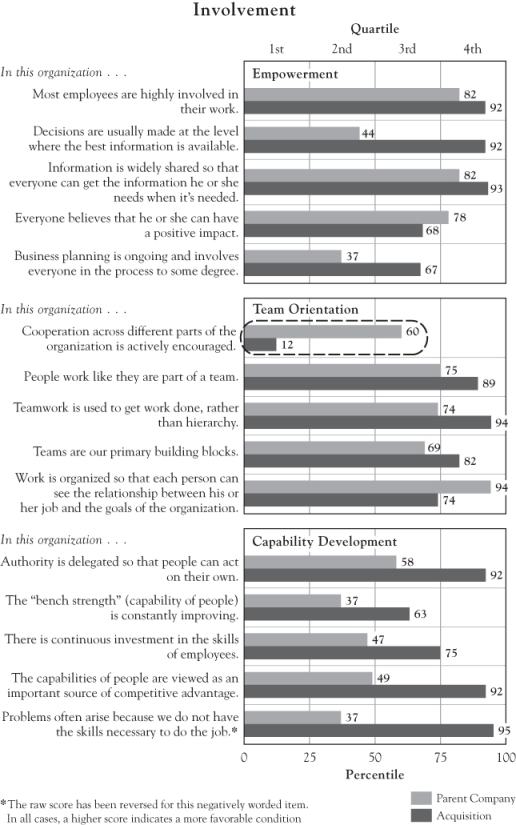
Figure A.4 Company Comparison for Consistency
Source: Denison and Neale, 1996. Reprinted with permission. All rights reserved.
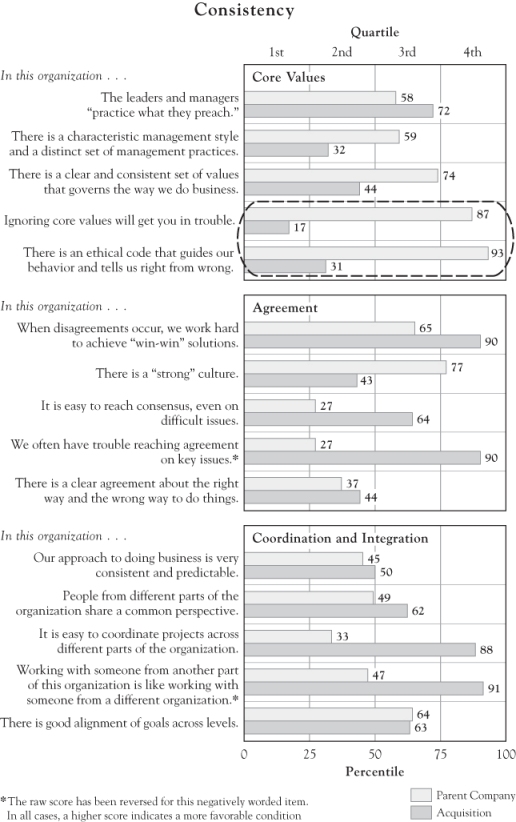
Figure A.5 Company Comparison for Adaptability
Source: Denison and Neale, 1996. Reprinted with permission. All rights reserved.
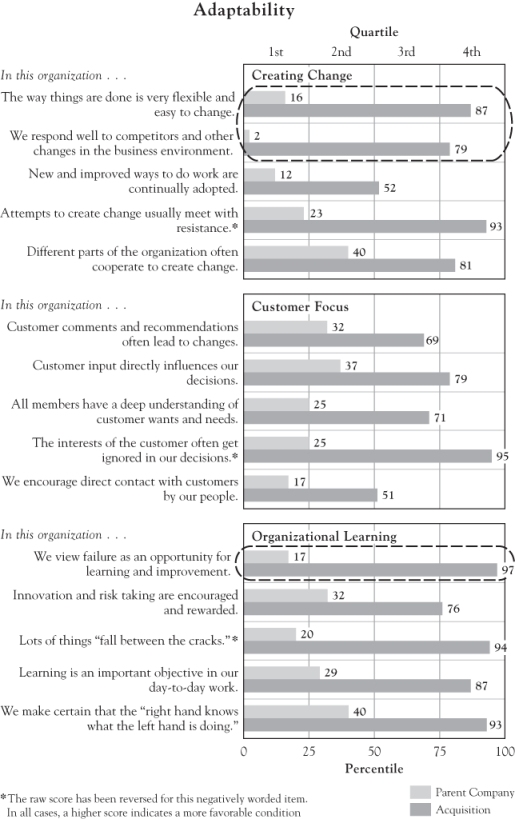
Figure A.6 Culture Survey Results for Mission
Source: Denison and Neale, 1996. Reprinted with permission. All rights reserved.
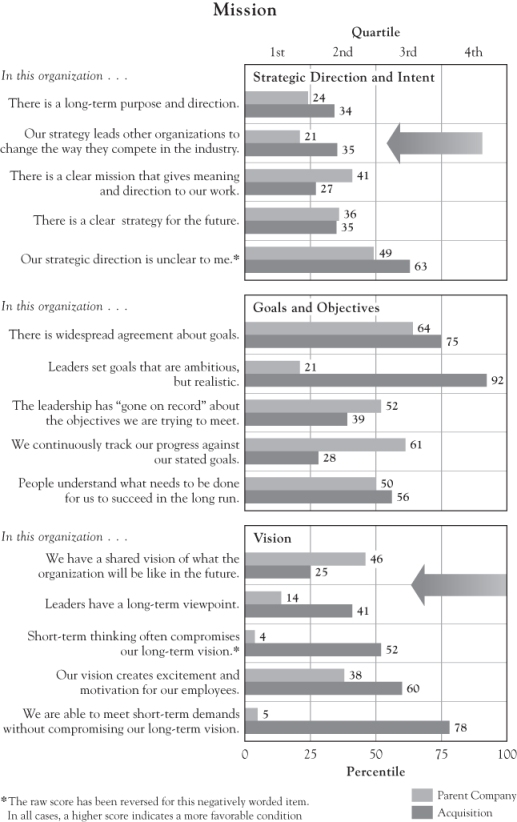
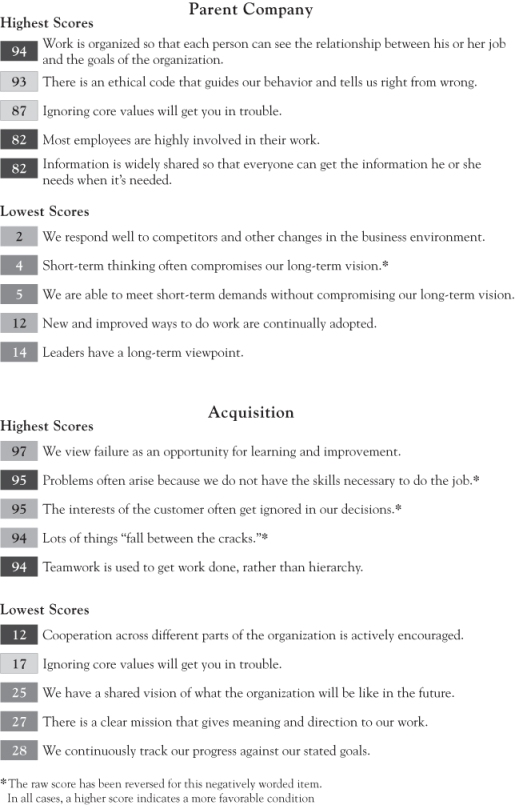
Figure A.7 Culture Survey Comparison: Highest and Lowest Scores
Source: Denison and Neale, 1996. Reprinted with permission. All rights reserved.
This example presents detailed results for both companies and shows the contrast between the responses from the parent company and the acquisition. In the parent company, we surveyed all of the managers who were in the global business unit that absorbed this acquisition. In the acquisition, we surveyed all of the managers in the company. About 80 percent of the managers responded to the survey in each of the organizations. These data were collected just as the merger was approved and were presented to the transition team the very first time that they met together.
The overall profile on the first page of the report (Figure A.1) presents a classic picture, familiar to all of those who have pursued growth through acquisition. The dynamic, entrepreneurial, customer-focused acquisition is now a part of a much larger parent company that appears to be much less adaptive and flexible than the company that they acquired. The parent company paid top dollar for the acquisition. If the acquisition could influence the parent company to become more flexible, it would be a bargain. However, if the parent company makes the acquisition less adaptive, then it's not a very good deal. The results also show that both companies are fairly strong on involvement, but neither one has a very strong sense of mission. The results are mixed for both companies on consistency.
The more detailed results on pages two through seven of the report (Figures A.2 through .7) show the picture more clearly. The “Gap Report” in Figure A.2 is a summary of the index scores presented in the profile in Figure A.1, showing clearly that the acquisition had stronger scores in ten out of twelve of the indexes, and that the acquisition had dramatically stronger scores in all areas of adaptability.
Page three of the report (Figure A.3) summarizes the results in the area of involvement. There are five items reported for each index. The scores for individual items, like the scores for the indexes, are presented as percentiles. The percentile scores indicate the percentage of firms in the benchmark database that scored lower than the target firm. So a percentile score of 82 for the parent company on the first item, “Most employees are highly involved in their work,” means that the parent company scored higher than 82 percent of the firms in the benchmark database. The benchmark database, a large global sample of around a thousand firms, is described in greater detail later in this appendix.
Page three of the report also shows the contrasts between the two firms on each involvement item. For example, we have highlighted the item “Cooperation across different parts of the organization is actively encouraged.” The big gap between these two scores shows a positive difference in favor of the parent company—it does appear that they put a lot of effort into and emphasis on coordination. The acquisition, dynamic as it is, operates as a fairly independent series of teams and departments that don't always emphasize cooperation.
Page four of the report (Figure A.4) summarizes the results for the consistency items. Here, for sake of illustration, we have highlighted two of the core values items: “Ignoring core values will get you in trouble” and “There is an ethical code that guides our behavior and tells us right from wrong.” These items both show that the parent company has a far stronger set of core values than the acquisition. This worried the leaders of the acquired company, because they felt that the core values of the parent company were going to be imposed on them after the merger.
Page five of the report (Figure A.5) provides the results for adaptability, which show some of the biggest differences between the two companies. The first two items in the Creating Change index are highlighted to show some of the most extreme gaps in the areas of flexibility and the quality of the response to competitors. The five items in the second index, Customer Focus, also show big gaps across the board. In the third index we have also highlighted the item, “We view failure as an opportunity for learning and improvement,” which shows a difference of 80 percentile points between the two companies!
Page six of the report (Figure A.6) shows the results for mission, which tends to show that there is plenty of room for improvement in both companies on this dimension. We've highlighted some of the results for strategic direction and intent and for long-term vision to show areas where both companies can use some help. The final page of this report (Figure A.7) simply summarizes the high and low scores for each of the organizations.
All of the case studies in this organization have used detailed reports like this one for the organization as a whole and for the many different parts of the organization. For some organizations we produce literally hundreds of reports to help them understand the dynamics of different parts of the firm and to support a feedback and action planning process that addresses the needs of both the organization as a whole and the individual work groups within it. For more information on the survey and the different reporting formats, please visit our website, www.denisonconsulting.com.
Feedback and Action Planning
In each of the organizations discussed in this book, there was a substantial intervention that was designed to help turn the survey analysis into action. The most basic part of this effort was the feedback and action planning process that took place in each company. The people discussed the results in order to understand their meaning, see the pattern of strengths and weaknesses more clearly, and connect those results to opportunities for action.
This process usually started at the top, when we made a presentation of the results to the top management team. In most cases we presented the results, helped them interpret the patterns of strengths and challenges, and then facilitated a discussion that set some priorities for action for the team and the organization. The next step in the process was usually to move down the hierarchy with a feedback and action planning process at the division, region, country, function, or departmental level. Sometimes we did this ourselves, sometimes we worked with consultants, and sometimes we trained internal consultants who supported this part of the process. In some cases, especially after the first year of this process, the feedback and action planning process was largely led by the managers and executives themselves as they integrated this information into their regular management process.
Communication about the priorities for action was also a critical part of this process. Organizations that established a mechanism to share their priorities for change made the most progress. We even developed a web tool called the Action Planner for one client who was trying to summarize the priorities for action across hundreds of work groups around the world. The companies that got the most value from this also used the action planning process to share best practices for leading change across the organization, particularly when the feedback and action planning process included multiple units such as plants, stores, regions, countries, or departments that had different patterns of culture scores and different levels of performance. Discussions among the leaders of high- and low-performing parts of the organization almost always led to the sharing of good ideas.
Many companies also linked the feedback and action planning process to some aspect of their annual planning cycle and used the survey results to help guide their existing planning process. For example, one of the companies that we worked with held an annual “Strategy Week” for each of their four business units in June each year. The second year that they did the survey, they decided that they wanted to have all of the results ready for each of the business units so that it would inform their discussions during Strategy Week. Other companies always plan to have their results ready in September and October so that the results can support their planning process for the coming year.
Once the priorities for action are established, they can develop in a number of different directions. Some organizations need support in strategy development or strategy implementation, while others need a vision process or a balanced scorecard. Some need focus groups with their customers or some training in the process of leading change. Some need to create a network of cross-functional teams in product development, and others need to redefine their cultural brand to help with their recruiting. Some need help in organizing their supply chain, or in improving their quality, or in redefining their core values. This is just a short list of the types of things that often happen as companies begin focusing on their priorities for action. These priorities often imply that we need to bring in other forms of consulting support to help lead the changes that are required.
Many times, client organizations will ask us questions like “How do we improve our scores on customer focus?” The simple answer to this is that we don't have twelve silver bullets that we use to drive the improvement process. Why not? Because the solutions to a company's challenges are always very specific to their current situation. There are lots of great solutions looking for problems in the management literature. They are very powerful when used well in context, but they can be very destructive when applied across the board without much attention to the context. The questions that we always ask include: What's already being done? What's most common among the competitors you admire? What have you tried that didn't work? Where are the successes in this area that you need to expand? The key points of leverage to drive the change process become clear only when the context is well understood.
But even though each organization needs to find their own solutions to their own challenges, we have found that it does help if we can provide clients with lots of examples of how other companies have made improvements in their own organizations. Even though we don't recommend applying these suggestions directly without some serious thinking about how they fit, we do provide two summaries of the experiences of our clients in two documents on our website: “Pathways to Performance” and “Levers for Change.”
The Benchmarking Process
Nearly all of the results that we present for the Culture Survey are presented in the form of percentiles. Why do we use percentiles? Because they allow us to present benchmarked results. Responses for all items are presented on a 100-point scale, and the benchmarking eliminates the noise of item-specific variation that often makes survey results so difficult to interpret.
When we do workshops and training sessions, we use an exercise that is presented in Table .1. When we first present the exercise, we only show the first two columns in the table: Mean Score for each of the items and Percent Favorable. We then ask the group to use that data to create a set of recommendations for the CEO of the organization. They are usually very creative and have lots of fun coming up with great ideas about how the people are probably highly engaged, but it will take greater vision and awareness of common purpose in order to build better coordination, and so on. Then we let the air out of the balloon, by showing them the last column that shows that each of these scores is exactly average—50th percentile. That's by design, since we picked the items in this exercise to reflect the 50th percentile for the highest and lowest mean scores with the items in the survey.
Table .1 Why We Use Percentiles
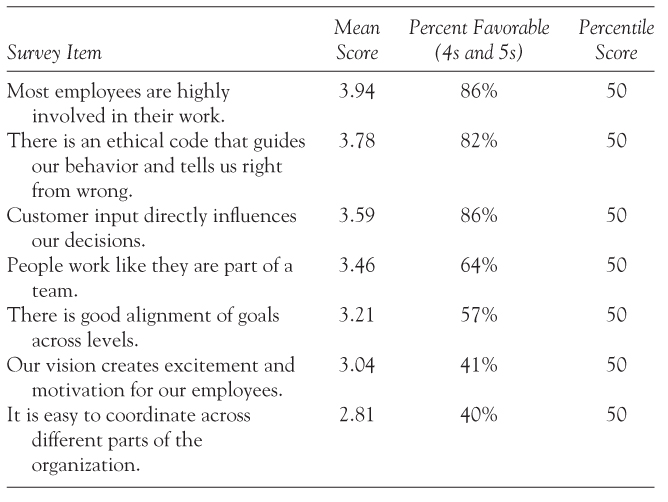
Then we ask a few simple questions: What would happen to the grand mean of the first item if it read “All employees are highly involved in their work” rather than “Most employees are highly involved in their work”? They quickly get this part right—the grand mean would go down, because using the word “all” rather than “most” sets a higher standard. How about the item with the lowest grand mean? “It is easy to coordinate across different parts of the organization.” Using the word “easy” makes it very hard for respondents to give a highly favorable response to this item. So the mean score and the percent favorable response for this item tend to be lower, even though this mean score is still exactly the average.
When organizations use mean scores or percent favorable response scores to interpret results, their interpretation is heavily influenced by the way that the items are written. The items that set the lowest threshold get the most positive responses. The items that set the most difficult threshold get the least positive responses. Looking at items like this without benchmarks makes it very easy to identify the strengths and weaknesses of the organization based on the way that the survey items are written. That's bad news. Benchmarking eliminates this problem immediately. So we believe that it is important to use benchmarking whenever possible.
The most recent norms for the Culture Survey, created in 2011, are based on 931 organizations that were rated by over 465,000 total respondents. All organizations have taken the survey within the past ten years. On average, organizations included in the benchmark were rated by about five hundred employees. The number of respondents for each organization varies from as few as six respondents (in an organization with six people) to as many as 65,000 respondents. We include both small and large organizations in the benchmark because both small and large organizations will be compared to the benchmark. There are many important differences between small and large organizations, but there are not very many systematic differences in their survey scores. To calculate the overall benchmark, each individual organization is weighted equally. In other words, an organization that surveys three thousand people does not have a larger influence on the benchmark than an organization that surveys three hundred.
This benchmark database is updated every other year. For a detailed description of the benchmark database, please refer to the summary report on our website (Uehara & Denison, 2012).
Validation
The original development of the Culture Survey included several stages of refinement. Building on the earlier research by Denison (1984, 1990) and Denison and Mishra (1995), we developed a set of five items for each of the twelve indexes. Denison and Mishra (1995) provide the best account of the combination of qualitative and quantitative research that led to the development of the model itself. We went through several cycles of adding new items, collecting more data, testing the validity, and refining the measures. A series of working papers summarizes this research at several different stages of evolution. In general, our validation testing has always focused on the following set of priorities:
The validity testing that we've done over the years has generally shown positive results on all of these criteria of validity testing. A recent review article, which provides the best overall summary of the validation process, is available on our website (Denison, Nieminen, & Kotrba, in press). Other studies cited in the next section, summarizing the background research, also include a range of validation studies.
Research Overview
As we detailed in Chapter One, the Culture Survey and the conceptual model behind it were developed to operationalize a theory of cultural effectiveness that focused on the four key traits we have identified as drivers of organizational performance: involvement, consistency, adaptability, and mission. The traits were developed from a line of research by Denison and colleagues that combined qualitative and quantitative methods to examine the cultural characteristics of high- and low-performing organizations. This section gives a brief summary of that research and provides a number of citations.
The early research (Denison, 1982; 1984; 1990; Denison & Mishra, 1995) focused on the link between corporate culture and organizational effectiveness, and gradually developed the conceptual model as a way to frame the set of findings that emerged from the research about the culture characteristics of effective organizations. A second set of studies (Denison, Haaland, & Goelzer, 2003; Fey & Denison, 2003; Yilmaz & Ergun, 2008; Bonavia, Gasco, & Tomás, 2009; Denison, Xin, Guidroz, & Zhang, 2010) has a more global focus. This set of studies examines several global samples of firms and also includes specific studies that focus on Russia, Turkey, Spain, and China. A third stream of research includes more recent studies that further examine the link between organizational culture and business performance over time (Smerek & Denison, 2007; Gillespie, Denison, Haaland, Smerek, & Neale, 2008; Kotrba, Gillespie, Schmidt, Smerek, Ritchie, & Denison, 2012; Boyce, 2010). Finally, two recent reviews of the culture and performance literature by Sackmann (2011) and Denison, Nieminen, and Kotrba (in press) set this research in the broader stream of the organizational studies literature. Together, these studies help support the idea that the highest-performing organizations find ways to empower and engage their people (involvement), facilitate coordinated actions and promote the consistency of behaviors with core business values (consistency), translate the demands of the organizational environment into action (adaptability), and provide a clear sense of purpose and direction (mission).
The meaning and importance of similarly defined concepts have been described by a number of organizational scholars interested in the characteristics of high-performance organizations (Gordon & DiTomaso, 1992; Katz & Kahn, 1996/1978; Kotter & Heskett, 1992; Lawler, 1986; Martin, 1992; Mintzberg, 1989; Saffold, 1988; Schein, 2010; Selznick, 1957; Spreitzer, 1995, 1996). The culture model draws on contemporary theories of the dynamic tensions underlying organizational functioning and effectiveness (Denison, Hooijberg, & Quinn, 1995; Denison & Spreitzer, 1991; Quinn & Cameron, 1988) as well as classic approaches to studying the characteristics of effective social systems (Parsons, 1951; Katz & Kahn, 1966/1978; Lawrence & Lorsch, 1967). These tensions reflect the fundamental pushes and pulls experienced by the organization as it tries to accomplish the twin goals of external adaptation and internal integration (Lawrence & Lorsch, 1967; Schein, 2010).
Bonavia, T., Gasco, V. J., & Tomás, D. B. (2009). Spanish adaptation and factor structure of the Denison Organizational Culture Survey. Psicothema, 21, 633–638.
Boyce, A. S. (2010). Organizational climate and performance: An examination of causal priority. (Doctoral dissertation, Michigan State University).
Denison, D. (1990). Corporate culture and organizational effectiveness. New York: Wiley.
Denison, D., Hooijberg, R., & Quinn, R. (1995). Paradox and performance: Toward a theory of behavioral complexity in managerial leadership. Organization Science, 6, 524–540.
Denison, D., & Mishra, A. (1995). Toward a theory of organizational culture and effectiveness. Organizational Science, 6, 204–223.
Denison, D. R. (1982). The climate, culture, and effectiveness of work organizations: A study of organizational behavior and financial performance. (Doctoral dissertation, University of Michigan).
Denison, D. R. (1984). Bringing corporate culture to the bottom line. Organizational Dynamics, 13, 4–22.
Denison, D. R., Haaland, S., & Goelzer, P. (2003). Corporate culture and organizational effectiveness: Is there a similar pattern around the world? Advances in Global Leadership, 3, 205–227.
Denison, D. R., & Neale, W. S. (1996). Denison Organizational Culture Survey. Ann Arbor, MI: Aviat.
Denison, D. R., Nieminen, L., & Kotrba, L. (in press). Diagnosing organizational cultures: A conceptual and empirical review of culture effectiveness surveys. European Journal of Work and Organizational Psychology.
Denison, D. R., & Spreitzer, G. (1991). Organizational culture and organizational development: A competing values approach. Research in Organizational Change and Development, 5, 1–21.
Denison, D. R., Xin, K., Guidroz, A. M., & Zhang, L. (2010). Corporate culture in Chinese organizations. In N. Ashkanasy, C. Wilderom, & M. Peterson (Eds.), The handbook of organizational culture and climate (2nd ed., pp. 561–581). Thousand Oaks, CA: SAGE.
Fey, C., & Denison, D. R. (2003). Organizational culture and effectiveness: Can an American theory be applied in Russia? Organization Science, 14, 686–706.
Gillespie, M., Denison, D. R., Haaland, S., Smerek, R., & Neale, W. (2008). Linking organizational culture and customer satisfaction: Results from two companies in different industries. European Journal of Work and Organizational Psychology, 17, 112–132.
Gordon, G., & DiTomaso, N. (1992). Predicting corporate performance from organizational culture. Journal of Management Studies, 29, 783–798.
Katz, D., & Kahn, R. (1966/1978). The social psychology of organizations. New York: Wiley.
Kotrba, L. M., Gillespie, M. A., Schmidt, A. M., Smerek, R. E., Ritchie, S. A., & Denison, D. R. (2012). The effects of cultural consistency on business performance. Human Relations, 65, 241–262.
Kotter, J., & Heskett, J. (1992). Corporate culture and performance. New York: Free Press.
Lawler, E. (1986). High involvement management. San Francisco: Jossey-Bass.
Lawrence, P., & Lorsch, J. (1967). Organization and environment: Managing differentiation and integration. Boston, MA: Harvard University Division of Research.
Martin, J. (1992). Cultures in organizations: Three perspectives. New York: Oxford University Press.
Mintzberg, H. (1989). Mintzberg on management. New York: Free Press.
Parsons, T. (1951). The social system. London: Routledge & Kegan Paul.
Quinn, R., & Cameron, K. (1988). Paradox and transformation: Toward a theory of change in organization and management. Cambridge, MA: Ballinger.
Sackmann, S. A. (2011). Culture and performance. In N. Ashkanasy, C. Wilderom, & M. Peterson (Eds.), The handbook of organizational culture and climate (2nd ed., pp. 188–224). Thousand Oaks, CA: SAGE.
Saffold, G. (1988). Culture traits, strength, and organizational performance: Moving beyond “strong” culture. Academy of Management Review, 13, 546–558.
Schein, E. (2010). Organizational culture and leadership (4th ed.). San Francisco: Jossey-Bass.
Selznick, P. (1957). Leadership in administration. Evanston, IL: Row & Peterson.
Smerek, R., & Denison, D. R. (2007). Social capital in organizations: Understanding the link to firm performance. Academy of Management Best Paper Proceedings.
Spreitzer, G. (1995). Psychological empowerment in the workplace: Dimensions, measurement, validation. Academy of Management Journal, 38, 1442–1466.
Spreitzer, G. (1996). Social structural characteristics of psychological empowerment. Academy of Management Journal, 39, 483–504.
Uehara, K., & Denison, D. R. (2012). General report: 2011 DOCS norms. Ann Arbor, MI: Denison Consulting.
Yilmaz, C., & Ergun, E. (2008). Organizational culture and firm effectiveness: An examination of relative effects of culture traits and the balanced culture hypothesis in an emerging economy. Journal of World Business, 43(3), 290–306.