Using Performance Monitor
The Windows 2000 Performance utility enables you to track various aspects of the Windows 2000 operating system and installed applications. With the Performance utility, you can gather the data needed to tune the server for optimum processing of server requests.
The Performance utility included with Windows 2000 has changed considerably from the Performance Monitor utility included with Windows NT 4. Probably the most important and noticeable change is the capability to monitor each Web site, or Web instance, running on the Internet Information Services. This enhancement is a result of the change in the performance counters in Internet Information Services 5.
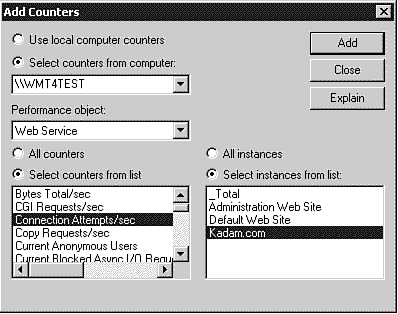
You can also monitor the total for all Web instances, which provides the same functionality as the Performance Monitor utility in Windows NT 4. If you have only one Web site configured in Internet Information Services, then monitoring specific Web instances will not be that beneficial. However, if you host multiple Web sites on one Internet Information Services server, then having the capability to monitor an individual Web site can be a powerful tool. Monitoring individual sites allows you to determine which sites are generating the most stress on your Web server. It also allows you to troubleshoot which Web site may contain poor coding, causing the performance of your Web server to decrease. Figure 13.3 shows the new Windows 2000 Performance utility.
Figure 13.3. The Windows 2000 Performance utility provides the much-needed feature of monitoring a specific Web site in addition to monitoring all Web sites as a group.

Another well-needed enhancement in the new Performance utility gives you the capability to allow Web site administrators to view performance statistics for their Web site. Because the Performance utility is now an MMC snap-in, you can create MMC modules for individual Web sites and grant access to those modules to the Web site administrator or developer for that site. This allows an administrator or developer to view and evaluate the performance counters for a specific Web site, but does not allow this information to be viewed for other Web sites on a shared Web server.
When your Web server is up and running, you should monitor it for performance issues. First, monitor the server to find a performance baseline. For baselines on our servers, I turn on logging and monitor key counters for one weekday. You may choose a different timeframe based on the usage of your Web site. Then, as your site grows, your users increase, or your hardware changes, you can compare the new performance statistics to those measured in your baseline. This tells you how much things have changed and helps you plan for future expansions.
When monitoring and optimizing your Web server, you will probably want to look at four objects: Internet Information Services Global, Web Service, FTP Service, and Active Server Pages.
Internet Information Services Global
The Internet Information Services Global object is used to measure the overall settings in Internet Information Services. The default counter in the Internet Information Services Global object is Total Rejected Async I/O Requests. This counter enables you to track the total number of rejected requests due to bandwidth throttling techniques. It is important to note that this counter will keep track of these requests from the time Internet Information Services is started. To clear this particular counter, you must stop and start Internet Information Services or reboot the server. If you are not using bandwidth throttling, this counter will not be of any value to you.
One of the counters that I use is BLOB Cache Hits %. Internet Information Services uses a portion of server memory to cache frequently accessed objects, as discussed previously in the "Web Site Hits" section. This cache improves the performance of the Web server by retrieving Binary Large Objects (BLOBs), such as graphical images, from memory rather than accessing the hard drive. If you see a decrease in this counter over time, you should add physical memory to your Web server to increase the size of the cache in response to the increase in object requests.
Web Service
The default Web Service counter—and the most useful one to the Web administrator—is Bytes Total/sec. This counter provides you the total number of bytes sent and received by all Web sites or a specific Web site. You can use this counter to determine which Web site is generating the most network traffic on your Web server and then follow the increase or decrease in total network traffic to your Web server. This is an excellent tool to help you plan for hardware upgrades to your Web server.
FTP Service
The FTP Service object has counters very similar to the counters found in the Web Service object. So, again, one of the more important counters is Bytes Total/sec. In this case, this counter measures the traffic for the same objects as the Web service counter, but only as they are accessed by using FTP.
Active Server Pages
With the increase of ASP content in today's Web sites, the Active Server Pages object is one of the more important objects. It can provide information on the usage of ASP code and also can assist in troubleshooting both code problems and performance issues. The Active Server Pages counter that can be of most use is Debugging Requests. This counter tracks the number of debugging documents requested by Internet Information Services. If this number is high, then the number of scripting errors in the ASP content is high, although this could indicate that a few poorly coded pages are receiving a lot of requests. Low numbers relate to low errors and indicate good coding.
You should also examine the global memory available. This may pick up on errors that would not normally be found through the Web services, such as ADO connections not being destroyed and other memory leaks.
