
Synthesis and Evaluation of Self-Healing Cerium-Doped Silane Hybrid Coatings on Steel Surfaces
Roohangiz Zandi Zand*; Kim Verbeken†; Annemie Adriaens* * Department of Analytical Chemistry, Ghent University, Krijgslaan 281-S12, Ghent, Belgium
† Department of Materials Science and Engineering, Ghent University, Technologiepark 903, Zwijnaarde (Ghent), Belgium
Abstract
This chapter explores the synthesis and self-healing properties of cerium-doped silane hybrid coatings. These coatings can protect steel structures from corrosion in marine environments. The analysis covers four main areas. First, effects of cerium ions, as a dopant, and bisphenol A (BPA), as a cross-linking agent, on the microstructure and corrosion resistance of hybrid coatings are examined. The self-healing properties of silane coatings doped with cerium nitrate and ceria nanoparticles are then evaluated via comparison of intact and artificially scratched films. The third and fourth sections of the chapter examine how the concentration of cerium nitrate and activation of ceria nanoparticles with cerium nitrate affect the ability of cerium-doped silane hybrid coatings to protect against corrosion.
Acknowledgments
The authors wish to acknowledge Ghent University for financial support and Arcelor Mittal Gent for providing the materials. The authors would also like to thank Peter Mast, Michel Moors, Christa Sonck, Veerle Boterberg, Sandra Van Vlierberghe, Babs Lemmens, and Vitaliy Bliznuk for technical assistance.
5.1 Introduction
Industrial equipment commonly faces the problem of corrosive degradation. While corrosion cannot be entirely avoided, it can be controlled and delayed by using well-designed alloys, corrosion inhibitors, protective coatings, and cathodic protection.1 Chromate coatings provide excellent protection against corrosion; however, their carcinogenicity has caused them to be banned in Europe since 2007, and a global ban is likely.2
As alternatives to chromate-based surface treatments, several classes of new pretreatment systems have been developed. Pretreatments employing functional silane coatings are particularly promising because they provide different chemical functionalities on a wide range of substrates, both metallic and nonmetallic. Silane coatings are generally uniform, robust, and reliable. They also present lateral resolution in the nanometer regime.3 Their good barrier properties arise through the formation of a dense—Si![]() O
O![]() Si—network, which hinders the penetration of corrosive species to the substrate. Thus, the effectiveness of silane coating pretreatments strongly depends on the barrier properties of the film.4–6 These barrier properties can be enhanced through the addition of small amounts of chemicals with specific properties, such as self-healing.7
Si—network, which hinders the penetration of corrosive species to the substrate. Thus, the effectiveness of silane coating pretreatments strongly depends on the barrier properties of the film.4–6 These barrier properties can be enhanced through the addition of small amounts of chemicals with specific properties, such as self-healing.7
Recent investigations of sol-gel processes have aimed to develop sol-gel coatings doped with environmentally compatible inhibitors, such as cerium compounds.7–10 These systems can combine the barrier properties of sol-gel coatings with the ability of the cerium ions to inhibit corrosion.3,10 Cerium ions inhibit corrosion by migrating through the coating to the location of attack (a defect in the coating) and then reacting to passivate the site. Therefore, they act as cathodic inhibitors at active sites through the precipitation of insoluble cerium hydroxide at local regions of high pH.10,11
Cerium nitrate can improve the protection of galvanized steel substrates from corrosion when used either as a conversion film12–14 or as a corrosion inhibitor through its addition to a silane formulation.3,15–17
The anticorrosion properties of silane coatings can also be improved by the addition of oxide nanoparticles. The nanoparticles can be synthesized in the films, as demonstrated for sol-gel coatings,5,18 or they can be added to the pretreatment solutions.18 Mg alloys pretreated with sol-gel coatings containing ZrO2 and CeO2 nanoparticles have been reported to show enhanced corrosion protection (due to the CeO2) and improved wear resistance (due to the ZrO2).18
Montemor et al.5,18 reported a new approach that involves the modification of bis- [triethoxysilylpropyl] tetra sulfide silane (BTESPT) with nanoparticles such as CeO2, SiO2, or CeO2![]() ZrO2. Improved corrosion resistance could also be achieved by initially activating the nanoparticles with cerium nitrate. Ceria nanoparticles were shown to be very effective fillers, improving both the barrier properties of the silane coatings and the overall corrosion resistance. The protective behavior depends on the concentration of nanoparticles; their activation with cerium ions leads to thicker and more protective silane films.
ZrO2. Improved corrosion resistance could also be achieved by initially activating the nanoparticles with cerium nitrate. Ceria nanoparticles were shown to be very effective fillers, improving both the barrier properties of the silane coatings and the overall corrosion resistance. The protective behavior depends on the concentration of nanoparticles; their activation with cerium ions leads to thicker and more protective silane films.
This chapter reports the creation and evaluation of self-healing properties in cerium-doped silane hybrid coatings (SHCs), which could be used as environmentally compatible protective coatings for steel surfaces that are subject to corrosion in specific environments. We focus on two different types of steels: austenitic 304L stainless steel (SS) and hot-dip galvanized steel (HDG). In NaCl solution, 304L SS has been reported to have greater corrosion resistance than HDG.19,20 The effects of various factors on the microstructure, morphology, and protective properties of the coatings were tested using both these substrates. The tested factors were the concentrations of cerium ions and the use of additives, including bisphenol A (BPA), cerium nitrate, and CeO2 nanoparticles.
The influences of cerium and BPA on the microstructures of the coatings were examined using Fourier transform infrared (FTIR) spectroscopy. The morphological and microscopic features of the coated substrates were evaluated using atomic force microscopy (AFM) and scanning electron microscopy (SEM). After corrosion testing, SEM was used to evaluate the samples. Corrosion of the sol-gel coatings was assessed via neutral salt spray tests, electrochemical impedance spectroscopy (EIS), and potentiodynamic polarization tests.
5.2 Experimental Procedure
5.2.1 Sample preparation
The silane solution was prepared by dissolving 4.084 mL 3-glycidoxypropyl-trimethoxy silane (GPTMS) (Merck, New Jersey, USA) in a mixture of 0.5 mL aqueous HCl (pH = 2) (H2O/Si mole ratio = 0.521) and an aqueous dispersion of activated ceria nanoparticles. The ceria nanoparticles (10 wt.% in water, particle size < 25 nm, Sigma Aldrich, St. Louis, USA) were activated by ultrasonic dispersion in an aqueous solution of cerium nitrate (Fluka, Buchs, Switzerland). The solution was placed in a sealed beaker and stirred at room temperature for 30 min at 240 rpm to hydrolyze and condense the silane precursors. BPA (Merck) was then added to the solution as a cross-linking agent. It was dissolved by mixing the solution for 80 min. To accelerate the condensation reaction, 0.0152 mL 1-methylimidazole (MI) (Merck) (MI/Si mole ratio = 0.01) was added to the solution, which was then stirred for 5 min. A clear, colorless, homogenous solution resulted. A set of silane solutions (S1-S11) with different molar ratios of CeO2/Si, Ce(NO3)3/Si, and BPA/Si was also prepared (Table 5.1).
Table 5.1
Composition of the Cerium-Doped Silane Coating Solutions
| Set | Molar Ratio (mol%) | ||
| CeO2/Si | Ce (NO3)3·6H2O/Si | BPA/Si | |
| S1 | — | — | 0.500 |
| S2 | — | 0.200 | 0.500 |
| S3 | — | 0.200 | — |
| S4 | — | 0.100 | 0.500 |
| S5 | 0.100 | — | 0.500 |
| S6 | — | 0.001 | 0.500 |
| S7 | — | 0.005 | 0.500 |
| S8 | — | 0.010 | 0.500 |
| S9 | — | 0.050 | 0.500 |
| S10 | 0.050 | — | 0.500 |
| S11 | 0.025 | 0.025 | 0.500 |

S1 and S2 used to study the effects of cerium addition on the corrosion performance of silica hybrid coatings (SHCs).
S2 and S3 used to study the effects of BPA on corrosion performance of SHCs.
S4 and S5 used to study the effects of CeO2 and Ce(NO3)3 on corrosion performance of SHCs.
S1, S4, S6, S7, S8, and S9 used to study the effects of cerium concentration on corrosion performance of SHCs.
S1, S9, S10, and S11 used to study the effects of activated ceria nanoparticles on corrosion performance of SHCs.
The metallic substrates were 304L stainless steel and HDG. The 304L SS was comprised of Fe with the following additives (by mass): 17.65% Cr, 8.59% Ni, 1.75% Mn, 0.41% Si, 0.25% Mo, 0.017% C, 0.45% Cu, 0.032% P, 0.0050% S, and 0.0049% Al. Coupons (4.98 cm2 area and 0.1 cm thickness) were made for the AFM, SEM, and electrochemical tests. Plates (7 × 15 × 0.1 cm) were used for the salt spray tests. The galvanized steel specimens each had an ~ 8 μm zinc coating, which had an area density of ~ 112 g/m2.
The 304L SS specimens were successively ground with 600 and 1200 grit emery paper and degreased with acetone in an ultrasonic bath for 10 min. Chemical etching was performed by immersing the samples in an alkaline solution (1 M NaOH) for 5 min at 50 °C. After rinsing in tap water and then in deionized water, the cleaned substrates were dried in air. The galvanized steel specimens were degreased using an alkaline cleaner. They were then washed with distilled water and dried in air.
Both types of sample were immersed in silane solution for 60 s. The coated specimens were dried at room temperature for 24 h. They were then cured at 25-130 °C for 90 min to initiate extensive cross-linking in the hybrid films.22 The thicknesses of the coatings were measured by profilometry (Check line 3000 pro, Germany).
5.2.2 Analytical methods
FTIR measurements of the coated samples were carried out using a Bio-Rad 575C spectrophotometer in the mid-IR range (4000-400 cm− 1). All spectra were taken at an incident angle of 45° normal to the surface of the specimen, with a spectral resolution of 4 cm− 1. For each measurement, 64 scans were collected.
AFM images were obtained under ambient conditions using a multimode scanning probe microscope (Digital Instruments, USA) equipped with a Nanoscope IIIa controller. 5 × 5 μm scans were recorded in tapping mode using a silicon cantilever (OTESPA, Veeco). Nanoscope software (version 4.43r8) was used to analyze the surface roughness, after the recorded images were modified using an automated X-Y-plane fit.
SEM measurements were performed using an XL30 SEM microscope equipped with an energy-dispersive X-ray spectroscope. The silane coatings were observed before and after EIS measurements. Secondary electron images were collected at 15 and 20 kV.
Corrosion of the coated substrates was evaluated via the ASTM B117 standard neutral salt spray test23 using a 5% NaCl solution. Prior to exposure, the back and edges of the plates were covered with adhesive tape. An artificial scratch that reached the substrate was made in the coating to allow assessment of possible delamination. Visual examination of the macroscopic surfaces was carried out at intervals throughout the exposure.
EIS and potentiodynamic polarization tests assessed the corrosion of the silane-treated substrates in a 3.5% NaCl solution. An Autolab PG-STAT 20 potentiostat equipped with a frequency response analyzer module was used to assess a three-electrode system, which consisted of an Ag/AgCl KClsat reference electrode, a platinum mesh counter electrode, and the sample as the working electrode. EIS was performed at room temperature at the open circuit potential. Data were obtained as a function of frequency (over the range 105-10− 2 Hz) using a sine wave with peak-to-peak amplitude of 10 mV. The samples were immersed in the electrolyte solution for 30 min before measurement, and measurements were conducted periodically. For each experiment, the measurements were repeated four times. Impedance fitting was performed using the appropriate equivalent circuits, using Z-view software (Scribner Associates Inc.).
Potentiodynamic measurements were performed over the range − 1500 to 1000 mV versus Ag/AgCl KClsat, at a rate of 1 mV/s. These measurements were also performed four times. Tafel extrapolation (conducted according to the ASTM Standard G3-89, 2004)24 was used to determine Icorr and Ecorr.
5.3 Results and Discussion
5.3.1 Effects of cerium ions and BPA on the microstructure and the corrosion protection of SHCs on 304L stainless steel
Magnified FTIR spectra of the SHC (S1) and the cerium-doped SHC (Ce-SHC) (S2) in the regions 500-1300 cm− 1 (Figure 5.1a) and 2800-4000 cm− 1 (Figure 5.1b) show main features that include bands corresponding to Si![]() O
O![]() Si sequences, OH groups, and
Si sequences, OH groups, and ![]() CH2 groups.
CH2 groups.
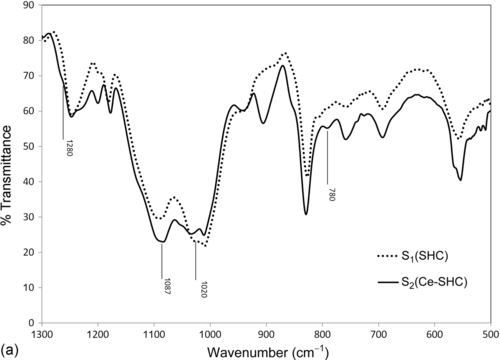

■ The strong peaks between 1000 and 1200 cm− 1 are associated with the Si![]() O
O![]() Si/C
Si/C![]() O
O![]() C asymmetric bond stretching vibration,25 which is the structural backbone of the hybrid material.25 The high-frequency band near 1020 cm− 1 is assignable to the antisymmetric stretching of oxygen atoms. The bands at intermediate frequencies around 750-800 cm− 1 are attributable to the symmetric stretching of the oxygen atoms.
C asymmetric bond stretching vibration,25 which is the structural backbone of the hybrid material.25 The high-frequency band near 1020 cm− 1 is assignable to the antisymmetric stretching of oxygen atoms. The bands at intermediate frequencies around 750-800 cm− 1 are attributable to the symmetric stretching of the oxygen atoms.
■ The ![]() CH2 group incorporated into the silica group is indicated by the two weak absorption peaks at about 2930 cm− 1 and 2950 cm− 1, which can be assigned to symmetric and asymmetric stretching of the
CH2 group incorporated into the silica group is indicated by the two weak absorption peaks at about 2930 cm− 1 and 2950 cm− 1, which can be assigned to symmetric and asymmetric stretching of the ![]() CH2 bonds present on the silicon moiety.26 The presence of this hydrocarbon unit reveals a certain degree of planarization of the coating macromolecular chains. The intensities of the 1087 cm− 1 band and the 780 and 2950 cm− 1 shoulders increase in the Ce-doped sample (S2), demonstrating that the incorporation of cerium nitrate leads to improved condensation.
CH2 bonds present on the silicon moiety.26 The presence of this hydrocarbon unit reveals a certain degree of planarization of the coating macromolecular chains. The intensities of the 1087 cm− 1 band and the 780 and 2950 cm− 1 shoulders increase in the Ce-doped sample (S2), demonstrating that the incorporation of cerium nitrate leads to improved condensation.
■ The broad band centered near 3400 cm− 1 is assigned to residual Si![]() OH stretching vibrations and hydrogen-bonded water,27 which possibly formed during the hydrolysis of the alkoxy groups of GPTMS.
OH stretching vibrations and hydrogen-bonded water,27 which possibly formed during the hydrolysis of the alkoxy groups of GPTMS.
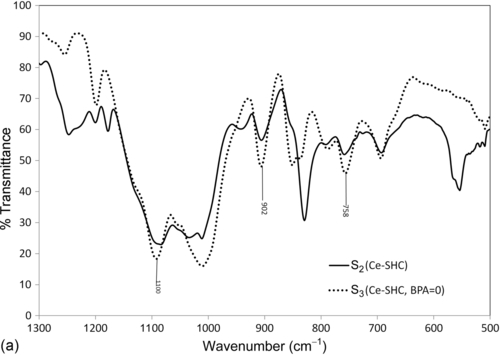
The effects of BPA, an aromatic diol, on the cross-linking of organosilica networks via the chemical coupling of the aromatic diol and epoxy-functionalities were also studied by FTIR spectroscopy. Cerium-doped silica hybrid coatings with and without BPA (Ce-SHC, BPA=0) (S2 and S3) were analyzed. The magnified spectral regions of interest are 500-1300 cm− 1 (Figure 5.2a) and 2800-4000 cm− 1 (Figure 5.2b). The bands due to asymmetric epoxide ring deformation at 758 and 902 cm− 1 in sample S3 are of similar intensity, which allows monitoring of the coupling reaction between the epoxy functionalities of the organosilica networks and the diol cross-linkers. These bands almost disappear in the FTIR spectra of sample S2, indicating the chemical bonding of organosilica networks in a cross-linked network.28 The bands due to Si![]() O
O![]() Si in sample S3 (centered at 1100 cm− 1) become more intense and broader relative to those in sample S2. This is attributable to the direct connection of epoxy silanes and propyl trimethoxy silane in sample S3, which resulted in the formation of a very brittle film.
Si in sample S3 (centered at 1100 cm− 1) become more intense and broader relative to those in sample S2. This is attributable to the direct connection of epoxy silanes and propyl trimethoxy silane in sample S3, which resulted in the formation of a very brittle film.

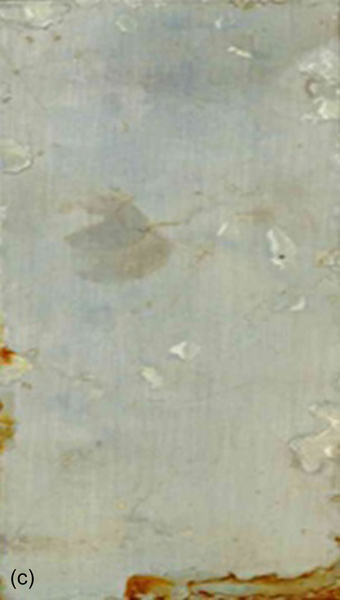
A standard corrosion resistance evaluation using salt spray was used to assess the three sol-gel film coatings. Photographs after 2000 h of salt spray exposure (Figure 5.3) illustrate that the SHC (S1) (average thickness 19.2 ± 6.5 μm) and the cerium-doped SHC (S2) (average thickness 57.7 ± 12.0 μm) did not show any signs of blistering, delamination, or corrosion. The samples retained their original shiny surfaces. However, the Ce-doped silica hybrid coating without BPA (S3) (average thickness 57.1 ± 4.0 μm) showed limited resistance to the salt spray; it exhibited blistering and delamination after exposure for 148 h. The first signs of corrosion appeared after exposure for 1600 h.


Potentiodynamic polarization measurements were carried out to estimate the effects of cerium and BPA on the corrosion resistance of the SHCs. Potentiodynamic polarization curves (Figure 5.4) were recorded after the bare and pretreated 304L SS substrates with the three coatings (S1-S3) were immersed for 3 h in a neutral 3.5% NaCl solution. Table 5.2 lists the electrochemical parameters derived from these curves.
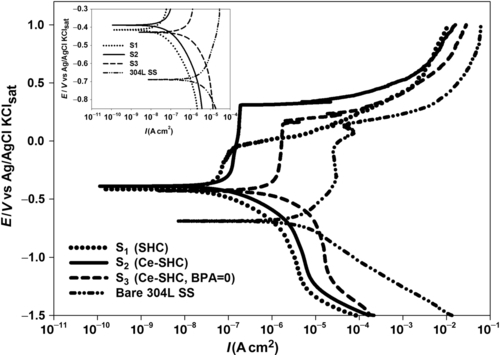
Table 5.2
Electrochemical Parameters Obtained from the Polarization Measured in a 3.5% NaCl Solution
| Sample | Ecorr (V) | Icorr (A cm− 2) | bc (V/dec) | ba (V/dec) | Passive Area (V) |
| Bare 304L SS | − 0.690 | 3.97 × 10− 6 | 0.331 | 0.243 | − 0.326 to − 0.086 |
| S1: SHC | − 0.414 | 2.30 × 10− 8 | 0.264 | 0.103 | − 0.269 to − 0.030 |
| S2: Ce-SHC | − 0.389 | 4.48 × 10− 8 | 0.297 | 0.100 | − 0.233 to 0.308 |
| S3: Ce-SHC(BPA=0) | − 0.427 | 5.10 × 10− 7 | 0.315 | 0.101 | − 0.312 to 0.181 |
With kind permission from Elsevier.32
The limiting current density for oxygen reduction and the anodic current density for all the coated specimens were lower than those for the uncoated 304L SS. This suggests that the corrosion protection was due to both the blockage of the surface with the reduction of oxygen and metal dissolution in the pores of the coating layers. Sample (S1) showed a decreased corrosion current density, Icorr, of around 2.30 × 10− 8 A cm− 2. Its corrosion potential (− 0.414 V) is more positive than that of the bare sample. Nevertheless, Figure 5.4 shows a very limited passive region of approximately − 0.269 to − 0.030 V over its corrosion potential.
The addition of cerium ions in coating S2 led to further reductions of corrosion current density and corrosion potential. A distinct passive region emerges that extends over a several hundred mV range of 0.233 to + 0.308 V over the Ecorr.
The poor performance of the S3 coating that lacked BPA may have been due to the permeability of the coating, which occurred due to cracks or porosity. This permeability allowed the aggressive electrolyte to reach the metal surface and initiate corrosion, indicating that the omission of a cross-linker can significantly affect the corrosion resistance of cerium-doped SHCs.
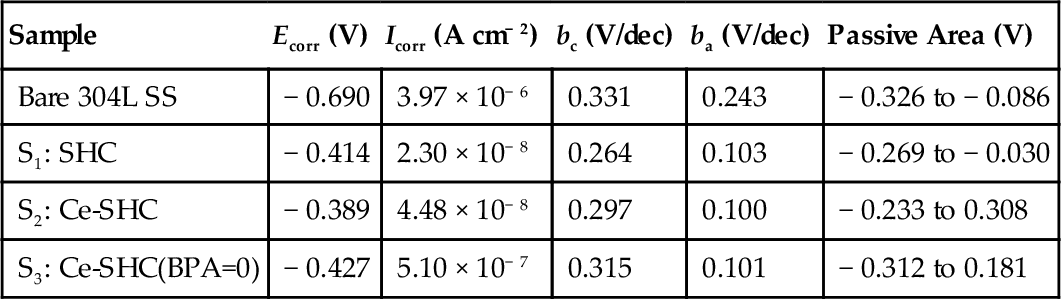
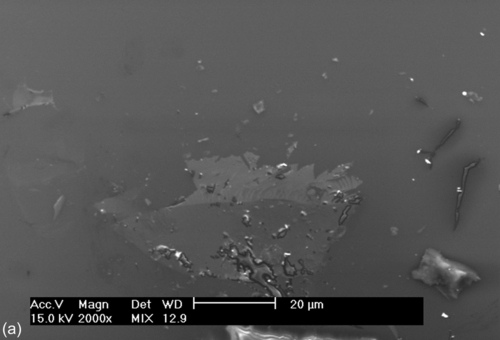
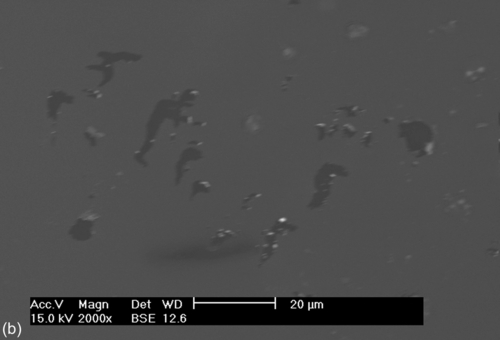
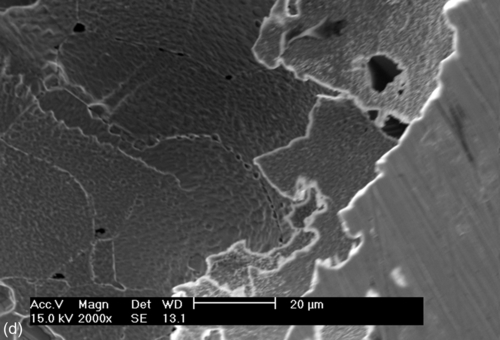
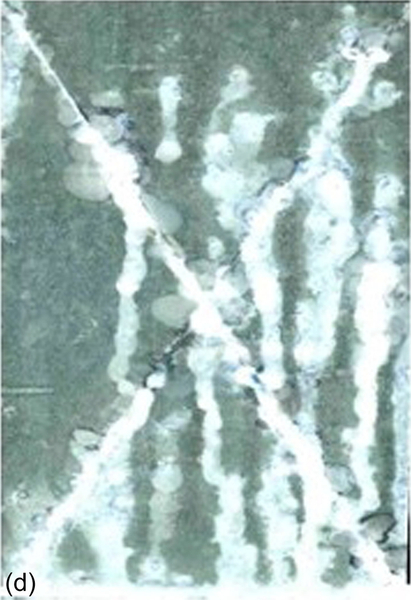
SEM images of the bare and coated 304L SS samples recorded after potentiodynamic polarization testing in a neutral 3.5% NaCl solution (Figure 5.5) each show localized corrosion. Exfoliation of the corrosion products, cracks (Figure 5.5a–c), and pits (Figure 5.5d) of different sizes are visible. The damage around some of the cracks and pits (Figure 5.5a–d) indicates preferential localized attack, which occurred after the applied potential exceeded the breakdown potential. This localized attack promoted the hybrid film to deteriorate and delaminate, possibly due to hydrolysis reactions at the interface. The diffusion of oxidant ions and the corrosion rate both increased, causing an accumulation of corrosion products at the interface, which promoted the formation of the defects and microcracks that are shown in Figure 5.5a–c. Samples S1 and S2 showed improved corrosion resistance, as suggested by the Ecorr and Icorr values (Table 5.2).
Impedance spectra were recorded for the bare and coated 304L SS substrates after immersion for 3 h in a 3.5% NaCl solution (Figure 5.6). The uncoated sample showed an EIS spectrum characterized by two time constants. The time constant at higher frequencies was assigned to the presence of an oxide/hydroxide film on the substrate and that at lower frequencies was due to corrosion activity. The total impedance of the substrate was below 5.86 × 10⁵ Ω cm2. Significant amounts of corrosion products were observed.


Samples S1 and S2 also showed two time constants: one at higher frequencies, attributed to the presence of the silane layer, and a lower frequency constant due to the charge transfer reaction associated with oxidation of the substrate. The Bode phase angle plot for sample S3 shows a different time constant at middling frequencies that can be attributed to cracking and corrosion activity at the surface of the substrate. This likely resulted from the absence of the cross-linker (BPA) causing brittleness in the film, which led to microcracks and delamination of the film.
Both the SHC (S1) and the cerium-doped SHC (S2) showed low-frequency system impedances that were about one order of magnitude greater than those shown by the bare sample and sample S3 (Figure 5.6b). This was probably due to the coating blocking the aggressive electrolyte from reaching the reactive metal surface. The lower impedance shown by sample S3 was due to the creation of defects and cracks in the coating, which allowed the diffusion of the aggressive electrolyte to the substrate.
EIS of samples S1 and S2 evaluated their barrier properties and inhibition mechanisms. Phase angle plots and bode modulus for samples S1 (Figure 5.7) and S2 (Figure 5.8) were recorded at intervals while the samples were immersed in a 3.5% NaCl solution for 22 days.


Impedance measurements of the noninhibited system (S1) display a slight evolution of the barrier properties associated with the hybrid coating. This behavior is related to water uptake, which occurred during the first days of immersion in the electrolyte. After 22 days, the noninhibited system displayed lower barrier effects.
The system containing cerium species (S2) offered better protection than the noninhibited (S1) system, and its barrier properties remained constant for longer. The inhibited system showed slower electrochemical evolution than the noninhibited one because the inhibiting effect of cerium ions slowed the corrosion kinetics.
The corrosion features of the samples were further explored through analysis of the EIS spectra analysis using equivalent electric circuits. To simulate the impedance plots, the constant phase element (CPE) was used instead of an “ideal” capacitor to explain the deviations from the − 1 slope in the Bode modulus plot. CPE can be described by Equation (5.1):

with − 1 < n < 18.
In this equation, n is a coefficient associated with system homogeneity (being 1 for an ideal capacitor), ω is the frequency, and Y0 is the pseudocapacitance of the system (expressed in Ω cm− 2 sn) that can be represented by:

In the Equation (5.2), ε0 is the permittivity of free space (expressed in F/m), ε the dielectric constant of the surface film, d the thickness of the coating (in μm), A the exposed area (in cm2), and r the roughness factor.8
The impedance response of sample S1 after immersion for 22 days suggests nonideal dielectric capacitive behavior, which includes the electrolyte resistance (Rs), polarization resistance (Rpo) of the corroded areas, and the nonideal capacitance of the coating (CPEc) (Figure 5.9a). The equivalent circuit shown in Figure 5.9b models sample S2 after similar immersion. It consists of similar elements: Rs, CPEc, and Rpo, related to porosity or defects to the passage of the electrolyte. The extra parameters included in the circuits (CPEdll and Rct) represent the presence of a double layer between the metal surface and the electrolyte, which led corrosion products to the pores. CPEdll is related to the nonideal capacitance of the double layer, and Rct is related to the charge transfer resistance of the metal. Table 5.3 lists the fitting parameters for the models presented in Figure 5.9a and b. The lower polarization resistance shown by the system containing sample S1 is associated with water uptake through the pores and/or defects in the coating. It is likely linked to an increase of exposed area.

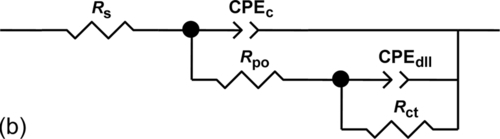
Table 5.3
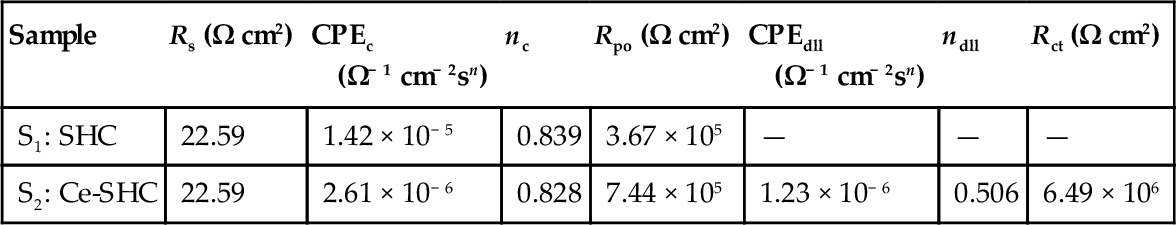
Parameters Obtained from Fitting Data for 304L SS with Silica Hybrid (S1) and Ce-Doped Silica Hybrid (S2) Coatings After Immersion for 22 Days in a 3.5% NaCl Solution
| Sample | Rs (Ω cm2) | CPEc (Ω− 1 cm− 2sn) | nc | Rpo (Ω cm2) | CPEdll (Ω− 1 cm− 2sn) | ndll | Rct (Ω cm2) |
| S1: SHC | 22.59 | 1.42 × 10− 5 | 0.839 | 3.67 × 10⁵ | — | — | — |
| S2: Ce-SHC | 22.59 | 2.61 × 10− 6 | 0.828 | 7.44 × 10⁵ | 1.23 × 10− 6 | 0.506 | 6.49 × 10⁶ |
With kind permission from Elsevier.32
The electrochemical parameters derived from the polarization curves, together with the EIS results, reveal the persistent protection offered by the cerium-doped SHCs. Increased immersion would likely lead to the release of cerium from the defects in the coatings. The cerium would then produce insoluble hydroxides when it reacts with hydroxyl groups from cathodic reactions.8,29 These hydroxides, together with the corrosion products, decrease the cathodic current and, therefore, reduce the overall corrosion rate.29
5.3.2 Electrochemical assessment of the self-healing properties of SHCs modified with cerium nitrate and cerium oxide nanoparticles on 304L stainless steel
Cerium-modified SHCs can supply self-healing abilities, which can automatically repair the corroded areas, thereby providing more durable corrosion protection. Self-healing is defined as the partial recovery of the protective properties of the coated system when damaged.5,30 It is evaluated by applying an artificial defect to a coated surface and monitoring the electrochemical behavior via EIS.5,30 The self-healing abilities of cerium-modified SHCs on 304L SS substrates were electrochemically investigated before and after defect application. The coated samples were immersed in the electrolyte for one week before a defect was created on their surfaces. Cerium nitrate and cerium oxide nanoparticles were used as cerium sources, and the surface morphology and electrochemical behaviors of the sol-gel coatings doped with cerium nitrate were compared with those of sol-gel coatings containing cerium oxide nanoparticles.
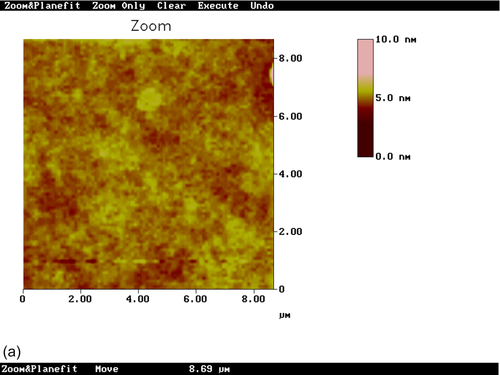
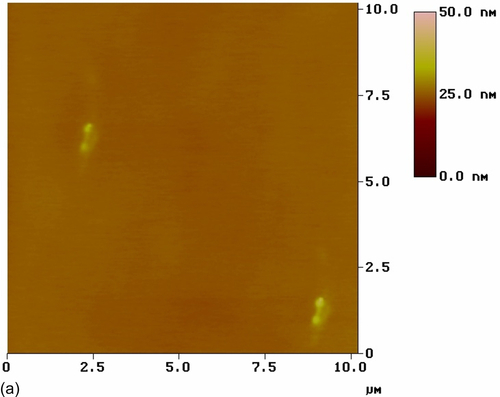
304L SS specimens pretreated with sol-gel coatings modified with Ce(NO3)3·6H2O (S4) and CeO2 nanoparticles (S5) were observed by AFM (Figure 5.10). Sample S4 showed a comparatively smooth nanostructure surface with a root mean square (RMS) surface roughness of 0.227 nm. The low color contrast in the top view image (Figure 5.10a) suggests limited heterogeneity of the coating thickness. No agglomerates were observed on the surface.


Sample S5 clearly showed nanosized particles incorporated into the film matrix with a relatively uniform distribution. The RMS roughness was 2.145 nm. The several larger particles observed in the hybrid matrix appear to be agglomerations of smaller particles. The sharper color contrast in the top view image (Figure 5.10c) suggests stronger height differences. The color contrast is uniformly distributed throughout the image, again suggesting some variation of the coating thickness.
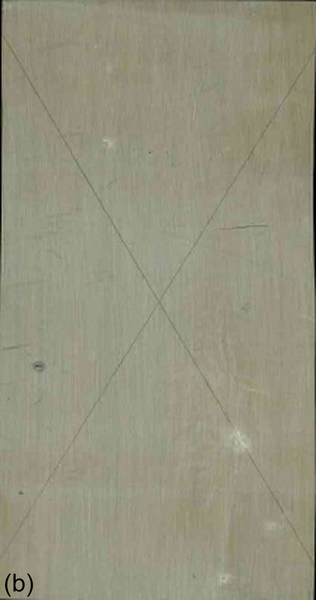
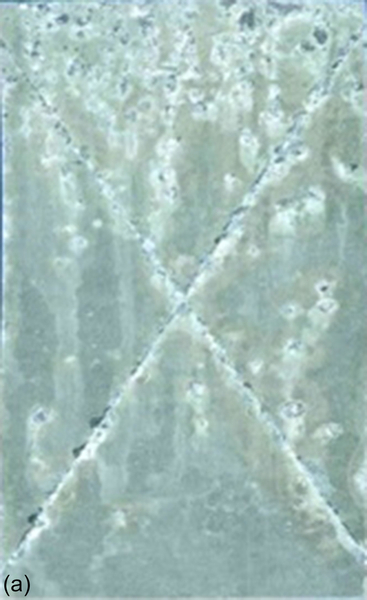
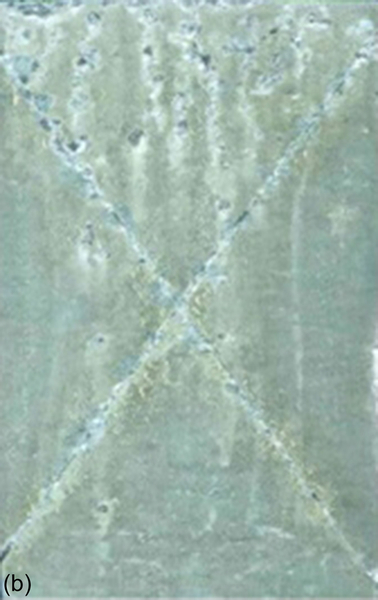
Photographs of the 304L SS pretreated with Ce(NO3)3·6H2O (S4) and CeO2 nanoparticle modified coatings after 2000 h of salt spray exposure (Figure 5.11) show that the coatings gave different levels of protection. Coating S4 (average thickness 60.6 ± 11.96 μm) (Figure 5.11a) did not blister or delaminate and retained its originally shiny surface, while coating S5 (average thickness 60.66 ± 13.51 μm) (Figure 5.11b) exhibited slight blistering around the scratched area (circles in the figure). Overall, good long-term corrosion protection appears to have been achieved by the silane sol-gel coating modified with Ce(NO3)3·6H2O (S4).

Impedance spectra for the coating S4, both with and without an applied defect, were recorded at intervals during immersion (Figure 5.12a). The impedance at low frequencies (LF) shown by the pristine sample was close to 1.95 × 10⁶ Ω cm2 during the first hours of immersion. After immersion for 3 days, it dropped slightly (1.6 × 10⁶ Ω cm2). This was associated with water uptake through pores and/or defects in the coating.8 Longer immersion (3-7 days) led impedance at LF to increase rapidly and remain high.

After immersion for 7 days, a defect was induced on the coating to create a corroding area. The impedance at LF markedly decreased 1 h after application of the defect (close to 1.19 × 10⁵ Ω cm2). This was an expected consequence of the damage. Further immersion for 1 day led the impedance at LF to increase further to 1.6 × 10⁶ Ω cm2. Yet longer immersion led the LF impedance to decrease slightly. This change is attributable to the self-healing effects of Ce(NO3)3·6H2O on the areas of corrosion.31 The self-healing originated from the release of cerium near the defect. The cerium then produced insoluble hydroxides by its reaction with hydroxyl groups from cathodic reactions.32 These hydroxides, together with the corrosion products, decreased the cathodic current and consequently reduced the overall corrosion rate.
The shape of the phase angle plot (Figure 5.12b) indicates two time constants before and after the application of the defect. The high-frequency process is attributable to the response of the silane film; the low-frequency time constant is due to the response at the interface of the film with the substrate.
The coating modified with CeO2 nanoparticles (S5) showed a different trend. The total impedance of the system was lower than that of the S4-modified sol-gel film. Impedance decreased rapidly with increased immersion, both before and for 5 days after the application of the defect (Figure 5.12c). Impedance increased 7 days after the application of the defect, suggesting that the coating was still providing some protection.
The EIS spectra show two time constants before the application of the defect and during early immersion (Figure 5.12d). Increased immersion led the low-frequency time constant to lose its prominence, while the high-frequency time constant remained well defined. After the application of the defect, the phase angle plot shows one time constant at high frequencies, which is ascribable to corrosion on the substrate, although no coating degradation was observed for the sol-gel coating containing CeO2 nanoparticles.
The EIS measurements were further analyzed by fitting the experimental plots to equivalent electrical circuits (EECs), while taking into consideration the number of time constants and the quality of the fits.33 The equivalent circuit for the system with coating S4 (Figure 5.13a) consists of: the electrolyte resistance, Rs; the nonideal capacitance of the coating, CPEc; the resistance to the passage of the electrolyte presented by pores or defects, Rpo; the nonideal capacitance of the double layer between the metal surface and the electrolyte, which soaks the corrosion products near the pores, CPEdll; the charge transfer resistance of the metal, Rct; and the Warburg finite impedance, W. The Warburg impedance and the CPE, with an n value around 0.5 (representing “infinite diffusion”), are used to model the increasing ionic conductivity that occurred owing to corrosion inside the pores.8

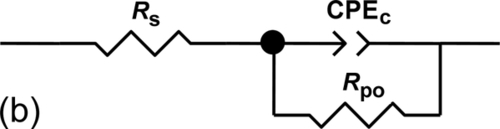
Impedance results for the S5 coating were fitted using two different equivalent circuits. Before the application of the defect, two time constants were required to simulate the EIS spectra (Figure 5.13a); only one was required after (Figure 5.13b).
Figures 5.14 and 5.15 depict the evolution of the parameters used in the numerical simulation of the experimental results. The system with the S4 coating showed a high-frequency resistance that decreased slightly during the first hours of immersion before the application of the defect (Figure 5.14), following the development of conductive pathways inside the silane film.5 The resistance remained nearly constant (around 1.32 × 10⁵ Ω cm2) during immersion for 7 days. The high-frequency CPE values were around 9.5 × 10− 7 F cm− 2 and decreased slightly with time. The low-frequency behavior was characterized by a resistance that increased from 8.404 × 10⁶ Ω cm2 during the first hours of immersion to 174 × 106 Ω cm2 after immersion for 7 days. Its CPE values were around 2.7 × 10− 6 F cm− 2 and remained nearly constant during the 7 days of immersion.

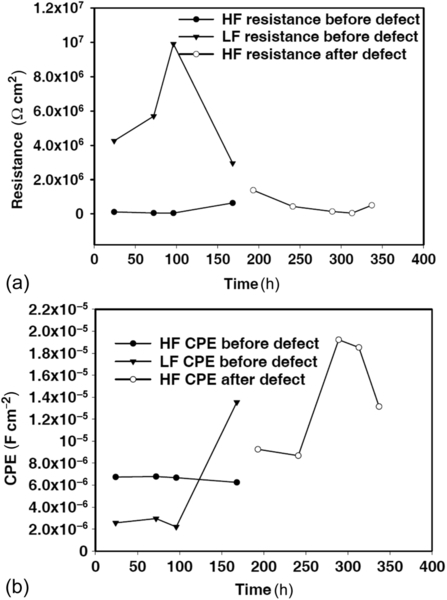
The high-frequency resistance increased 1 day after the application of the defect (1.47 × 10⁶ Ω cm2); it subsequently decreased slightly until the end of the experiment. The CPE values were around 4.7 × 10− 6 F cm− 2 and increased with time. Unlike the high-frequency resistance, the low-frequency resistance increased from 1.2 × 10⁶ Ω cm2 1 day after defect application to 11 × 106 Ω cm2 7 days after defect application. The CPE values decreased from 3.6 × 10− 6 F cm− 2 to 3.19 × 10− 6 F cm− 2. The evolution of the fitting parameters shows that the silane coating partially recovered its protective properties. Because the low-frequency behavior can be assigned to corrosion at the interface, it is possible to conclude that the corrosion was retarded.
The system with coating S5 showed slightly increased resistance after immersion for 7 days before the application of the defect (Figure 5.15). This can be ascribed to cerium oxide or hydroxide blocking the pores or defects.5,31 The CPE values were around 6.74 × 10− 6 F cm− 2 and remained nearly constant during the 7 days of immersion. At LF, resistance increased with time, indicating that cerium oxide/hydroxide formed with the release of CeO2 from the sol-gel matrix.5,30 After immersion for 7 days, the resistance decreased to 2.95 × 10⁶ Ω cm2, indicating pitting corrosion on the substrate. Correspondingly, the CPE values increased rapidly during immersion owing to the breakage of the oxide/hydroxide layer.5,30
After the application of the defect, the sample showed slightly decreasing resistance for the duration of the immersion test, indicating degradation of the coating. The CPE values dropped after 3 days of immersion to 8.68 × 10− 6 F cm− 2, reached a maximum, and then decreased again (13.15 × 10− 6 F cm− 2) owing to saturation of electrolyte in the sol-gel film.
The electrochemical tests showed that modification of the silane sol-gel coating with cerium ions (S4) resulted in a protective coating with barrier properties and/or corrosion inhibiting activity. The improved barrier properties were correlated with increases of reactive silanol groups [![]() Si(OH)3] and condensed species that could increase the viscosity of the silane solution and the coating thickness.4
Si(OH)3] and condensed species that could increase the viscosity of the silane solution and the coating thickness.4
Further assessment of the mechanisms associated with the electrochemical behavior of these systems was conducted through potentiodynamic polarization measurements. The curves obtained from the scratched samples after 1 h of immersion are depicted in Figure 5.16. Table 5.4 lists the electrochemical parameters obtained from these measurements.

Table 5.4
Summary of Electrochemical Parameters Obtained from the Polarization Measured in a 3.5% NaCl Solution
| Sample | Ecorr (V) | Icorr (A cm− 2) | bc (V/dec) | ba (V/dec) | Passive Area (V) |
| S4: Ce(NO3)3-SHC | − 0.408 | 1.36 × 10− 7 | 0.187 | 0.950 | − 0.340 to 0.013 |
| S5: CeO2-SHC | − 0.434 | 4.99 × 10− 7 | 0.230 | 0.116 | − 0.403 to 0.092 |
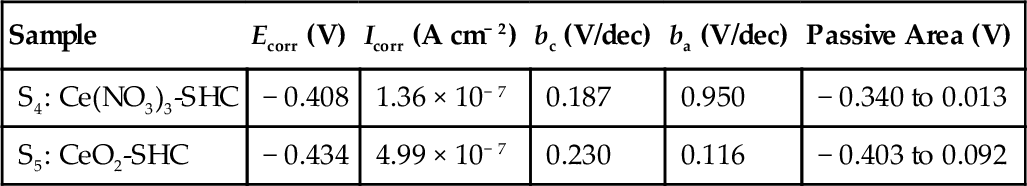
The Ce(NO3)3-doped sol-gel coating (S4) showed a lower corrosion current density, Icorr, (around 1.36 × 10− 7 A cm− 2) than the sol-gel coating containing CeO2 nanoparticles (S5), and its potential was shifted higher (− 0.408 V). This coated sample shows a passivation range of approximately − 0.340 to + 0.013 V over its corrosion potential. This behavior was improved by the barrier properties of the coating.32
Coating S5 presented a continuous potential range characterized by a control mechanism of equilibrium in the oxidation and reduction reactions. It also showed a wide passive plateau of − 0.403 to + 0.092 V above the corrosion potential.
The d.c. polarization results show that the presence of the cerium compounds favorably shifted the corrosion potential, decreased the anodic currents, and altered the kinetics of the anodic processes.32 These effects were much more marked for coating S4 than for coating S5.
5.3.3 Influence of cerium concentration on the microstructural features and corrosion protection of the cerium-doped SHCs on HDG substrates
The protective behavior of the cerium-doped SHCs depends also on the dopant concentration.7 Dopant concentration must be optimized because too high or too low concentrations negatively affect the barrier properties of the coating.1,7 Therefore, HDG substrates were tested with SHCs containing various molar ratios of cerium nitrate dopant [0.000 (S1), 0.001 (S6), 0.005 (S7), 0.010 (S8), 0.050 (S9), and 0.100 (S4)]. The lower corrosion resistance of the HDG in comparison to the 304L SS allows better assessment of the effects of the cerium concentration upon the anticorrosion performance of the silane coatings.
Microstructural observation of the nondoped (S1) and the 0.05 M cerium nitrate-modified (S9) SHCs before immersion in a 3.5% NaCl solution revealed smooth surfaces without any cracks or defects (Figure 5.17). However, the S1 coating showed several agglomerations (Figure 5.17a), which may be ascribed to the relatively high viscosity of the sol.l1 The heterogeneities in the coating might lead to regions more prone to corrosion.

After immersion for 72 h in a 3.5% NaCl solution, localized corrosion was observed for all coatings (except S9). Exfoliation of the corrosion products and cracks of different sizes were observed. These localized attacks could promote the deterioration and delamination of the films and were possibly due to hydrolysis reactions at the interface. Corrosion was enhanced by the diffusion of the oxidant ions, which caused corrosion products to accumulate at the interface and promoted the formation of defects and microcracks.
The S9 coating remained homogenous and crack-free after immersion for 120 h (not shown). Further immersion for a total 144 h led to the appearance of cracks. Comparison of the specimens after immersion for 144 h (Figure 5.18) suggests that the lowest and highest tested concentrations of cerium reduced corrosion inhibition in the sol-gel matrix and weakened the coatings.


Coating S1 (average thickness: 2.7 ± 0.2 μm), which lacked cerium nitrate dopant, showed limited resistance in the neutral salt spray test. Corrosion was visible to the naked eye after exposure for 120 h. Coatings S7 and S8 (average thickness: 5.5 ± 0.2 and 7.6 ± 0.2 μm, respectively) showed corrosion after 168 h, while coatings S6 and S4 (average thickness: 6.4 ± 0.2 and 11.5 ± 0.2 μm, respectively) showed corrosion after 240 h. The best performance in the salt spray test, with respect to general and localized corrosion, was shown by coating S9 (average coating thickness: 8.4 ± 0.2 μm), which contained 0.050 M cerium nitrate. Corrosion was detected after 336 h of exposure.
The coating that lacked cerium nitrate showed delamination, which increased rapidly during exposure to the salt spray. The coatings that incorporated cerium nitrate also showed increasing delamination during exposure, but with markedly reduced rates; for example, the coatings with 0.001 M (S6) and 0.050 M (S9) cerium nitrate showed comparatively little delamination after exposure to the neutral salt spray for 336 h. Images of the specimens after salt spray testing for 336 h are shown in Figure 5.19.


The different corrosion behaviors of the five samples containing cerium nitrate can be modeled using hybrid networks with limited capacities for inhibitor uptake. A low concentration of inhibiting cerium nitrate leads to improved barrier properties and, therefore, to improved uniform corrosion protection. Increased cerium nitrate content leads to increased porosity, which reduces the barrier properties of the coating and so lowers the protection against corrosion.11,25,34,35
Corrosion near the scratch behaved differently from the uniform corrosion elsewhere. Increasing the cerium concentration significantly reduced delamination. For instance, the coatings with 0.050 M (S9) and 0.1 M (S4) cerium nitrate showed less delamination near the scratch than those with lower cerium nitrate contents. The limited delamination in the presence of higher concentrations of cerium nitrate suggests the presence of a corrosion-inhibiting species.
Impedance spectra of the six HDG samples were recorded after 24 h of immersion in a 3.5% NaCl solution (Figure 5.20a). The impedance at LF initially increased with increasing cerium nitrate concentration from 0.000 to 0.050 M. However, above this critical concentration, impedance at LF reduced slightly.

The shape of the phase angle plot in Figure 5.20b indicates the presence of two time constants. The high-frequency time constant is attributable to the response of the silane film, and low-frequency time constant to the response of processes at the film-substrate interface.
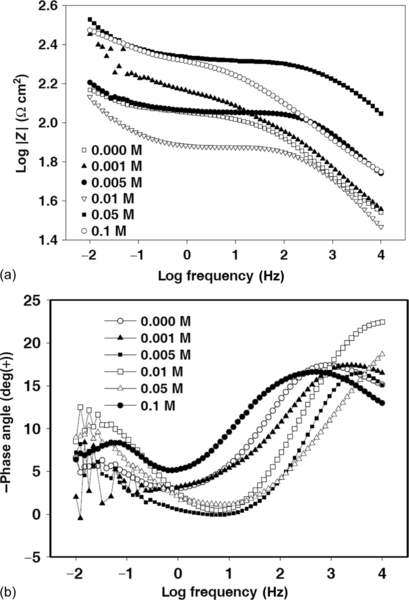
EIS Bode modulus (Figure 5.21a) and phase angle (Figure 5.21b) plots of the various coatings after immersion for 144 h in a 3.5% NaCl solution consistently show clear decreases of impedance at LF. This can be attributed to the hydrolytic degradation of the coatings. The impedance at LF of coatings doped with cerium nitrate (except coating S9) dropped to < 300 Ω cm2. However, the exception, doped with 0.05 M cerium nitrate, retained a higher impedance at LF of 337 Ω cm2. The dependence of corrosion resistance on the cerium concentration indicates the significance of controlling the cerium concentration for optimal protection.1,7
The EIS results can be interpreted by numerical fitting using the equivalent circuit depicted in Figure 5.22. In this equivalent circuit, Rs is the resistance of the electrolyte; CPEc and Rc represent the capacitance and resistance of the hybrid coating, respectively; CPEdll is the capacitance of the electrochemical double layer at the metal-electrolyte interface; and Rct is the charge transfer resistance of the metal.

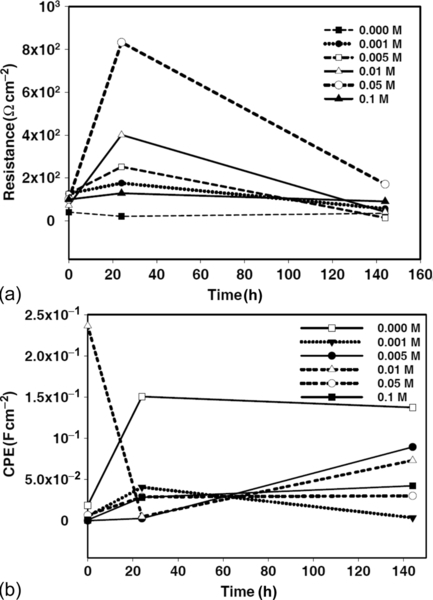
The evolution of the properties of the coatings during immersion was assessed by plotting their capacitance and resistance (Figure 5.23). The coatings doped with 0.005 and 0.050 M cerium nitrate had the lowest capacitance during the 144 h of immersion, demonstrating that they were of the greatest thickness (Figure 5.23a). During immersion, capacitance remained largely consistent, with only a small increase, associated with electrolyte uptake, visible after 24 h. Increased cerium nitrate doping significantly influenced the capacitance of the coatings, which was raised by about an order of magnitude in the coating with 0.100 M cerium nitrate. This increase was due to a decrease of the coating thickness and/or a higher porosity, either of which would increase conductivity.7 During immersion of the coating containing 0.100 M cerium nitrate, film capacitance significantly increased because of water uptake. This was due to the reduced barrier properties of the highly loaded film, which is in accordance with previous results of cerium-doped silane coatings on aluminum alloys (reported by Schem)11 and on galvanized steel (reported by Trabelsi).7

The evolution of the coating resistance (Figure 5.23b) is an important characteristic of the barrier properties of a protective layer.7,11 Upon initial immersion, the highest resistance was shown by the coating containing 0.050 M cerium nitrate. A small increase of coating resistance occurred during the first 24 h of immersion, probably due to swelling of the matrix and consequent closing of nano/micropores.11 Resistance subsequently decreased slowly during the remainder of the 144 h immersion test, reflecting the stability and good barrier properties of the coating. In contrast, the coatings containing the lowest concentrations of cerium nitrate (0.000-0.005 M) rapidly lost their barrier properties; resistance decreased throughout the immersion test. This fast decrease was related to the formation of new defects and pores in the coatings.11 The behaviors of resistance and capacitance suggest that there is an optimum level of cerium nitrate doping for the silane solutions.7
The concentration of cerium nitrate also affected parameters characteristic of the corrosion process; corrosion is associated with the development of a time constant in the low-frequency range of the EIS spectra. Over the first 24 h of immersion, charge transfer resistance, which is inversely proportional to the corrosion rate,7 increased as cerium content increased from 0.000 to 0.050 M (Figure 5.24a). Greater doping led to a significant reduction of charge transfer resistance. All coatings showed decreasing resistance during immersion for 144 h, although the highest resistances were shown by the coating doped with 0.050 M cerium nitrate. This behavior indicates the good resistance of the doped coating against the onset of corrosion.7
The double layer capacitance (Figure 5.24b) of all the coatings increased during the immersion test. The EIS results also show that the coatings doped with 0.000 and 0.001 M cerium nitrate corroded soonest, with the first signs of corrosion detected after 24 h. The others coatings showed corrosion after 96 h (except for that containing 0.05 M cerium nitrate). These results are in good agreement with the observations of coating resistance and indicate that there is an optimal level of cerium doping. The coating with the highest concentration of cerium nitrate showed lower barrier properties, and so allowed corrosion.7
Potentiodynamic polarization measurements were carried out to estimate the effects of cerium concentration on the corrosion resistance of the coatings (Figure 5.25). The corrosion current (Icorr) and corrosion potential (Ecorr) were determined by Tafel extrapolation1,24 and show the effects of the different doping levels (Table 5.5). There are two significant differences between the curves of the nondoped coating and that containing 0.050 M cerium nitrate: Ecorr shifted to a greatly less negative value and cathodic current density (A/cm2) markedly reduced. The difference in Ecorr directly reflects the degree of coverage of the coating over the entire substrate.36 Good coverage provides a continuous nanoporous coating layer, which causes Ecorr to shift to a more positive value. The reduction of cathodic current density is attributable to the inhibition of the cathodic reaction at the corrosion site, particularly the oxygen reduction reaction.36,37 Similar behavior has been reported by Zhong et al.1 for the magnesium alloy AZ91D in 3.5% NaCl solution after the addition of cerium nitrate. Their results suggest that Ce3 + ions react in a first stage with OH− ions, which are generated in the cathodic zones of the alloy, leading to the formation of localized areas rich in cerium. These are then involved in blocking the cathodic sites, which is reflected in the reduced corrosion rate. Hence, such a reaction, which leads to the corrosion of steel, appears to be retarded by a silica coating containing an inhibitor of 0.05 M cerium nitrate.

Table 5.5
Summary of Electrochemical Parameters Obtained from the Polarization Measured in a 3.5% NaCl Solution
| Sample | Ecorr (V) | Icorr (A cm− 2) | bc (V/dec) | ba (V/dec) | Passive Area (V) |
| S1: 0.000 M | − 0.974 | 3.57 × 10− 5 | 0.060 | 0.093 | − 0.792 to − 0.241 |
| S6: 0.001 M | − 1.025 | 3.48 × 10− 6 | 0.043 | 0.057 | − 0.815 to − 0.348 |
| S7: 0.005 M | − 0.972 | 1.18 × 10− 6 | 0.017 | 0.066 | − 0.829 to − 0.320 |
| S8: 0.01 M | − 0.963 | 6.01 × 10− 6 | 0.014 | 0.027 | − 0.838 to − 0.341 |
| S9: 0.05 M | − 0.957 | 1.74 × 10− 6 | 0.047 | 0.009 | − 0.864 to − 0.289 |
| S4: 0.1 M | − 0.976 | 1.02 × 10− 6 | 0.016 | 0.027 | − 0.840 to − 0.304 |

5.3.4 Evaluation of corrosion inhibition by silane coatings filled with cerium salt-activated nanoparticles on HDG substrates
The protective behavior of silane films loaded with activated CeO2 nanoparticles was next assessed. The nanoparticles were activated with cerium ions to improve the corrosion resistance and to reduce agglomeration of the nanoparticles due to stabilization of their surface charge.5
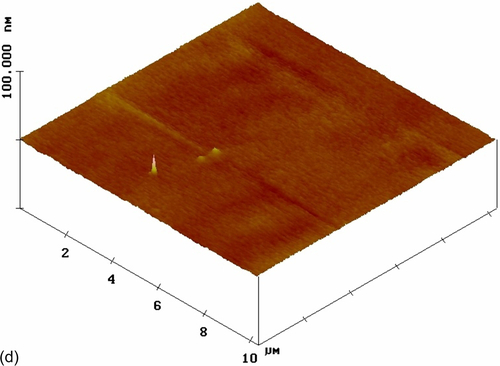
AFM images of HDG substrates with both nonmodified (S1) and cerium-modified silane coatings were recorded (Figure 5.26). The top-view image of coating S1 (Figure 5.26a) shows a comparatively smooth nanostructured surface with an RMS surface roughness of 0.608 nm. There is little color contrast in the image, suggesting low heterogeneity in the coating thickness and a good distribution of silica particles. However, the topographic image of this film (Figure 5.26b), which shows substrate features, reveals some large particles that likely resulted from the agglomeration of smaller particles on the surface.25,38 The effects of the cerium dopant and nanoparticles on surface morphology were assessed relative to these images. The silane coating modified with Ce(NO3)3, (S9) showed a smooth nanostructured surface with an RMS surface roughness of 0.402 nm (Figure 5.26c and d). The low color contrast in the top-view image suggests limited heterogeneity in the coating thickness; no agglomerates were observed on the surface.


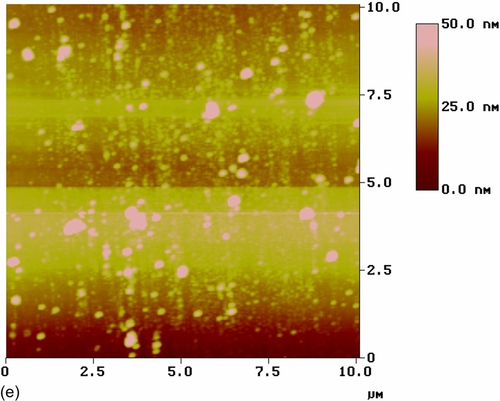
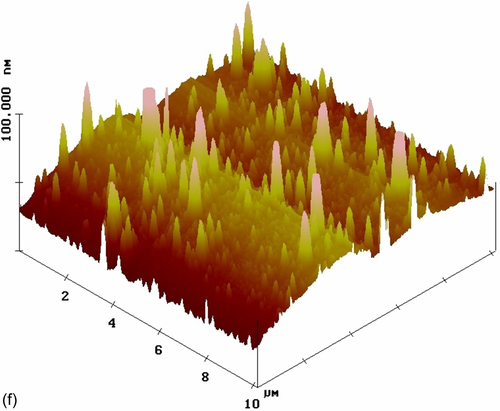

The top-view image of the coating modified with nonactivated CeO2 nanoparticles (S10) (Figure 5.26e) shows a number of CeO2 nanoparticles uniformly distributed in the silane coating, which had an RMS roughness of 8.421 nm. Some agglomerates were visible in the topographic image (Figure 5.26f). The sharper color contrast of the topographic image suggests larger height differences. The color contrast was uniformly distributed throughout the image, indicating heterogeneity of the coating thickness. Similar observations were reported by Phanasgaonkar et al.25
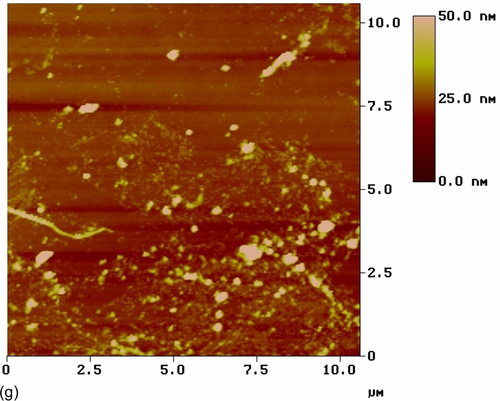
The top-view image of the silane film filled with activated CeO2 nanoparticles (S11) (Figure 5.26g) reveals a number of CeO2 nanoparticles uniformly distributed in the silane coating, which had an RMS roughness of 6.210 nm. Little color contrast is shown, indicating low heterogeneity of the coating thickness. The topographic image (Figure 5.26h) shows that the outer surface layers of this coating contained nanometer-scale particles and agglomerates. These results suggest that the addition of cerium ions altered the surface morphology of the coating modified with nonactivated CeO2 nanoparticles.
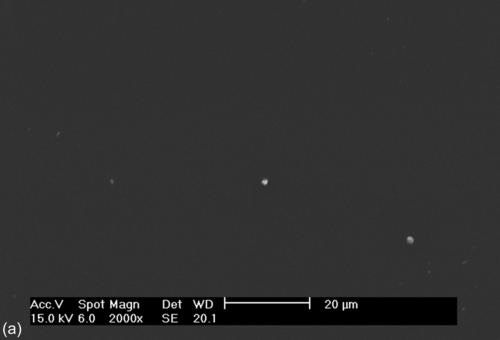
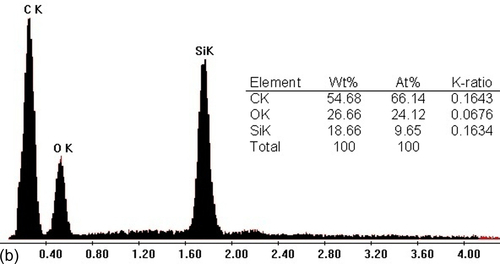
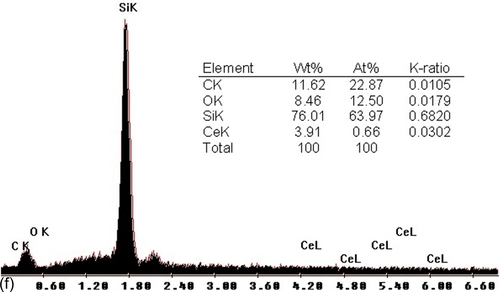
SEM revealed the effects of the CeO2 nanoparticles on the microstructure and qualitative chemical composition of the various silane coatings. Figure 5.27a shows the surface of the typical blank silane coating (S1) prior to immersion in a 3.5% NaCl solution. It appears uniform and defect- and crack-free. However, several white agglomerates appeared in the coating matrix, which were identified by EDX (energy dispersive X-ray analysis) as being Si-rich (Figure 5.27b). It is likely that these features were clusters of nanoparticles formed in the outermost layers of the silane film.1,39 The coatings doped with cerium nitrate (S9) (Figure 5.27c) and nonactivated cerium oxide nanoparticles (S10) (Figure 5.27d) contained particles of many different sizes. These particles were equally distributed in the coatings, and no microscale pores or cracks were observed. The silane film filled with CeO2 nanoparticles activated with cerium ions (S11) showed fewer and smaller silica agglomerations than the blank silane film (Figure 5.27e). EDX analysis of this region (Figure 5.27f) clearly showed the presence of cerium and silicon peaks, indicating that the addition of activated CeO2 nanoparticles led to the decomposition of the silane chains and a reduction in the size of the particles in the sols.1,25


The thicknesses of the silane films were also determined using SEM. The silane coatings modified with cerium nitrate (S9) and nonactivated cerium oxide (S10) nanoparticles showed thicknesses of ~ 2.16 and 4.97 μm, respectively. Thickness increased to ~ 6.77 μm for the coating filled with CeO2 nanoparticles activated with cerium ions (S11). All modified films were thicker than the blank silane film (S1) (~ 1.89 μm), suggesting that thicker or better cross-linked coatings formed in the presence of the activated ceria nanoparticles, as also observed by Montemor et al.18 and Garcia-Heras et al.34 This modification of the coating matrix could improve the resistance to oxidation of the substrate.25
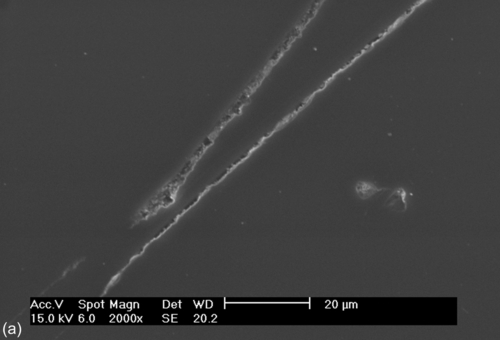
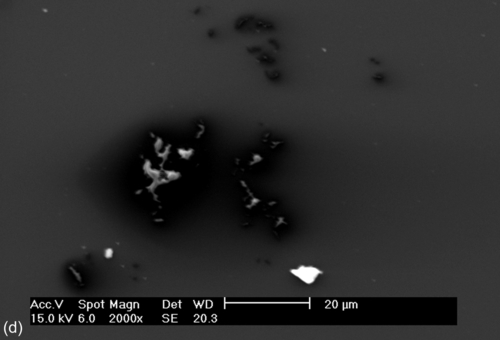
SEM images of the nonmodified and cerium-modified silane coatings obtained after EIS testing (Figure 5.28) indicate the ability of the sol-gel coatings to protect the HDG substrates. All the coatings showed localized corrosion after immersion for 144 h in a 3.5% NaCl solution: exfoliation of the corrosion products and cracks of different sizes were observed. These localized attacks promoted the deterioration and delamination of the hybrid film, possibly due to hydrolysis reactions at the interface. Additionally, the diffusion of the oxidant ions became faster, and the corrosion rate increased, causing an accumulation of corrosion products at the interface and at the same time promoting the formation of defects and micro-cracks.16 However, the SEM results showed that the barrier properties of the films containing the activated nanoparticles (S11) (Figure 5.28d) were improved, likely as a consequence of the increased film thickness. The presence of the cerium ions also promoted the formation of reactive silanol groups in the silane molecules, leading to a higher degree of cross-linking, higher silicon content, and, therefore, more homogeneous films with better barrier properties, as has been confirmed by Montemor et al.18


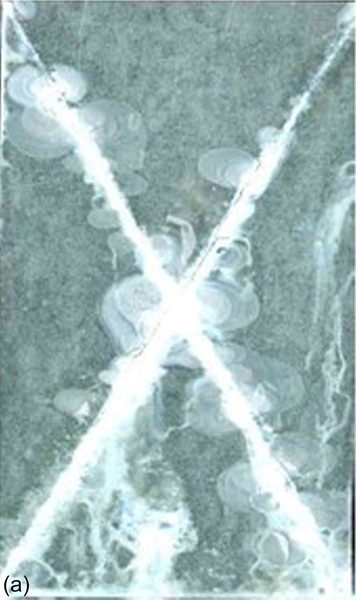
To detect possible differences among the differently modified silane films, 144 h salt spray tests were performed (Figure 5.29). At the initial stages of exposure, all coatings showed the sacrificial dissolution of zinc in the artificially scratched area. The breakdown of the coating layers progressed with time; eventually the zinc coatings degraded, resulting in the formation of white rust.40
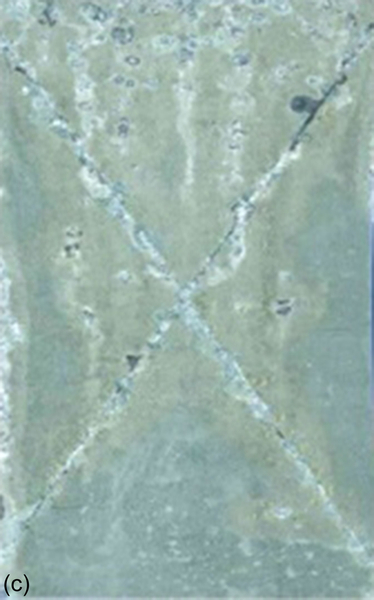
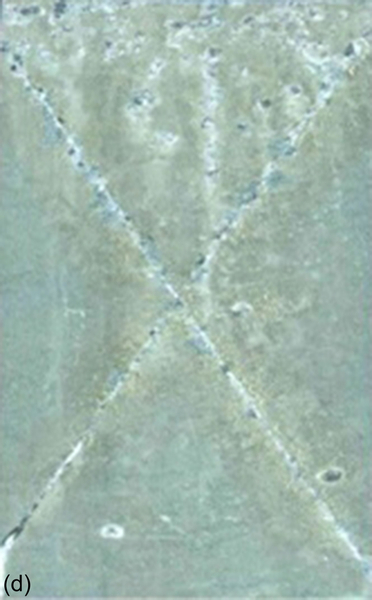
For the blank silane-coated substrate (S1), delamination increased rapidly during salt spray exposure. The modified silane coatings still showed increased delamination during exposure, but at markedly reduced rates. For example, the silane coating filled with activated CeO2 nanoparticles (S11) suffered comparatively little delamination after exposure for 144 h, indicating its stability and barrier properties.
EIS spectra of the coated galvanized steel substrates show that the nonmodified-silane-coated sample (S1) (Figure 5.30a) exhibited lower impedance than that with the Ce(NO3)3-modified coating (S9) (Figure 5.30c). Furthermore, in the presence of cerium nitrate, total impedance remained approximately constant for the duration of the 144 h test in a 3.5% NaCl solution. This was due to both the better barrier properties and the corrosion inhibition abilities.32

EIS Bode plots obtained for the silane coatings filled with CeO2 nanoparticles (S10 and S11) (Figure 5.30e and g) show that total impedance was lower for the system containing nanoactivated CeO2. The addition of cerium ions led to a significant increase in impedance. For example, after immersion for 24 h, the total impedance of the system containing activated CeO2 was more than two orders of magnitude higher than that of the system filled with nonactivated CeO2. This finding has also been noted previously5,15 and was attributed to the likelihood of nanoparticles agglomerating and creating large defects in the coating, which promotes the uptake of the aggressive solution, and therefore promotes corrosion. The activation of the nanoparticles with cerium ions enhanced the protective properties of the modified silane films by increasing the thickness of the film and/or reducing its porosity.18
The shape of the phase angle plot indicated the presence of two time constants (Figure 5.30b, d, f, and h): one attributable to a high-frequency response of the silane film and one to a low-frequency response of the processes occurring at the silane film-substrate interface.
A more detailed interpretation of the EIS results can be made by numerical fitting using the equivalent circuit depicted in Figure 5.22.
Figure 5.31 shows the evolution of the resistance and capacitance of the coatings during immersion in a 3.5% NaCl solution. The high-frequency resistance values (Figure 5.31a) generally decreased during the first hours of immersion owing to the development of conductive pathways inside the blank silane film (S1).30 During early immersion, the highest resistance was shown by the coating modified with Ce(NO3)3 (S9), whose resistance then dropped sharply after a few hours. The high-frequency resistance of the coating with nonactivated CeO2 nanoparticles (S10) reached a maximum and then started to decrease. The initial increase of the high-frequency resistance in the last two systems (S9 and S10) was attributed to swelling of the matrix and the consequent closing of nano/micropores.11

The high-frequency resistance of the system filled with activated CeO2 nanoparticles (S11) increased more gradually. The initial EIS response was nearly capacitive over the entire frequency range, and the resistance remained above 233 Ω cm2. Its continued slow increase over the 144 h test led to a significant overall increase. Compared with the blank silane film, the modified silane films showed significantly improved barrier properties.
The evolution of capacitance during the immersion test is shown in Figure 5.31b. Coating S11 showed the lowest capacitance of the four considered systems, and it was the thickest of the coatings. Its capacitance remained relatively consistent during the immersion, with only a small increase after 96 h, which was associated with the uptake of electrolyte.5,11 In contrast, the blank silane film showed significantly increased film capacitance after 96 h of immersion. This was due to water uptake, which was facilitated by the reduced barrier properties of the film.5
The evolution of the high-frequency fitting parameters indicated that the addition of nanoparticles reinforced the barrier properties of the film. The addition of cerium to the nanoparticles markedly influenced the capacitance and resistance of the coatings, and the systems filled with cerium-activated CeO2 nanoparticles showed the best protection. These results are in accordance with those of Schem et al. regarding aluminum alloys with silane coatings filled with CeO2 nanoparticles11 and those of Montemor et al. regarding galvanized steel with silane coatings doped with Ce salt-activated nanoparticles.5
The evolution of the fitting parameters associated with the low-frequency behavior of the EIS spectra (Figure 5.32) gives information on the electrochemical activity at the silane-zinc interface. For the system pretreated with the silane coating (S1), the initial CPE values (Figure 5.32a) were of the order of 0.0187 F cm− 2. During 96 h of immersion, CPE values increased and then stabilized at ~ 0.1402 F cm− 2. This agreed with the evolution of the low-frequency resistance (Figure 5.32b) of the blank silane film, which gradually decreased during this period, from 39.81 to 20.24 Ω cm2, before stabilizing at ~ 34.42 Ω cm2.
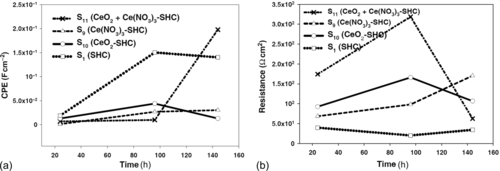
The systems modified with CeO2 behaved distinctly. In the absence of cerium ions (S10), after 96 h, the CeO2-filled system showed CPE values of ~ 0.0438 F cm− 2; its resistance increased from 92.54 Ω cm2 during the first hour of immersion to ~ 166.20 Ω cm2. After 144 h, CPE and resistance had increased slightly to 0.0129 F cm− 2 and 106.60 Ω cm2, respectively. The activation with cerium ions had significant effects on both the low-frequency CPE and the resistance. During immersion for 96 h, the CPE values of sample S11 were below 9.7601 × 10− 3 F cm− 2, and the resistances increased to over 318.80 Ω cm2. Resistance gradually decreased during the immersion test. Resistance and CPE eventually approached the values shown by the silane coating modified with Ce(NO3)3 (S9). The low-frequency resistance increased during immersion, indicating that cerium oxide/hydroxide was stably formed with the release of Ce(NO3)3 from the sol-gel matrix.31 The low-frequency resistance reached close to 170.62 Ω cm2 after 144 h, indicating the continuous accumulation of cerium oxide/hydroxide during immersion. In addition, the CPE increased gradually to ~ 0.0301 F cm− 2 after 144 h, four orders of magnitude lower than the value measured for the blank silane coating, suggesting that the inhibition products had filled the originally electrolyte-saturated pores at the coating-substrate interface.31
In some cases, the low-frequency resistance increased after a few hours, accompanied by a decrease in CPE. Because corrosion was localized, the precipitation of the insoluble and passive corrosion products likely occurred at these locations, decreasing the corrosion activity at the interface.5 In fact, the most pronounced changes were observed for the blank silane film, which presented the poorest barrier properties and was therefore the most prone to early corrosion attack, as was observed by Montemor et al.5
Polarization curves were recorded after 1 h of immersion in the electrolyte (Figure 5.33). Parameters (Icorr and Ecorr) derived from the curves (Table 5.6) indicate the different effects of the cerium modification on the silane coatings. The shifting of the cathodic polarization curves to lower current densities indicates the enhanced protection at the cathodic sites offered by coating S11. The corrosion potential of sample S11 (− 0.934 V) is indicative of its notably greater corrosion resistance when compared with samples S1 (− 0.974 V), S9 (− 0.959 V), and S10 (− 0.987 V).
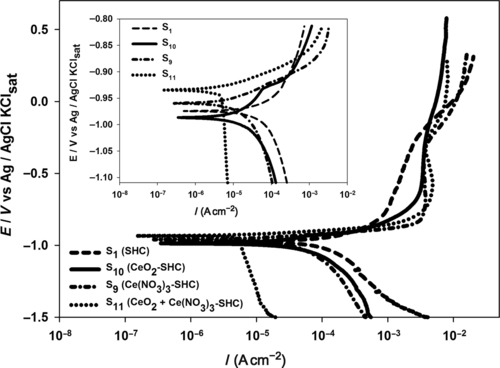
Table 5.6
Summary of Electrochemical Parameters Obtained from the Polarization Measured in a 3.5% NaCl Solution
| Sample | Ecorr (V) | Icorr (A cm− 2) | bc (V/dec) | ba (V/dec) | Passive Area (V) |
| S1: SHC | − 0.974 | 3.57 × 10− 5 | 0.060 | 0.093 | − 0.792 to − 0.241 |
| S9: Ce(NO3)3-SHC | − 0.959 | 3.22 × 10− 6 | 0.022 | 0.022 | − 0.832 to − 0.320 |
| S10: CeO2-SHC | − 0.987 | 4.90 × 10− 6 | 0.031 | 0.026 | − 0.677 to − 0.262 |
| S11: CeO2+ Ce(NO3)3-SHC | − 0.934 | 1.11 × 10− 6 | 0.015 | 0.012 | − 0.809 to − 0.327 |
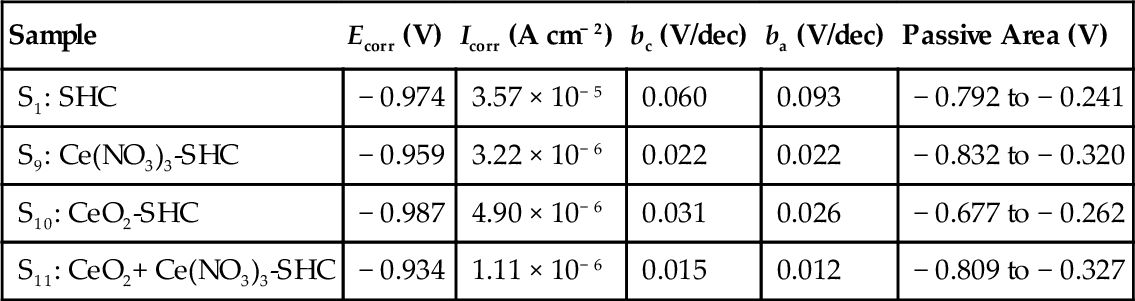
The poor performance displayed by coatings S1 and S10 may have been attributable to permeability associated with cracks or porosity, which allowed the aggressive electrolyte to come into contact with the metal surface, thus initiating corrosion.30 These results are consistent with the SEM micrographs, which show cracks and delamination in these coatings after immersion for 144 h in 3.5% NaCl solution (Figure 5.28). Similar behavior has been reported by Montemor et al.5 for galvanized steel substrates in 0.005 M NaCl solution.
5.4 Conclusion and Outlook
Cerium-doped SHCs employing GPTMS and BPA, as a cross-linking agent, were synthesized via a sol-gel method and fabricated on treated steel surfaces (either austenitic 304L stainless steel or HDG). The use of these substrates allowed investigation of the effects of various parameters that influence the microstructure, morphology, and protective properties of the coatings. These parameters include the concentrations of cerium ions and additives such as BPA, cerium nitrate, and CeO2 nanoparticles.
FTIR spectroscopy and SEM confirmed the formation of crack-free cerium-doped SHCs with Si![]() O
O![]() Si structural backbones and
Si structural backbones and ![]() CH2 groups incorporated into silica network. The resulting films were transparent and homogenous. The lack of cross-linking agent (BPA) in the linear cross-linked cerium-doped SHC caused it to show cracks, be very brittle, and withstand corrosion poorly.
CH2 groups incorporated into silica network. The resulting films were transparent and homogenous. The lack of cross-linking agent (BPA) in the linear cross-linked cerium-doped SHC caused it to show cracks, be very brittle, and withstand corrosion poorly.
Comparatively smooth nanostructured surfaces with low heterogeneity of coating thickness were observed in the silane coatings modified with cerium nitrate rather than CeO2 nanoparticles. The use of CeO2 nanoparticles led to high heterogeneity of coating thickness.
Corrosion testing indicated that the CeO2 nanoparticles gave good corrosion inhibition properties to scratched surfaces because of their ability to complex with other species, therefore contributing to the stabilization of the passive film via an anodic inhibition mechanism. Modification of the silane solution with cerium nitrate led to improvements in the barrier properties, corrosion inhibition, and the self-repair of defects. The cerium ions can change the silane solution chemistry, promoting the formation of reactive silanol groups and more condensed species.
Electrochemical studies indicated general improvements due to the incorporation of cerium nitrate, although the performance of the coated substrate depended on the doping level. Too low or too high cerium concentrations led to reduced corrosion inhibition in the sol-gel matrix. EIS and polarization results confirmed that the optimal corrosion resistance was obtained at a cerium concentration of 0.05 M.
Modifying the silane coatings with cerium salt-activated CeO2 nanoparticles led to improved barrier properties and corrosion resistance and decreased coating capacitance. The incorporation of activated CeO2 nanoparticles reduced the cathodic current density by two orders of magnitude and shifted the voltage to more positive values (compared with the blank silane-coated substrate) during polarization in 3.5% NaCl solution.