3
Process Discovery and Process Mining
A key step in any intelligent automation project is to understand the business problem. In this chapter, we’ll understand this by establishing a shared knowledge of how the business works and operates today. These details are often known to just a few subject matter experts, or they might be hidden behind an existing system or implementation.
The next key step is to analyze the process for improvement opportunities. Where do bottlenecks exist? Which activities are good candidates for automation?
Finally, before embarking on automation, it’s important to do early validation of your plans, to determine if there will be sufficient gains from automation and a reasonable return on investment (ROI).
We will demonstrate how this can be done using two products within IBM Cloud Pak for Business Automation – IBM Blueworks Live for business process discovery and documentation, and IBM Process Mining for discovery and analysis of hidden processes.
In this chapter, we will cover the following topics:
- Establishing a language for business and automation developers
- Documenting your business processes
- Discovering hidden processes
- Identifying automation opportunities
- Early validation of potential improvements
Technical requirements
You can sign up for free trial access to the products referenced in this chapter. While this isn’t required to understand the concepts and techniques described, it’s highly recommended:
- To sign up for IBM Blueworks Live trial access, go to https://www.blueworkslive.com
- To sign up for IBM Process Mining trial access, go to https://www.ibm.com/cloud/cloud-pak-for-business-automation/process-mining
Establishing a language for business and automation developers
Communication is critical to any successful project, particularly one that requires participation from both business users and automation developers. As such, it’s important to establish a shared language that can be consumed by both.
The Business Process Model and Notation (BPMN) is a standard published by the Object Management Group (OMG) and is intended to facilitate such communication between the human beings involved in these projects and also between process automation tools used to document, automate, or analyze the processes. In this section, we’ll introduce the standard and examine some of its key characteristics and elements.
An introduction to BPMN
BPMN provides a graphical notation for describing business processes. It is designed to be intuitive and unintimidating to a business user, while also being descriptive and precise enough to serve as the basis for an automated solution. It is well suited for iterative discovery and progression of detail.
Version 1.0 of the BPMN standard was published and formally adopted by the OMG in March 2007. Version 2.0 was an important evolutionary step forward for the standard. It incorporated key industry feedback, formalized the semantics that underly the notation, and introduced an interchange format that allowed for sharing and exchange between tools designed for the business and tools designed for automation. Version 2.0 was adopted by the OMG in January 2014 and it cemented the role of BPMN in the automation industry and process modeling overall.
Core elements of BPMN 2.0
BPMN leverages a flowchart-like graphical notation, but each element within the notation has well-defined semantics and rules. This is important because it takes the diagram beyond just a simple flowchart and turns it into a specification of what the process does. But because it uses flowchart-like constructs, it remains familiar and intuitive to business users.
The following are the primary shapes within the notation:
- Circles denote events within the process, including the start and end of the process, along with key events that occur within the process
- Rounded rectangles capture the tasks or activities within the process, denoting where work is done.
- Diamonds represent gateway or branching points in the process where alternative paths might be taken, or where parallel work might be triggered
- Swimlanes capture the roles involved in the business process and allow you to easily see who performs which job
The following diagram shows the basic elements of a BPMN process:

Figure 3.1 – Basic elements of a BPMN process
Each shape supports refinement via annotations that add more precision, allowing you to iteratively and progressively inject specifics of what happens at that point in the process.
The following table shows the primary shapes and their most commonly used variations. A comprehensive list of the BPMN elements that are available within the IBM Blueworks Live product can be found at https://www.blueworkslive.com/scr/docs/bwl/topics/process_diagram.html:
|
Shape |
Name and Description |
Variations | |
|
|
Event Key events within the process, including what starts it, what happens when it ends, and what happens within the process itself |
| |

|
Activity A step in the process where work is performed |

|

|

|

| ||

|

| ||
|
|
Gateway A point in the process where branching occurs, resulting either in alternative paths or parallel paths |

| |
Table 1.1 – Common BPMN shapes
We’ll be leveraging these shapes in the upcoming sections.
Documenting your business processes
Now that you have a shared language, it’s time to move on to documenting your existing business processes. Often, these business processes are performed by human beings, either in full or in part. This information is rarely known to any one person, so you should expect this phase to be highly iterative and highly collaborative, requiring input from multiple subject matter experts.
We will leverage the IBM Blueworks Live product for this phase. Blueworks Live provides a collaborative environment in the cloud for discovering and documenting your business processes. Let’s look at some techniques and best practices for how you can effectively apply Blueworks Live to engage your subject matter experts on business process documentation.
Process discovery workshops
In a process discovery workshop, a business analyst will facilitate meetings to document the business process by extracting information from the people that know the process. This can be done face-to-face, or you can leverage the “in the cloud” nature of Blueworks Live to do this entirely remotely.
The following are some workshop recommendations:
- Keep the number of attendees to 10 or less. Smaller groups are more focused and efficient.
- Source buy-in from process owners and executive sponsors before kicking off the workshop.
- Clearly define the scope and goals of the workshop. This will help establish who should be included and how success will be measured. Further guidelines assume your goal is to document an existing process.
- Include the people who perform the process today, rather than people who simply believe they know the process. This is your opportunity to capture the undocumented details and workarounds that are often only known to a few individuals. And if possible, observe these individuals as they perform the process. There are likely details they might not think to mention.
- Focus on how the process is performed rather than on how it should be performed. There’s often a significant difference between the two. Start small and simple. A high-level process map is often best as a first step. Then, iterate, elaborate, and refine.
Now, let’s explore how to leverage IBM Blueworks Live to document a fictitious client onboarding process. This process involves two participants: a Client Rep who interfaces with the client and collects their data and an Account Manager who reviews and classifies the request before the client is onboarded.
Defining a high-level process map
When you create a process model using IBM Blueworks Live, you will initially be in a process map view. Here, you can start to break the business process down into smaller, more manageable pieces.
First, identify and define the key milestones of your process, along with the sequence in which they occur. Then, within each milestone, add the major activities that occur.
The following screenshot shows a Client Onboarding process map with three milestones – Data Collection, Validation, and Onboarding:

Figure 3.2 – Client Onboarding process map
At this point in your workshop, focus on capturing the happy path and the primary activities within the process. Your goal during this phase is not precision or detail, but rather establishing a baseline and coarse-grained view for conversation and further refinement.
When you believe you have a process map that is a good, high-level representation of the process, create a snapshot of the process map in Blueworks Live. You’ve completed an important stage in your process discovery workshop, and a snapshot will allow you to refer to this version of the map at any point.
Working with a process diagram
When you are ready to drill down and add detail, switch to the Process Diagram view. Blueworks Live will generate a BPMN process diagram from your process map. You can now add additional process flow details and semantics.
Identify who is involved in performing the process steps. These are not the individuals, but rather roles, departments, or logical groups of people. Add a swimlane for each group, and move each activity into an appropriate swimlane. Once done, you will have a view of work distribution. You can also see where handoff across roles might occur. Handoffs are often points of inefficiency, so you will want to see if that happens frequently.
You should also refine the sequence of activities within your process and inject exceptional paths. Some common considerations are as follows:
- How does your process start? Is it initiated manually? Or does it start based on a time-based condition or receipt of a message? You can right-click on the start event and set its type to convey how the process starts.
- Are there steps in the process that only occur a subset of the time, based on some condition? If so, add an exclusive gateway to capture the condition and show which activities occur under which conditions.
- Are there steps that occur in parallel? If so, use a parallel gateway to show where parallel work starts and ends.
- Are there escalation points within your process? For example, if a particular step is not completed within a certain period, is there additional work that must be done? If so, attach a timer boundary event to the activity to model the condition and to show the additional steps that occur if the period is exceeded.
The following screenshot shows a version of the Client Onboarding process diagram that has incorporated some of these considerations:

Figure 3.3 – Client Onboarding process diagram
Continue refining your process diagram with the help of your workshop team until the team believes it is a good reflection of the sequence of work done. Your next step is to drill down below the diagram into the business data and properties of the process.
Adding textual descriptions
You can use textual descriptions to provide details about lower-level procedures, policies, and purposes.
The following are the key places where textual descriptions are highly recommended within the process model:
- The process
- The milestones
- The activities
You can also provide additional reference material, in the form of file attachments or links to external sites.
Adding business data
Be sure to capture the key business characteristics of your process.
IBM Blueworks Live provides a rich set of business properties ready for use, and you can configure additional properties as needed. Every organization will have different properties that they are interested in documenting, but some are universally recommended.
Systems
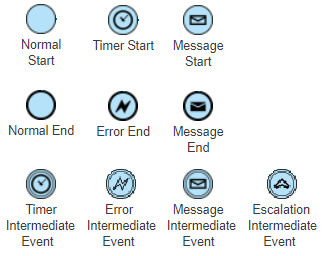
For each activity in the process, document the systems used to assist with the work. This is particularly useful information when you’re trying to identify automation opportunities. Each point where a human being interacts with an automated system can potentially be optimized using automation.
To document the systems used, right-click the activity, open the Details dialog, and fill in the Systems fields. If a particular step involves interacting with multiple systems, enter everything in this dialog:
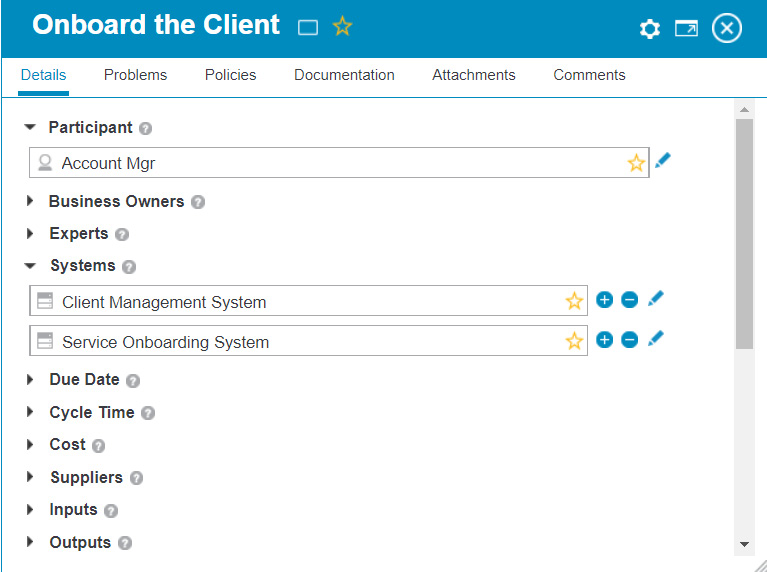
Figure 3.4 – Filling in the Systems fields
Once captured, you can use the Analyze feature in Blueworks Live to get a comprehensive view of which systems are used across your process, and where each is used. Simply click the Analyze button in the toolbar to go into Analysis mode. Once there, select the System property using the view on the left. You can select additional properties, but it’s best to focus on a few properties at a time.
As shown in the following screenshot, this view identified three activities in the process where employees send an email. Sending emails could be automated, and we’ve now quickly and easily identified some candidate steps for automation:

Figure 3.5 – The user onboarding process in Analysis mode, showing which systems are used across the process and where each is used
Cost and time
Document the cost and time associated with each step in your process. This will help you identify where you incur the most cost or spend the most person-hours. If you have a limited automation budget, this data will allow you to prioritize where you apply that budget so that you can maximize your investment.
As with the Systems properties, you specify these in the Details dialog. Right-click on the activity, select Details, and locate the appropriate fields in the dialog:

Figure 3.6 – Specifying cost and time
Blueworks Live provides two properties that capture time data:
- Work time: This is a person’s time spent on this activity
- Wait time: This is the time spent waiting, including waiting for information and waiting for another process participant
Both contribute to the overall time it takes to complete this activity and both can be optimized. But if this activity were automated, the work time is likely where you will see an improvement. Hence, it’s best to keep to this division.
Running a Process Playback
Blueworks Live Process Playback is a highly effective tool for collaboratively walking through a process. Within it, you define one or more playback paths, with each path consisting of a sequence of activities. A typical process would consist of many paths, particularly if that process has conditional branches in the form of exclusive gateways.
You can leverage playback paths to break a potentially large and complex process down into smaller consumable scenarios that are easier to talk through.
To use Blueworks Live Process Playback, open your process and click the Playback button in the toolbar. This will take you into Playback mode. Next, define some playback paths. Assign a meaningful name to each path, give it a description (optional), and then select the activities that you wish to include in that path:

Figure 3.7 – The Client Onboarding process in Playback mode
If you’ve captured cost and time information for the activities in your path, you can visualize those values while doing your playback and observe how cost and time change and accumulate throughout your business scenario. Simply expand the Analysis dropdown in the toolbar and check the cost and time properties. Then, click the Play button to start the playback, and observe the playback widget at the bottom of the screen:
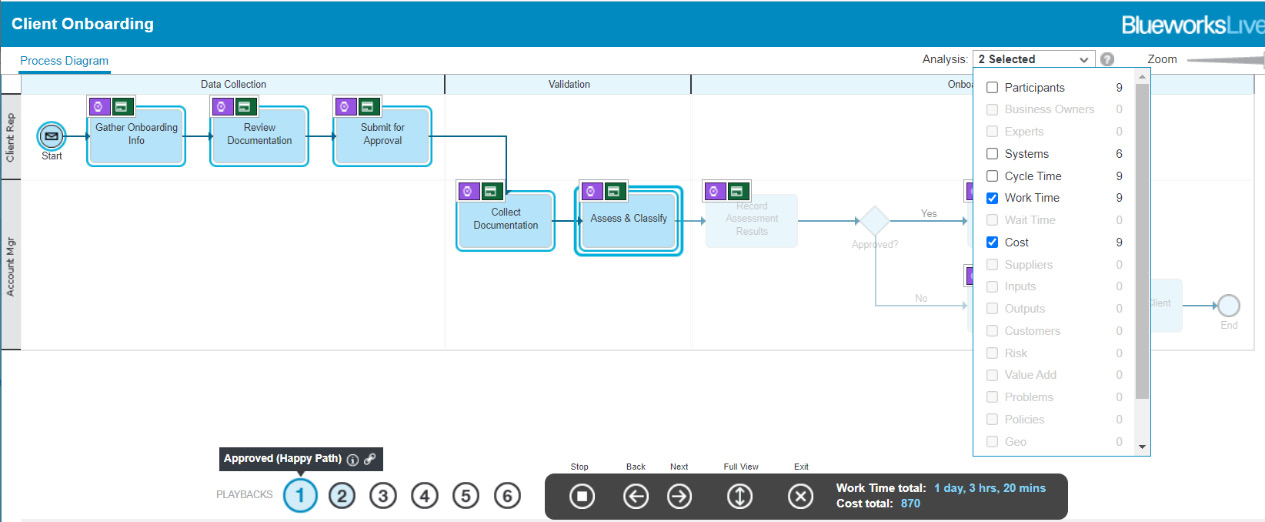
Figure 3.8 – The Client Onboarding process playback, showing cost and time
Finally, as you step through the process paths, the view on the right shows the details associated with the current step, enabling easy conversations with your workshop participants.
You can leverage the Comments section on that same view to easily capture notes and feedback during the workshop:
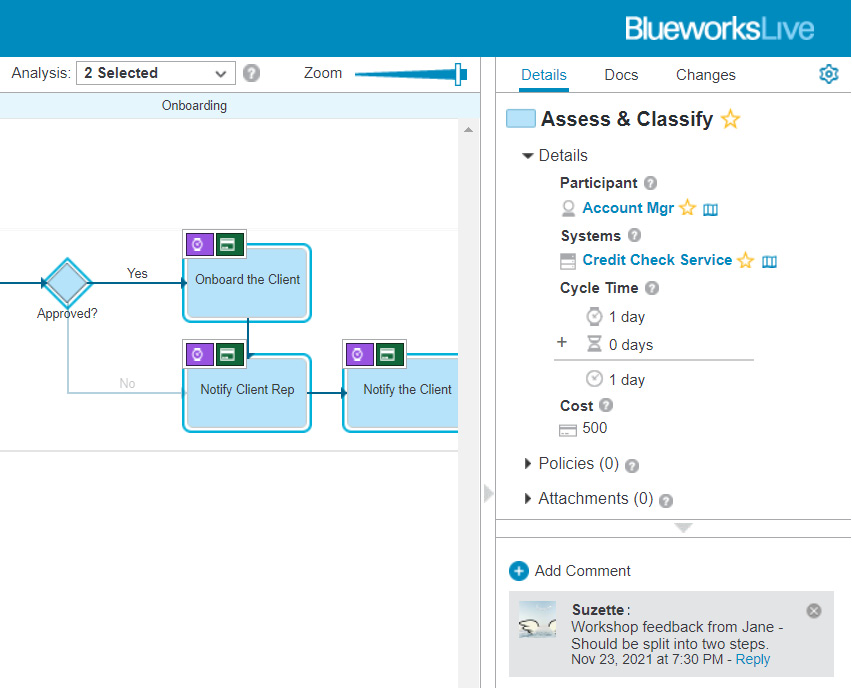
Figure 3.9 – Playback side panel
You should do playbacks periodically throughout your workshop, taking your workshop participants through what has been modeled to date, so that you can gather feedback and validate that their input has been captured accurately. Don’t forget to take snapshots of your process whenever you’ve made significant progress, plus a final snapshot when your process is complete.
It’s also a good idea to do a final playback at the end of your project, to take your external stakeholders through what the team has accomplished.
Capturing stakeholder approval
Once you’ve modeled the process, you should seek out approval from your participants and stakeholders. This can be done right within IBM Blueworks Live. When you do so, your approval record will be saved alongside the process.
In Blueworks Live, create a Process Approval and select the Workflow type. Enter a meaningful name and provide a description. In the Workflow Tasks section, enter the list of people who should review. At this point, it’s best to specify role names. When you initiate approval, you will assign each role to a concrete person at that time. Check the Approval Step box if you require that person to approve the process. Otherwise, leave it unchecked; that person will simply get a review request with no need to provide formal approval:

Figure 3.10 – Process Approval app
In your process, locate the snapshot representing your final process version, launch a Process Approval, and select the app you created previously:

Figure 3.11 – Requesting approval
Now, you can enter the names of the individuals that you wish to approve or review. Optionally, you can set a due date. Everyone will receive an email containing instructions. Once done, proof of approval can be seen from within the process:

Figure 3.12 – Proof of approval
At this point, you have a documented process that reflects your business. You’ve incorporated input from subject matter experts and the business users who perform this process as part of their routine. You also evidence that your stakeholders have approved what was documented.
Discovering hidden processes
In the previous sections, we covered how to discover and document an existing process model by conducting process discovery workshops with the subject matter experts who perform the process as part of their daily activities. But you likely have processes that you don’t know exist because they’re being performed by existing systems or implementations, and the details of what is being done have gotten lost over time or are undocumented. In this case, you can leverage a technique called Process Mining to discover these hidden processes.
IBM Process Mining consumes event logs from Enterprise Resource Planning (ERP) or Customer Relationship Management (CRM) systems such as SAP, Workday, and Salesforce. It analyzes the logs and applies smart mining algorithms to identify trends and patterns. Then, it infers and generates a process model that represents what the system is doing.
Generating the process model
There are four primary steps to perform to get to the point where you have a generated process model:
- Gather the event logs. You will likely need assistance from your IT department or someone with access to those systems and their logs.
- Transform the event logs into the required format. IBM Process Mining will import them in either CSV or XES format. This is now your dataset.
- Import the dataset and map the fields in the dataset to fields known to the IBM Process Mining algorithms.
- Instruct IBM Process Mining to visualize the process. At this point, it will apply the mining algorithm to the data and generate a process model.
The following screenshot shows the BPMN process model that’s been generated from event log analysis:

Figure 3.13 – BPMN process model generated from event log analysis
You now have a BPMN process model that reflects the activities performed and how they are sequenced.
Identifying high-frequency work
In addition to the BPMN process model, the tool generates a frequency model that is useful for analysis:

Figure 3.14 – Frequency diagram generated from system event logs
Here, the darker the activity or the darker the line, the greater the frequency occurred based on the log data. This is particularly useful when you’re trying to improve or optimize because it’s a good initial indicator of where you might get a good ROI from your efforts.
A lot of additional details and insights are available in this view. I encourage you to look around and explore and examine the data regarding the specific KPIs that are of most interest to your organization. For example, by examining the processing time of individual tasks, you can identify potential bottlenecks. Introspecting how tasks are distributed among the various participants or roles can tell you if inefficiency or delays are happening due to people, resource shortages, or contention. The frequencies associated with the different paths through your process can tell you if errors or reworks within your process are happening more often than you realize.
You can find some sample datasets, along with instructions, at https://github.com/IBM/processmining/tree/main/Datasets. This is a useful reference to fast-track learning and exploration. You can use these to practice using the rich analytics capabilities within IBM Process Mining, and to see how they can be applied to various use cases and KPIs.
Leveraging Task Mining
If your organization allows it, you can leverage Task Mining to gather even more insight into what your users are doing. Task Mining Agent, installed onto your users’ desktops, monitors how your users interact with their desktop applications and with chosen websites. This allows you to develop a thorough understanding of how your users work and what tools they use to perform their tasks. With this data, you can augment your process model with accurate and specific details that may otherwise be missed:

Figure 3.15 – Task Mining Agent launcher
The applications and websites to be monitored are specified in the Monitoring List configuration view. You can also identify applications and web pages that should be ignored:

Figure 3.16 – Monitoring List configuration for Task Mining
You can use Task Mining to drill down into the details of a user activity discovered during Process Mining. Alternatively, you can use Task Mining in a standalone fashion, using it to analyze what your users are doing, without performing any process mining.
The data that’s been gathered is collected, processed, categorized, and published, resulting in a process model available in the Process Mining user interface, much like the ones seen earlier in this book, ready for further analysis.
Identifying automation opportunities
Once you’ve loaded your dataset into IBM Process Mining and have generated a model, you can use it to identify additional opportunities for automation. Switch to the Analytics perspective and navigate to the Automations view. This will produce a dashboard that provides insight into your automation coverage.
In particular, the Automation Level widget lists your activities and identifies how much automation you have for each:
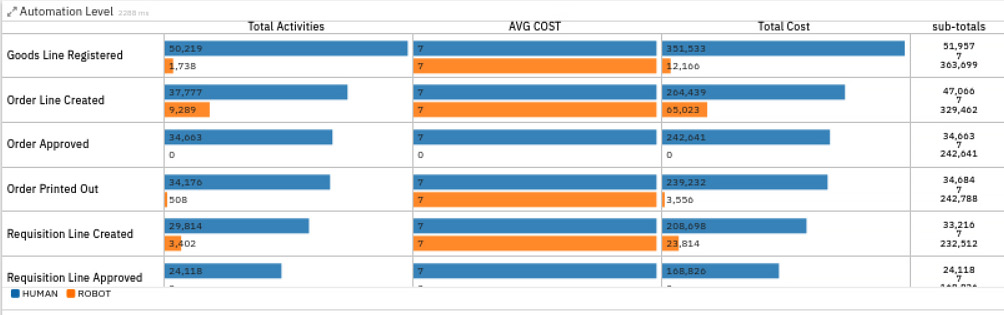
Figure 3.17 – Automation Level visualization, showing the degree of automation for each activity
You can use this view to identify activities that have no automation today or activities that are only partially automated. You will want to focus on the activities at the top of the list – that is, the ones that occur most frequently and carry the most cost.
Early validation of potential improvements
Once you’ve identified the activities that you wish to automate, you can leverage the process simulation capability of IBM Process Mining to simulate the change and measure the potential cost or time savings before you proceed with the automation.
In IBM Process Mining, switch to the Process Mining perspective and select the BPMN tab. Click on the Simulation button and provide a meaningful name for your simulation scenario.
Now, you can configure the simulation to best reflect what you believe you will automate. Some recommendations are as follows:
- Increase the number of instances.
- For each activity that you intend to automate, reduce the staff availability. Then, switch to the RPA tab and increase the robotic quote and the number of robots.
When you’re ready, click Run Simulation. When it completes, the Process Details view will show the difference between your original model and your simulated one:

Figure 3.18 – Simulation results showing potential cost and time gains from automation
If you’ve chosen well, you will see that your candidate automation will result in a decrease in cost, time, or both. It’s best to conduct a series of simulations to exercise various scenarios and identify the optimizations that provide the greatest payout for the investment. This data can be used to help build a business case if you need approval to increase your automation budget.
Summary
In this chapter, we discussed the key first step in any intelligent automation project, which is to understand the business problem.
We reviewed the value of a shared language and introduced the Business Process Model and Notation (BPMN) to facilitate communication between the business and the automation developers. We looked at process discovery workshops as a technique for discovering process models by involving the subject matter experts who work with and perform the process as part of their daily duties. For those instances where the process was not known to the line of business and was instead hidden away in existing implementations, we looked at Process Mining as a technique for discovering processes by analyzing system logs. Finally, we looked at approaches for identifying activities that are not yet automated or are partially automated, and which would result in cost or time savings if they were automated.
With that, you have identified what you would like to automate. The information you’ve gained and the artifacts you’ve produced can be used as input in IBM Process Workflow or to plan which software robots you will build using IBM Robotic Process Automation. In the subsequent chapters, we will learn how to build out an automation solution using these and other products within IBM Cloud Pak for Business Automation.
Further reading
- Business Process Model and Notation (BPMN): https://www.omg.org/bpmn
- IBM Blueworks Live: https://www.blueworkslive.com
- IBM Process Mining: https://www.ibm.com/cloud/cloud-pak-for-business-automation/process-mining
- IEEE XES Standard, IEEE Task Force on Process Mining (tf-pm.org): https://www.tf-pm.org/resources/xes-standard