
Chapter 9
Yield management
Introduction
Hotels have always charged different rates for different types of rooms, just as they have always varied those rates according to the season or time of the week. However, guests in similar rooms on the same night paid the same rate.
Things began to change during the 1960s, when the airlines (who face the same kind of problem as hotels in that a seat unsold for a particular flight can never be sold again) began to offer significant discounts to passengers who were willing to book in advance. Other large transport organizations, such as the railways, quickly copied them, and their fare structures quickly became very complicated. Not surprisingly, they rapidly became interested in identifying the best ‘sales mix’ for any particular flight or trip. Since airlines in particular are pioneers in the application of new techniques and technology, they have taken the lead in this field.
What is true for airlines and railways is also true for hotels, for they, too, cater for a range of different market segments. Most accommodate a mixture of business travellers and holidaymakers, and large hotels are likely to add group tour members, conference delegates, transfer passengers and airline cabin crew on stopovers, to name but a few. Some of these guests will be charging their bills to company accounts, while others will be paying for themselves. Although the first group may not worry very much about the hotel's rates, their employers certainly do, and they are often powerful enough to be able to negotiate very favourable terms. Meanwhile, members of the second group have learned that they can offset their weaker purchasing power either by joining together, or by booking much further in advance, or by a combination of the two.
The result is that modern hotel tariffs can be just as complicated as passenger transport ones. Just as passengers in adjoining plane or train seats may have paid different amounts for their tickets, so guests in identical adjoining rooms may be paying markedly different rates, even though they are enjoying the same services and facilities.
The question that this development poses is, what type of business should the hotel accept? More and more such hotels are negotiating preferential rates with favoured customers. At the same time, differences between market segments with respect to the length of time between booking and arrival have also become more marked. Relatively low price group bookings are often arranged months or even years in advance, whereas many high price single bookings are only made a few days before arrival. There is thus a risk that a hotel may find itself turning away lucrative business because it has already committed itself to taking a less profitable type.
The effect of this is that (like the airlines) hotels are having to pay much more attention to their ‘sales mix’, in other words, the proportion of bookings of different types taken. This has always been a consideration when taking group business, but the proliferation of different rates has made it much more important nowadays. At the same time, the development of computers has made the process of calculating the optimum sales mix much more effective. The result has been a great expansion of interest in what is called ‘yield management’, which is what we shall be looking at in this chapter.
Differential rates
We have already seen that travel agents can earn a discount on any booking made through them, and we have described the mechanism by which this is paid. The larger credit card companies can negotiate similar discounts. The customer still pays the full rack rate, of course, but this is immaterial as far as the hotel is concerned.
Many large associations are offered the same kind of concession. It is quite common for their members to be eligible for discounts in this way. As private individuals their purchasing power may not be very significant, but collectively they represent an important source of business. This applies to trade associations, professional bodies, trade unions and the like. In these cases the individual guests DO benefit from the discount.
Companies can also negotiate special rates. Many hotels offer a special ‘corporate rate’ almost as a matter of course, but important companies responsible for providing a significant amount of business can hold out for much better terms than these. A large local firm may account for some 20-25 per cent of a medium-sized hotel's business, for example, and its bargaining power is thus considerable. The same applies to the bigger travel agencies, tour operators or airlines.
The actual level of rates available is likely to vary considerably, and is usually confidential. However, one informed assessment indicates that they cover the range shown in Table 6.

Booking horizons
Holiday guests generally make their bookings much further ahead than business travellers. This is mainly because holidays are planned in advance, whereas many business trips have to be arranged at short notice.
This lengthy ‘time horizon’ is particularly true of the group tour business. In this case the organizers often book large blocks of rooms long before they actually sell them to their customers (in other words, the rooms are booked even before the holidaymakers get around to planning their vacations). Large block bookings made two or even more years in advance are common in the case of busy tourist destinations. This is also true of conference bookings, which share many of the characteristics of package tourism.
On the other hand, leisure bookings are generally much more price-sensitive than business bookings. There are several reasons for this:
![]() In most cases leisure bookings are paid for by the individuals making the bookings rather than by their employers.
In most cases leisure bookings are paid for by the individuals making the bookings rather than by their employers.
![]() Holiday travel is less dependent upon location than the business kind. If one resort turns out to be too expensive, the holidaymaker can usually choose to go to another, whereas business travellers generally have no alternative but to go to one specific destination.
Holiday travel is less dependent upon location than the business kind. If one resort turns out to be too expensive, the holidaymaker can usually choose to go to another, whereas business travellers generally have no alternative but to go to one specific destination.
![]() The longer leisure booking time horizon allows the holidaymaker to go ‘bargain hunting’.
The longer leisure booking time horizon allows the holidaymaker to go ‘bargain hunting’.
![]() Very competitive bargaining over rates is characteristic of group tour operators and large-scale conference organizers. They are able to do this because they can offer substantial numbers of guaranteed future bookings, and hotels are reluctant to turn these down.
Very competitive bargaining over rates is characteristic of group tour operators and large-scale conference organizers. They are able to do this because they can offer substantial numbers of guaranteed future bookings, and hotels are reluctant to turn these down.
In contrast, there is a good deal of evidence to indicate that business travellers are not as price-sensitive as leisure travellers. This is understandable, because the business travellers are not paying for the accommodation themselves. Their employers (who are paying for it) try to hold expenses down, of course, but even if bookings are arranged through company travel managers there tends to be a lot of ‘upward pressure’ from the executives who are doing the travelling.
Since leisure bookings generally earn the hotel less revenue than business ones, a hotel which ‘fills up’ with leisure bookings well in advance runs the risk of having to turn down requests for accommodation from higher value business customers close to the date of arrival. This situation is made worse by the fact that such business will almost certainly go to your competitors, who will thus earn more money than the original hotel.
The differences between leisure and business booking patterns are shown in Table 7 and Figure 48. This summarizes the bookings received for a particular date and shows the cumulative totals received at various points in advance of that date. For the sake of simplicity, we have assumed that each class of business accounts for 50 per cent of the hotel's bookings, and that there is no unsatisfied demand. These figures should not be regarded as typical, but the general relationship remains broadly true.

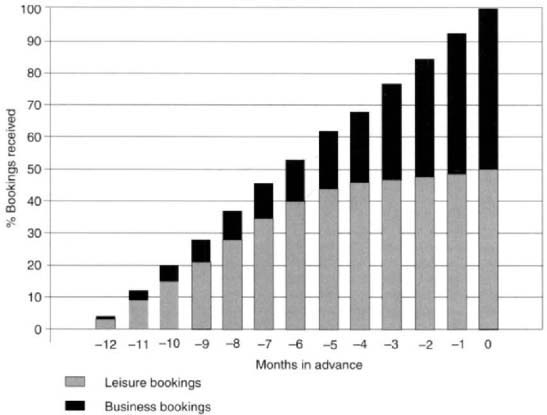
Figure 48 Differences between leisure and business booking patterns (1)
In our example, over half of the ‘leisure’ bookings (i.e. 25 per cent of the total) are received eight months before the actual date of arrival, whereas this proportion is not achieved in the case of the ‘business’ bookings until three months before arrival.
As you can see from the graph, total bookings rise in a straight line until the hotel becomes fully booked during the last week or so before the arrival date.
Now suppose that the ‘leisure’ bookings turn out to be 20 per cent higher (perhaps the exchange rate is favourable to tourism, or there is a major sporting event attracting visitors to the location), while the ‘business’ demand remains the same. The figures are shown in Table 8 and Figure 49.
In this case, the ‘leisure’ bookings are running at a higher rate than the business ones. Assuming that the hotel operates on the traditional ‘first come, first served’ basis, it will continue to take both types until Month -2, when it suddenly finds itself running out of rooms. At this point it will probably stop accepting the few remaining ‘leisure’ requests, but by then it is too late for it to be able to take many of the late ‘business’ bookings, which consequently level off at 42 per cent. As you will remember, they ended up at 50 per cent in the previous example. The difference of 8 per cent represents a loss to the hotel, not just of money but also of goodwill.

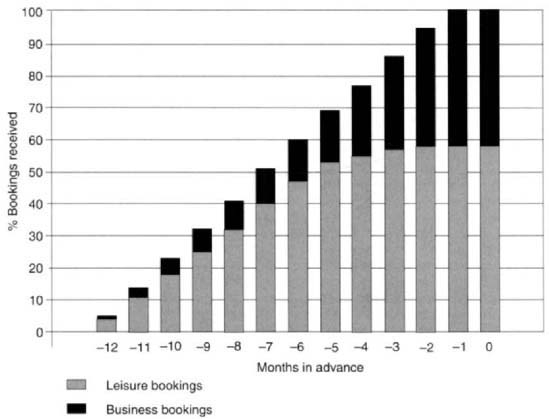
Figure 49 Differences between leisure and business booking patterns (2)
Forecasting bookings
Clearly, if a hotel wants to take effective avoiding action in such circumstances, it must be able to forecast the final level of bookings. One way of doing this would be to take each market segment in turn. However, experience suggests that the best approach is to try to predict the total number of guests expected, and then break this down into different segments in the light of previous experience. Since this ‘top down’ approach is working with larger numbers than those for any individual segment, it tends to be more successful.
The simplest of the forecasting techniques is ‘time series analysis’. This tries to smooth out the inevitable random fluctuations by assuming demand to be equal to the average of the equivalent nights in the past. However, there is not much point in taking more than three or four years into consideration because circumstances change so much that earlier figures will be irrelevant. An analysis which always uses the most recent set of nights is known as a ‘moving average forecast’. The equation for a four-year moving average for demand next year is as follows:
![]()
| Where: | y is the current year |
| F is the forecast demand, and | |
| D is actual demand for the equivalent night in the year indicated. |
The moving average approach suffers from the disadvantage that it gives equal weight to each of the years in the calculation, including the one furthest away from the present day. A technique called ‘exponential smoothing’ can be used to produce forecasts in the light of the most recent results. The formula is as follows:
![]()
| Where: | y is the current year |
| F is forecast demand | |
| D is actual demand for the equivalent night in the year indicated, and a is a ‘smoothing constant’ between 0 and 1 (e.g. 0.1). |
The effect of the smoothing constant is to emphasize the most recent results. The larger it is, the more weight is given to that result.
There are many other statistical techniques, some of them very sophisticated, but we do not propose to deal with them here because their use is limited as far as hotels are concerned. The problem such establishments face is that because demand is not only seasonal but varies from one day of the week to another, the only real basis for analysis is the same night last year, the year before and the year before that. Each night in the series is thus twelve months apart, and a lot can happen in that period. For example, there can be:
![]() Changes in the economic environment, such as booms or slumps.
Changes in the economic environment, such as booms or slumps.
![]() Fluctuations in exchange rates.
Fluctuations in exchange rates.
![]() Security threats, whether real or imagined (notoriously, American demand for accommodation in Europe tends to fall if there is trouble in the Middle East).
Security threats, whether real or imagined (notoriously, American demand for accommodation in Europe tends to fall if there is trouble in the Middle East).
![]() ‘One-off local events, such as major exhibitions.
‘One-off local events, such as major exhibitions.
![]() The hotel's marketing activities, such as advertising campaigns or special promotions.
The hotel's marketing activities, such as advertising campaigns or special promotions.
![]() A change in the competitive position, such as the opening of a major new hotel nearby.
A change in the competitive position, such as the opening of a major new hotel nearby.
These considerations limit the effectiveness of purely statistical techniques. Because of this, it is more usual to combine their predictions with what are called ‘judgemental’ inputs to produce the final forecast. This is usually done by a yield management team of two or three senior staff, including the front office or reservations manager and the sales manager. The team's task is to look at whatever forecast the statistical techniques might have produced, and then modify this in the light of new factors like the ones listed above.

Figure 50 Anticipated and actual bookings
Reacting to variations in demand in order to maximize yield
No matter how sophisticated the forecasting technique or how skilled and experienced the yield management team may be, the actual bookings are likely to fluctuate unexpectedly.
Figure 50 shows what might happen. The straight line represents the anticipated booking pattern, whereas the jagged one shows what actually happened. It tells us that bookings were higher than expected some ten months before the date of arrival, whereas they sagged somewhat two or three months later, before picking up again in the last quarter.
Comparison between forecasted and actual bookings can be used to ‘trigger’ appropriate adjustments. In this example the hotel could have reacted to the unexpectedly high demand in Month -10 by raising its average rates. It might have done this by:
1 Reducing the discounts offered to travel agents and other intermediaries.
2 Reducing the number of leisure’ bookings accepted by ‘closing out’ the lower rates, in the expectation that these would be replaced later by higher yield ‘business’ bookings.
Similarly, when demand began to show signs of falling off in Month -6, the hotel could have taken remedial action by increasing discounts and accepting more ‘leisure’ bookings, in other words, ‘opening up’ the lower rates.
This kind of flexibility requires rapid reactions on the part of the hotel, and it is the kind of activity which responds well to computerization. The computer can be programmed to keep a cumulative bookings total for each date, and to ‘signal’ the reservations staff every time total bookings show a significant rise or fall compared to the expected level. Human beings can do this, too, but only at the cost of maintaining additional records, whereas the computer can do it automatically.

Experience indicates that computers are able to react more quickly to changes in booking levels, and that this can save the hotel money. For instance, it is quite likely that the computer would react to the fall-off in demand at the beginning of Month 7 in our anticipated/actual graph, whereas a human operator might well not react until the end. The loss of a whole month of reaction time could make a big difference.
In reality, our straight line is much more likely to be replaced by a curve. Moreover, small variations in the number of bookings taken in any one month are only to be expected and are not too important: it is only necessary to take action when the variation is substantial. Therefore, hotels practising yield management tend to make use of what are called ‘threshold curves’, as shown in Figure 51.
In this case, action would only be triggered if the bookings fell outside the band between the upper and lower ‘threshold’ values.
In practice, hotels respond to variations in actual as opposed to expected demand in one of two ways:
1 They ‘open’ or ‘close’ particular rates. For instance, they can instruct their sales staff that they should only take rack rate bookings for particular dates, while allowing them to offer discounted rates for others. Weekends are usually low occupancy times, so discounts would be offered to encourage bookings, whereas weekdays tend to produce high demand and would be ‘closed off’ as far as the lower rates are concerned. A simplified version of the kind of schedule which results would look like this:
| Sunday | Monday | |
Rack rate |
Yes | Yes |
Discounted rate |
Yes | No |
2 They allocate blocks of rooms to particular rates, then switch these around to meet changing circumstances. For instance, a hotel with 200 rooms might allocate 100 of these initially to group or conference business. If demand for these is strong, while rack rate take-up seems lower than expected, then more rack rate rooms could be switched across. One way in which this kind of adjustment is sometimes carried out is by the yield management team making ‘phantom’ bookings at the lower rate. This stops the reservations staff or bookings agencies from selling those particular rooms, which can then be quietly transferred to the higher rate blocks. The process may seem unnecessarily complicated, but it is actually quicker and more certain than circularizing a number of different agencies to try to get them to stop selling a particular rate.
In practice, the division between ‘leisure’ and ‘business’ we have been using up till now is too simple. As we have seen, large hotels can operate with up to half a dozen separate rates for different market segments.
In our next example we have assumed a 1,000-room hotel with standardized rooms. The rack rate for single occupancy is £100, but there are three other single rates depending on the type of booking.
Table 9 and Figure 52 show the cumulative number of bookings expected from each market segment for each month prior to the date of arrival. These are not necessarily typical (there will be many variations in practice), but they should help us to understand the process and some of the complications of yield management.
In this example, each market segment is expected to produce 25 per cent of the total bookings (i.e. 250 rooms at full occupancy), but each block will fill up at a different rate. For instance, the ‘rack’ rate will be levied on both private ‘leisure’ and last minute business and professional bookings, which is why it shows a steady growth over the whole twelve-month period. Similarly, the ‘agency’ rate will be offered to travel agents handling both private and ordinary business travel, which explains why it follows something of the same pattern. The ‘corporate’ rate is for large, favoured customers who will tend to book at the last moment, while the ‘group’ rate will only be available to large group tour firms who, as we have seen, will book large blocks of rooms well in advance.
The operating principle is simple. The yield management team (or better still, the computer) keeps watch over the actual number of bookings taken at each rate. If in Month -8 ‘rack rate’ bookings are significantly higher than expected, the remaining twenty ‘group rate’ rooms can be switched to cope with this unexpectedly higher demand. If these can all be sold at the ‘rack rate’, then the hotel will have gained
20 x £45 (the difference between the two rates) = £900
If, on the other hand, ‘rack rate’ bookings are moving much more slowly than expected and only total forty in Month -8, then twenty ‘rack rate’ rooms can be switched to the group market. If these can be sold, then the hotel will have earned
20 x £55 = £1,100
which it might not have done otherwise.
Other rate adjustments are possible. In this way, by keeping a careful eye on actual demand as compared with expectations, the hotel is able to maximize its revenue or ‘yield’.
There are psychological problems to be overcome when using this approach. Traditionally, front office staff dealing with bookings have tended to see ‘a full house’ as their main measure of success. Coupled with this is the fact that the usual way of refusing an unwanted guest is to say, ‘I'm sorry, we don't have any rooms available.’ The yield management approach may require the reservations clerk to use this phrase to a would-be low rate customer even though she knows perfectly well that there are twenty or thirty rooms still unbooked. This goes against the grain, and it also takes nerve to turn good business away in the expectation that higher yield bookings will turn up eventually. The old saying ‘A bird in the hand is worth two in the bush’ still carries a lot of weight.
Table 9 Differential rates and expected booking patterns

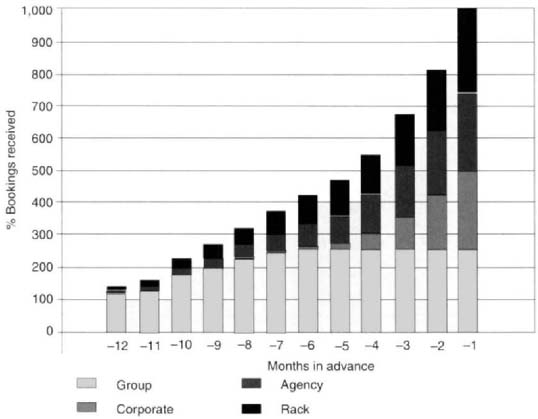
Figure 52 Differential rates and expected booking patterns
The answer (as so often) lies in careful training and in regular review and feedback sessions. Reservations staff need to be taught that the objective is yield, not occupancy per se. They need to be shown how yield is calculated, and how turning some bookings away can actually raise it. The feedback sessions should also have the effect of improving the forecasting system, and this will in turn build confidence.
Fortunately, guests are becoming more familiar with the application of yield management systems in other areas, and they can see that there are some advantages from the customers’ point of view. The main one is that it offers more choice. Catching an early and popular commuter plane or train may cost them the full fare, but they can always choose a later (if less convenient) one and pay much less. Since they are accustomed to making this sort of choice over their travelling arrangements, they are neither surprised nor offended when a hotel reservations clerk says, ‘I'm sorry, we're going to be very busy on that date, and I can only offer you rack rate’.
Displacement
In reality, many guests want to stay for two or more nights. This is often the case with group tours or conferences, which tend to be low yield, and it raises one of the main difficulties experienced when applying yield management to hotels.
The problem stems from the fact that the hotel will have to prepare a separate set of booking estimates for EACH DAY. This means that it is likely to offer a different combination of rates for subsequent days. As we have already noted, demand is usually low for Sundays, so the full range of rates will probably be on offer then, whereas it tends to be much higher for Mondays and higher still for Tuesdays.
Using the example of our 1,000-bed hotel quoted previously, we might assume that the yield management team had laid down that the rates available should be as shown in Table 10 (these rates are often referred to as ‘A’, ‘B’, etc.).
Table 10 Rates available for specified days
| A | B | C | D | |
| £lOO | £85 | £70 | £55 | |
| Sunday | Yes | Yes | Yes | Yes |
| Monday | Yes | Yes | No | No |
| Tuesday | Yes | No | No | No |
| Wednesday | Yes | Yes | No | NO |
| Thursday | Yes | Yes | Yes | No |
| Friday | Yes | Yes | Yes | Yes |
| Saturday | Yes | Yes | Yes | Yes |
This schedule reflects the fact that demand is expected to be high for Monday and Wednesday, and even higher for Tuesday. The hotel may well have used up most of its ‘group’ booking block and would be unwilling to allocate any more peak period days to this market segment, though it is still willing to sell weekend nights at the group rate.
However, stays of more than one night create a problem, namely, which rate should be quoted? A caller requesting a three-night stay commencing on Sunday might be quoted £100, £85, £70 or even £55 depending on how hard he pushes the question of discounts (many prospective guests are quite prepared to bargain like this). The trouble is that he will then be occupying a room on Monday and Tuesday for which a higher price might otherwise have been obtained. Conversely, a caller requiring a three-night booking commencing on Tuesday might find only one price (£100) being quoted, leading to the risk that the hotel will lose the booking even though it would have been willing to accept him at £85 on the two following nights.
Prospective guests who find themselves unable to obtain rooms at a high rate because those rooms have already been let to guests paying a lower one are termed ‘displacement’. Some of these would-be guests might well have stayed on for subsequent nights too, which produces ‘secondary displacement’, and a number might have found that they liked the hotel and become future customers too, which produces ‘tertiary displacement’.
Calculating of the costs and benefits of displacement can be very complicated, but we can demonstrate the nature of the problem by means of a simple example.
Your hotel has sixty rooms with a rack rate of £100. The average length of stay for rack rate guests is 1.5 nights (i.e. one out of every two guests stays for two nights). Rack rate demand for Saturday and Sunday nights only averages ten rooms per night, and you expect it to be no more than 25-30 on Monday and Tuesday nights. This would still leave you with plenty of spare rooms to sell to any ‘chance’ (i.e. last minute) customers, so there is no reason not to take a small group.
In fact, we will assume that you let twenty rooms to the group at 50 per cent of rack rate (i.e. £50). This group arrives on Saturday and stays for four nights. However, the actual number of rack rate requests for Monday and Tuesday nights turns out to be twice as high as expected. You actually get fifty-six such requests for the Monday, and as many as sixty for Tuesday.
What happened? Well, on Saturday and Sunday you were able to accommodate all the rack rate requests and you still had rooms unoccupied. You couldn't accommodate all the rack rate requests for Monday and Tuesday, however, because the group was taking up some of the rooms that such customers wanted to use. On Monday you could only meet forty of the rack rate requests, which meant that you had to turn away sixteen. It was even worse on Tuesday, when you had to turn away no fewer than twenty.
Half of the would-be guests who wished to come on Monday would have wanted to stop over on Tuesday as well, remember, because one out of every two rack rate customers stays for two nights. And half of those who proposed to arrive on Tuesday night would have wanted to stay over for another night too, so you are losing an extra night's revenue in their case as well.
You can work out your gains and losses in the form of a displacement schedule. It would look like the table below.
The gain is the total group nights times the group rate (i.e. 80 x £50). The loss is the primary and secondary displacement (i.e. 36 + 18 = 54) times the rack rate (i.e. 54 x £100). This is the difference between what the hotel gains by taking the group and what it loses by doing so.
Note that we don't include the actual rack rate lettings in this calculation because they aren't ‘displaced’. We also don't include anything that might have happened on Wednesday, other than the secondary displacement, because the group had left by then and so had no further effect on revenue.
We have shown the secondary displacement for Wednesday as being half the number of refusals for the previous night, as it was for Tuesday, but this may be a slight over-estimate. You could argue that even if we hadn't taken the group, eight of those twenty unsatisfied rack rate requests for the Tuesday night could still not have been met since the beds would have been required for the extra rack rate stopovers from Monday night. In this case the secondary displacement for Wednesday ought to be (20 - 8)/2, which equals 6. However, this may well be a complication too far for most purposes.
You will notice that we have left out any estimate of the loss from tertiary displacement. This is because it is much more difficult to calculate. While we KNOW how many potential rack rate customers we had to turn away, tertiary displacement involves us in making assumptions about what they might or might not have done in the future. Some managers would argue that this kind of loss is too hypothetical to be included in the kind of calculation shown above.
However, SOME of those we refused undoubtedly won't bother to try our hotel again, and we ought to make an effort to account for this factor. One approach might be to base our calculation on the normal proportion of repeat guests we receive. These are people who need to come back to this particular location and have been satisfied with our prices and facilities so far. Would-be guests whom we have to turn away would probably have behaved in much the same way. If we have to deny them, they will go to another establishment. They may well find that to their liking too and become regulars there.

We need to allow for the number of nights such guests might have stayed during future visits. After all, regulars do come back more than once. However, we don't think you ought to extend this kind of allowance too far ahead into the future because such market segments are always wasting away because of death, retirement or job changes, and your marketing department ought to be busy trying to attract new customers to replace those inevitable losses. A twelve-month period is probably quite long enough.
As you can see, it rapidly becomes a case of ‘your guess is as good as ours’. However, let us continue to use the figures in the example above, together with a couple of additional assumptions. The first of these is that 75 per cent of our guests are repeat customers, and the second is that the average regular guest makes two visits during the year. As before, their average stay is 1.5 nights.
Given these assumptions, the tertiary displacement might be calculated as follows:

This increases the total net loss to £9,500!
Displacement is something which affects hotels much more than airlines or other transport undertakings. After all, discount rate passengers don't remain on planes or trains and travel backwards and forwards for two or three days, taking up seats that other passengers might have used!
Displacement in hotels can have other special ‘knock-on’ effects too, for rack rate business might well have a higher average spend in terms of bar or restaurant expenditure. Groups are generally on an inclusive tariff and consume set or table d'hôte meals, whereas business guests may well use the hotel restaurant to do some entertaining. You may need to take a careful look at these factors when doing your displacement calculations.
Conclusions
Yield management has proved itself to be a valuable approach to the problems of maximizing room revenue. It will continue to increase in both importance and sophistication (the development of computerized ‘Expert System’ applications using artificial intelligence is already well advanced). However, it is as well to keep certain limitations in mind:
1 Yield management proper is a specific technique which involves the switching of blocks of rooms from one market segment to another. This means that it will only work when demand is high and it is possible to find late, high yield bookings. If overall demand is less than 100 per cent, then ANY bookings are desirable, and the displacement effect is hardly likely to be significant. This is the situation in many hotels for much of the year, which means that yield management is inapplicable in such cases.
2 Many enthusiastic advocates of yield management tend to widen the scope of the technique to include measures which competent hoteliers have been taking for generations. It is true that yield management will help to ‘trigger’ rate reductions and generate intensive marketing activities when demand falls significantly below the expected levels. However, experienced front office managers would take such action intuitively anyway. All that can be said is that a formal yield management approach (especially a computerized one) is likely to ‘trigger’ such reactions more quickly. The one advantage that this enlargement of the term offers is that it does concentrate attention on the important measure of yield as opposed to mere occupancy.
3 Yield management is a technique which has been developed largely by airlines and other large transport firms. There are significant differences between such undertakings and hotels. There are usually several flights or trains per day, whereas hotels have to think in terms of one room let every twenty-four hours. This means that transport undertakings generate a lot more data, and since they are generally much larger than hotel companies too, they are better able to afford teams of statisticians equipped with powerful computers. Moreover, as we have seen, airlines and other transport operators do not have to worry about displacement in quite the same way. This means that hotels need to be careful not to accept all their ideas uncritically.
4 Yield management is essentially a quantitative approach. This means that it works best in large and busy hotels, which can generate the volume of numbers which make statistical analysis valid. One authority says that the hotel should have over fifty rooms, which rules out a very large number of properties.
5 Since yield management is a quantitative approach, it ignores significant intangibles like the need to retain goodwill, especially that of important ‘corporate’ customers. These guests pay less and generally book later, but they can account for a significant proportion of a hotel's business. It may not be a good idea to suddenly ‘close off’ as far as they are concerned just because there is a temporary upsurge in rack rate business.
What this last point amounts to is that a hotel has certain obligations towards its regular customers, and although the short-term cost of meeting these may be much easier to measure than the long-term cost of not meeting them, they are nevertheless important.
We looked at this point when we were considering ‘service’ earlier, and found that one aspect of this was that the hotel should not be perceived to be putting its own short-term financial interests before those of its guests. This point is worth repeating. Yield management pushed to the uttermost may raise revenues in the short term, but hotels are part of the hospitality industry, and there are other important considerations as well.
Assignments
1 Is yield management a technique or a philosophy?
2 Compare the Tudor and Pancontinental Hotels from the standpoint of their attitudes to yield management.
3 Your hotel has 200 rooms. The forecast cumulative bookings for one particularly busy date in the future are as shown in the table below, together with the actual cumulative bookings up to six months prior to that date. What action should you take at this point?

4 You are the front office manager of a hotel with 100 beds (ignore room types for the purposes of this exercise). The rack rate is £105, at which you expect occupancies to be as follows: Saturday 25%, Sunday 25%, Monday 95%, Tuesday 95%.
Regulars make up 50 per cent of your rack rate business. They average 1.3 nights stay each, and make three visits each year.
You are approached by ConTours plc (a major tour operator) with a request that you take a group of sixty-five persons from Saturday night to Wednesday morning (i.e. four nights) at a room rate of £55 per person.
Calculate possible displacement. Ignore any food and beverage aspects.
5 You are reservations shift supervisor at a 120-bed hotel with a rack rate of £80, a business rate of £65 and a group rate of £50. The hotel has recently changed hands and the new rooms division manager has just introduced a yield management system. The town is hosting a major ‘one-off’ event, and she expects that demand for the three nights involved will be well over 100 per cent. Accordingly, she has ‘closed off’ all rates lower than the rack rate for those nights.
One of your subordinates takes a telephone call from Mr Dobbs, a well-known local industrialist who regularly books rooms at your establishment on behalf of visiting clients, and who also uses your restaurant for entertaining and occasional functions. He has always been given the business rate, though there is no formal agreement to that effect. He wants to book twelve guests in for the three nights in question.
Acting on the rooms division manager's instructions, your subordinate says that she can only offer him rack rate. Mr Dobbs is known for his violent temper, and he is highly indignant. Your subordinate appeals to you for help. What should you do? (Note: this could be another role play situation.)