Maintenance of Meter Equipment
Regular calibration is necessary to ensure that a custody transfer meter is measuring the proper delivery volumes and meeting contract requirements. The frequency and type of maintenance tests are usually determined in the contract, and the equipment that is used to test the meter must be approved and agreed upon. The best throughput test is one that can be run directly in series with a prover. Maintenance budgets are often cut in a bid to increase profits. This has resulted in less control over the quality of gas transported and the accuracy of the meters used to measure it. The need for clean meter tubes has been repeatedly demonstrated worldwide, yet it is one of the most common causes of measurement error. The calibration and maintenance requirements for accurate measurement of liquid and gas flows are discussed in this chapter.
Keywords
maintenance; calibration; custody transfer; meter; prover; gas measurement; contaminant; liquid; measurement error; provings
Both the shipper and the receiver must have confidence that a custody transfer meter is measuring the proper delivery volumes and meeting contract requirements. Equipment calibration may change over time, so both parties should take an active part in the periodic testing of the meter system. Without tests to reconfirm the original accuracies, a statement of accuracy is not complete and may be misleading.
Maintenance tests usually depend on contractual requirements for type and frequency—as often as weekly or even daily. They may require only a calibration of the readout equipment, a complete mechanical inspection of the entire system, or an actual throughput test against some agreed-upon correct volume.
Maintenance testing may consist of only secondary equipment calibration, or may involve a complete mechanical inspection of the entire system, or an actual throughput test against some agreed-upon standards—or any combination of these.
In any case, the equipment that is used to test the meter must be approved and agreed upon. Such test devices include certified thermometers for temperature, certified dead-weight testers or test gauges for pressure, certified differential testers for differential meters, certified chromatographs for component analysis, and certified provers for throughput tests. Many models of each are available and can be supplied with accuracy certification. Certification is important for both parties to minimize concern about the test equipment acceptability.
Operators who have had experience with similar metering systems will increase the confidence level in the calibration equipment and test procedures. The test equipment itself should be recertified on a timely basis by the agency or manufacturer that originally certified the equipment.
The first step in testing any meter is a visual inspection for any signs of improper operation, such as leakage and unstable flow. This includes a review of all of the attendant equipment and their indications or recordings. If the station appears to be operating properly, the individual elements of the station, such as the meter and the corrections for pressure, temperature, density, and composition, should be individually verified and/or calibrated with the assumption that if all parts are in calibration, the system will be in calibration to the limits calculated by the uncertainty equation. This procedure is commonly used for industrial flow metering.
A master meter used in transfer proving is calibrated and certified to some uncertainty limit by a testing facility of a government agency, a private laboratory, a manufacturer, or the user using agreed-upon flow standards. Periodically, the master meter has to be sent back to the laboratory for recertification. The frequency of this retesting depends on the fluids being tested and the treatment of the master meter between tests.
The best throughput test is one that can be run directly in series with a prover. The prover can come in many forms, but essentially it involves a basic volume that has been certified by the government or an industry group. Such provers for liquid may be calibrated Seraphin cans, certified field test measures, (for fluids with no vapor pressure at flowing temperature), pressurized volume tanks (for fluids with vapor pressure at flowing temperature), or pipe provers (formerly called mechanical displacement provers as described in API’s Manual of Petroleum Measurement Standards). These pipe provers are permanently installed in large-dollar-volume meter stations, but portable units for testing smaller meter stations also exist.
Gas provers are usually master meters with computer controls so that testing requires little or no calculation, or critical flow nozzles (where accurate thermodynamic properties of the gas are available). Critical nozzles-venturi require permanent pressure drops of some 15 to 20% of the upstream static pressure and cannot be run at static pressure below approximately 30 pounds per square inch absolute.
Atmospheric critical flow proving, which requires gas to be exhausted to the atmosphere, used to be popular for linear meters. This is now seldom used because of the cost of lost gas and concerns about safety and the environment.
Great care must be exercised in using such equipment, as detailed by standards or manufacturers’ instructions, to ensure accurate testing. Since these tests are subject to errors, only qualified technicians should conduct them. Run correctly, the tests ensure the best measurement and provide proof of uncertainty (Figure 9-1).

It should be noted that testing requires participation by both the supplier and the customer. Diagnostics and evaluation with proper test equipment ensure that recorded volumes are correct. Any proving must be documented and signed by both parties so that contract provisions can be implemented on any corrections required.
Gas Measurement Maintenance
In a rush to “re-engineer” pipelines—improve profits by lowering cost—a favorite target has been the maintenance costs along gas pipelines. Because of the reduction in personnel and time allocated for testing and maintenance, quality maintenance time has been traded for meeting a schedule of routine work and meeting emergencies. This has resulted in less control over the quality of gas transported and the accuracy of the meters used to measure it.
Maintenance for all meters, particularly orifice and turbine for gas measurement, has suffered. In order to avoid having to change orifice plates to accommodate changing flow ranges, the largest orifice bore acceptable to both parties is often installed along with smart differential pressure transmitters.
Research has clearly shown that volume variations in excess of 5% can occur under such conditions. Therefore, volume and/or energy determination at low differential pressure with flange-tapped orifice meters is inherently risky. When combined with a large beta ratio, the metering system typically has increased sensitivity to pulsation, contamination, and installation effects. The poorer the gas quality, the greater the potential for measurement error.
Measurement upstream of gas processing tends to suffer greater uncertainty and is greatly influenced by such factors as particulate materials, free liquids, and others. All these considerations tend to show a loss for the delivering party (Figure 9-2).

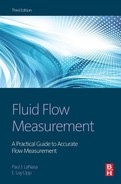
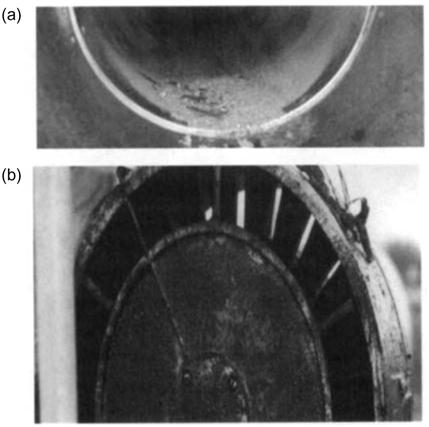
A dirty turbine meter can measure high or low, depending upon where in its range it is being operated. Gas quality has also suffered as maintenance for separators and dehydration plants has degraded. More carryover liquids are moving into pipelines. Add to this the difficulty in shutting in a poor quality gas source. With the pipeline “in the middle” between a purchaser that may be located remotely from the pipeline terminus and the producer interested primarily in continuing delivery, it is easy to understand why many meter stations have been shut in because of poor gas quality, only to be rapidly turned back on without addressing the original quality problems. The complexity of three-way negotiation among parties typically remote from each other makes the problem difficult (Figure 9-3a,b).
Experience has shown that a pipeline “lost and unaccounted for” report can be negatively impacted when this condition occurs. The solution is to improve the quality of the gas handled to the point that solids (iron oxides and sulfides and other pipeline dusts) and liquids (condensates and compressor oils) are reduced to within the contract limits. This minimizes effects on flow measurement. These same materials have a detrimental effect on the efficiency of the pipeline throughput. If allowed to go to extremes, they can cause damage to operating equipment such as regulators and compressors, in addition to the pipeline itself. Obviously such costly pipeline efficiency deteriorations and shutdowns are to be avoided.
Formation of the operation team concept or outsourcing has been less than effective in meeting typical maintenance problems. A major problem is that the number of field personnel in the teams has been reduced from former levels. The teams have become generalist instead of specialist, and this has minimized their specific expertise in flow meter and system maintenance. The outsourcing contractor can report findings but is not a gas sales contract participant. The short-term results of reduced labor costs often ignore the long-term costs of sacrificed pipeline measurement and their effect on billings.
The routine work of today’s field personnel is to emphasize the routine testing of the secondary element transducers and computers with less time allocated to the primary meter devices, which often just given cursory visual inspections. Little or no detailed meter tube removal and cleaning is scheduled. The resulting metering device may or may not meet the gas measurement standards requirements.
Requirements stated in contracts are based on the product whose quantities or contaminants are specified and limited. The contaminants are restricted to no material that will fall out in the pipeline after the gas has been delivered. It is these contract requirements that must be enforced to minimize maintenance. Consideration should be given to proper separation, filtration, drying, heating, or cooling and the costs of these operations to upgrade the gas to prepare it for measurement, rather than trying to keep meters clean in a dirty pipeline.
There is a desire simply to buy better metering to solve maintenance problems. This usually means a new meter, or a new readout system, or a self-analyzing device that sets off an alarm when it has a problem. While all of these are useful, dirty gas means that the user is normally exchanging one set of problems for another unless the gas quality maintenance problems are addressed. Buying a bigger computer to calculate incorrect data does not improve the data. No meter system operates in a dirty gas system without effects on its accuracy. And there just is not such a thing as “clean” gas in the world’s pipeline systems.
Another set of ideas related to dirty meters that has started to appear in pipeline businesses says, “Give me a factor for correcting for the majority of errors caused by these problems and an analysis of the ‘cost-value benefit’ will be made versus the cost of cleaning up the gas.” The fallacy of this is that knowledge of the correcting factors is lacking, and the database is poor or non-existent for all conditions, so the correcting data are highly questionable (Figure 9-4).

The second problem in this approach is the assumption that these contaminants arrive and deposit once, then do not change with time. Unfortunately, most flow and related contaminants along a pipeline vary from production to the final customer. If wells load up and kick over, the operator hopes that separators will catch the fluids. Sometimes they do, often they do not. Likewise, dump valves on separators will hang up and fail to dump the fluids, which then end up in the pipeline. As compression and processing plants get older, there is more oil leakage, or more process upsets than is experienced with new equipment. Even if the contaminants are at very low values, as specified in contracts, over time they build up to significant total quantities.
For example, two molecules of steel pipe react with three molecules of oxygen to form ferric oxide. Whenever oxygen gets into a pipeline, chances are it will react with the pipe. Ferric oxide is found in all pipelines to some degree. It varies in color from red to black and is generally described as “line dust.” As it is normally in the 1–3 micron size, it moves very easily with the gas flow, particularly as the flow rate changes.
To keep dusts from being formed, sources of oxygen—water, oxygen (air), and carbon dioxide—should be minimized in the pipeline. Hydrogen sulfide, although it does not contain oxygen, will react in the presence of oxygen to form several compounds of iron and sulfur. The quality requirement of natural gas was written around this knowledge.
Once formed, rust may be removed by pigging, filtering, or oil scrubbing. To minimize dust movement, low and stabilized velocities in the same direction are recommended. Variations in flow rates or reversal of flow will cause a “dust storm” as the rust is loosened. If it becomes a continuing problem, then oil fogging can be used to reduce dust movement. This, however, must be done with utmost care since the oil itself can cause trouble with the flow measurement.
The “bottom line” is that gas metering to the quality specifications of contracts is the simplest and best answer to minimize the maintenance problems.
Experience has shown that the best solution to a problem is to correct it at the source rather than to treat the symptoms after they appear in a pipeline system. Once started in a pipeline, they tend to be self-perpetuating and increase the problems in flow measurement over time.
In presentations at two meter schools, the problem of poor maintenance has been discussed in detail. In an article, “Problems in Offshore Measurement,” presented in 1991 at the Acadiana School, examples of losses due to typical dirty measurement conditions were presented showing an estimated calculated loss of $14.5 million per year. A paper on the same subject at a later Acadiana School in 1996, entitled “The Value of Check Meter and Surveillance System,” found the actual losses by using a check meter station in series with the billing system. The check meter showed losses of 0.42% of deliveries for a total of over $400,000 per year for five years, or slightly over $2 million dollars of actual adjustments paid because of the combination of primary and secondary devices found to be in error.
Many of the large adjustments were due to primary device errors that emphasized the need for these inspections because, as the second paper states, “all tubes will eventually foul” and “all stations are subject to problems.”
Minimizing maintenance in an effort to reduce short-term costs has an economic impact on pipeline operation efficiency and metering in just the opposite way to that planned when the original downsizing was done.
Meter Tube Inspection and Cleaning
Good orifice meter measurement requires that new metering equipment is built and installed to meet the requirements of AGA-3 Part 2. As previously discussed, in addition to the requirements for new installations, meters must be maintained in like-new conditions to continue providing accurate measurement. This requires maintenance, since all pipelines contain liquids and solids that will dirty meter tubes and necessitate cleaning. Meter tubes for other types of meters should also be similarly inspected and cleaned.
Previous cleaning methods required line shutdown and removal of meter tubes. In recent years, with personnel and budget reductions in the operating and maintenance functions, it has become more and more difficult to get the proper meter tube care funded and accomplished. Yet dirty meter tubes are one of the most common reasons why metering loses accuracy.
New Cleaning Procedure
An improved method of cleaning meter tubes can circumvent the manpower/funding barriers. It involves using this equipment:
Fiber optic inspection device;
Various hoses used in pumping and collecting water;
Drain-collection open tank; and
Chemicals and/or ball hones needed for removing certain deposits.
Several types of hydraulic pump systems, tanks, hoses, hydraulic spray systems and chemicals, and ball hones are available from supply stores and service centers in most oil/gas areas where meter tube cleaning is needed. The equipment is usually rented but can be purchased.
The first step is to inspect the meter tube’s internal condition with the fiber optic device. The meter tube must be blown down and removed from service. Insertion of the inspection device requires a tap that is 1/2 inch or larger in diameter. This may be a blow-off valve, a tap hole, or a fitting slot. Where no taps other than those required for T/P/dP transducers are allowed, a new tap may be installed in the meter station piping outside the distance specified by AGA-3.
The most critical parts of the meter tube to inspect are the 5 to 7 diameters immediately upstream of the meter and downstream of straightening vanes or flow-conditioner plates (if used). Examine these for any liquid or solid deposits. Contrary to common belief, any amount of deposit may cause measurements to be in error, usually low. Evaluation of the necessity for cleaning can be made after visual inspection, but cleaning is almost always the best choice. It is simply better to err by cleaning than to take a chance that the measurement may be several tenths of a percent low.
Cleaning also requires a means of inserting nozzles and hoses, typically a 1 inch or larger hole. This can be a 45° collar welded outside the dimensions specified by the applicable standard but inside shutoff valves. Such collars should be welded on the bottom side of the meter tube to allow drainage as well as hose insertion. The collar or collars should allow upstream and downstream access.
Manually feed the high pressure water hose and nozzle of the hydraulic system into the upstream tap. The downstream tap should have a collection container to collect dirty rinse water. Dirty water can be pumped from the container into a collection tank for proper disposal as an environmentally unsafe material.
The high pressure hose can be fed through straightening vane tubes 3/4 inch or larger in diameter. On small meter tubes—3 inches and less—the meter tube will have to be cleaned from both the upstream and downstream directions if flow-conditioning devices are present, or a smaller tube/nozzle system can be used.
The cleaning cycle should be repeated until the drain water runs clear. Check the actual results by repeating the optical inspection. If inspection verifies that internal cleaning has been effective, the drain plugs should be removed and all water drained from the fitting cavity. Proper choice of a drain tap depends on whether the fitting is upright (use both drains) or installed on the side (where only the bottom tap need be used for drainage). Standard purging and repressurizing procedures should be used to return the meter tube to service.
If a tube is not clean after high pressure washing, two other cleaning methods may be used; namely ball hone and/or chemical cleaning, depending on the composition of deposits. Chemical cleaning can be done in place, whereas ball-hone cleaning requires meter tube removal with a pipeline crew and lifting equipment (standard in the pipeline industry) (Figure 9-5).

Once a tube is cleaned chemically or honed, it may subsequently require only water cleaning for an extended time. Periodic inspection will establish how often cleaning should be scheduled and what type will be needed. Prices to rent inspection/cleaning equipment are lower than hiring out the work to be done by a pipeline or contract crew, but the cost and time associated must be added to rental costs for a meaningful comparison.
Summary
The need for clean meter tubes has been repeatedly demonstrated worldwide, yet it is one of the most common causes of measurement error. The procedures that have been outlined cost significantly less than the money represented by faulty measurement.
Effects of Liquids and Solids on Orifice Measurement
Experience with meter tubes with line dust (iron oxide, iron sulfide, dirt and glycol, or compressor oil) has been that the flow measurement is affected, causing the measurement to read low. The following three cases illustrate these effects.
Case 1
A pipeline meter station in the mid-continent area of the USA was examined in November 1999. This station had been running approximately 1.5 to 2% lower than a meter station in series with it for a “number of years.” Many examinations and tests were run over the years to determine what caused the differences, with no solutions found. When the meter stations’ setup was examined, this showed that there were approximately 50 yards between the stations with an oil separator halfway between them. The downstream station produced values 1.5% lower than the upstream. The meter tubes and orifice plates were removed; inspection revealed a light coating of oil (separator) with line dust. When this was mechanically removed, a repeated check between the two stations showed the second station to be only 0.2% lower than the first station—an improvement of over 1%.
Case 2
The inlet measurement at a gasoline stripping plant was questioned. When removed, the orifice plate and the meter tube were found with a 1/16′′ coating of oil (compressor) and line dust. The accumulation was mechanically removed, and the meter increased its flow by 3%.
Case 3
A pipeline was losing approximately 0.6% of its throughput. This was a 1.2 billion cubic foot/day pipeline. The key sales meter stations were examined and found to have accumulations of compressor oil, scrubber oil, and line dust on the orifice plates and meter tubes. When this accumulation was removed the 0.6% loss became a slight gain.
Discussion
In each case, the meters were measuring from 1 to 3% lower than after cleaning. Based on these experiences and others, the meters would under-measure in the range of 1 to 3% as long as the coating of oil, line dust, and salt was present. The deposits change the relative roughness of the meter tube, and the velocity profile is elongated, which gives a low differential causing the lower volume rates. The orifice plate also changes its effective roughness, which affects the flow pattern.
As a result of the various cases previously discussed, a set of comparative tests were conducted using two orifice meters in series. A liquid was injected into the line downstream of the first meter and upstream of the second. This allowed the influence of the liquid on the downstream meter’s readings to be compared to the readings of the non-influenced upstream meter. The results of these comparative tests were divided into three regimes.
The first flow regime had very low liquid content. The liquid content was just enough to produce a thin coating on all of the orifice meter’s internal surfaces. Research performed with low injection rates has shown that flow is under-measured in such circumstances. The under-measurement is consistent and in some cases can be over 1%.
The second flow regime used a higher liquid content than the first regime. The liquid content was high enough for a thicker layer of fluid to form at the bottom of the pipe. This thicker layer of fluid could become redistributed around the pipe surface if fluid velocities increased. Pooling of the liquid in front of the orifice plate could also occur. In this flow regime there is a lot of variability in the behavior of the liquid, and as a result the flow measurement may not be affected or there may be substantial under-measurement of flow. The boundaries of regime 2 can extend from 0.0% or slightly positive flow measurement error to under-measurement of as much as 1%.
The third flow regime has enough liquid in the pipe to create a permanent thick layer of fluid on the bottom of the pipe. The surface of the liquid has a fairly constant roughness. The liquid is dammed up in front of the orifice plate and is drawn through the orifice bore at a steady rate. Orifice plates experiencing liquid loads this high consistently over-measure flow. The amount of over-measurement appears to be a function of the flowing gas pressure and extends from 0.0%, or slightly positive flow measurement error, to as much as 6% over-measurement.
Clearly the issue of free liquid’s influence on orifice metering is variable and results in unacceptable accuracy. Testing of other meter devices show similar results but has not been as definitive.
Flow Computers Require Maintenance
Electronic flow meters/computers (EFMs) are being used increasingly on gas pipelines to meet FERC Rule 636 requirements and the need for online, real-time measurement.
Information from the computers fed to bulletin boards also is used for controlling pipe line inputs and outputs to balance the needs of customers against supplier inputs. The need to quickly determine flow volumes has diminished the use of recording charts to a secondary basis on smaller pipe line input and output volumes.
As EFM capabilities grow and prices drop, their use continues to increase. They generally are selected without question over charts when economics are favorable. Many manufacturers produce a wide variety of models to meet varied customer needs. All computers require maintenance.
EFMs were originally sold on the basis that they were the “way to go” or “the modern approach.” They were designed to be fast electronic calculators that followed the procedures used with charts. They have proved their usefulness in terms of reliability, flexibility, data availability, and speed. Not everything about them, however, is completely rosy. For instance, where does the output come from? The first concern of an astute user should be to question the acceptance of digital output values that involve little or no checking of input data.
Charts by their nature provided an initial source to review data. Chart auditing was the first step in chart processing. If a chart’s recording was unusual, an experienced auditor would notice it immediately and question the field operator to explain or reconfirm recordings prior to chart calculation. In the vast majority of situations today, there is no comparable input data review for EFMs.
The EFM output checking that does take place is usually a review of digitized flow values. Unless an obvious discrepancy appears, there is no questioning of the validity of inputs from which volumes are computed. This “after-the-fact” auditing tends to obscure problems that would have been noticed with charts prior to volume calculation.
Chapter 21, “Flow Measurement Using Electronic Metering Systems,” in the API Manual of Petroleum Measurement Standards (MPMS Chapter 21) lists the information required: daily and hourly quantities for time, flow rate, differential pressure (for orifice use), static pressure, and specific gravity (relative density). In normal operations, time, differential pressure, static pressure, specific gravity and heat content are generally not reviewed unless volumes or totalized heat are questioned. The audit trail listed in MPMS Chapter 21 lists these records to be reviewed:
These data will provide sufficient information to determine reasonable adjustments when:
• The system stops functioning;
• The system is detected to be out of accuracy limits from maintenance tests; and
The problem, as stated above, is that the hourly data, even though properly recorded, usually are not completely audited unless an obvious problem appears with calculated volumes. In other words, flow measurement quality control has been greatly de-emphasized. For this reason, several pipelines have experienced ungainly increases in their “lost and unaccounted for” gas.
Some typical problems that were detected with chart processing, but that remain routinely undetected when EFMs are used, include low differential pressures, improper temperature measurement, loss of static pressure regulator controls, improper specific gravities, and improper heat content. The computer “spits out” flow volumes and total delivered heat, and the user accepts the numbers without question.
The basic problem, therefore, is that responsibility for additional auditing is all too often not defined clearly—if at all. (See “Who’s Watching the Cash Register” in the September 1996 Pipe Line and Gas Industry, page 94.) Better auditing is usually triggered only when discrepancies show up in “lost and unaccounted for” reports. There is no telling how many such erroneous reports have gone into the system undetected.
With economic pressures forcing field personnel reductions, it is valuable to schedule maintenance on an as-needed basis. When volumes and total heat values are properly audited, they become a good source for such maintenance scheduling. The consequent efficient use of field personnel pays off in appropriate testing, better maintenance, improved flow measurement, and ultimately, improved lost and unaccounted for balances.
Still, it is important to remain alert. The “garbage in, garbage out” rule is just as applicable in flow measurement as it is in any other calculation. Beware of the hidden trap with digital techniques. Just as printing a sentence does not necessarily make it a fact, printing out digital values does not make them necessarily valid. And the responsibility for thorough and regular data auditing needs to be clearly established.
Effects on other Meters
Ultrasonic meters are also affected by deposits. The influence of fouling on the accuracy of the ultrasonic gas flow measurement is partly generic and partly dependent on the design of the meter. The first relates to the change in the cross-sectional area; the second depends on the transducer design and frequencies used as well as the path configuration.
All flow meters—including orifice, turbine, and ultrasonic—are sensitive to the stability of their cross-sectional area. When fouling is present, the uncertainty of the cross-sectional area has by far the largest influence on measurement uncertainty. Being a “squared relationship,” an 0.1% change in the diameter leads to an 0.2% measurement error.
In dirty gas applications, small ultrasonic meters are more sensitive than large ones, but for all meters it is essential to determine whether and possibly how much fouling is present. Here the comparison of single- and multi-reflection paths in a meter offers better diagnostic analysis over straight path designs (but not necessarily better overall operation and accuracy).
Fouling on ultrasonic bore walls and transducer surfaces can produce three sources of error; measuring effects from them can each also help diagnose possible problems:
• Changes in flow profile and possibly in swirl angle; and
• Changes in signal strength, which can be caused by fouling on the transducer head, or for reflective designs, a change in the ultrasonic reflection coefficient.
Operation over a wide range of pressures (up to approximately 9,000 psi/600 bar) and varying gas compositions—especially offshore in situations in which pipeline dirt and oil are coming down the pipe—requires ultrasonic transducers to cope with a wide range of acoustic impedance.
Installation effects can also influence ultrasonic meter uncertainties. Upstream piping (elbows, tees, abrupt changes, various other swirl generators) that causes the fluid flowing through the line to become non-uniform can cause a calibration shift and/or distortion in the flow signature (velocity profile and swirl angle). A non-representative sample is then measured by the ultrasonic path(s) to yield measurement uncertainty. Multipath meters help read such flow distortions appropriately, with some designs doing a better job than others for various reasons. Coriolis meters claim that distortions in flow profiles do not affect meter accuracy except in very extreme situations.
Meter manufacturers offer options to alarm and/or correct for these conditions. It remains to be seen how successful these are. In any event, the safest procedure is to make sure the ultrasonic meter is kept clean.
General Maintenance of Liquid Meters
The oil and gas industry meters are proven on a schedule set by the contract, company policies, or government requirements. In every case, these provings are the basis for initiating maintenance and/or proof of meter accuracy. All proving should be carefully run with witnesses from the contracting parties being present. Both parties to the proving should be trained and knowledgeable about proving requirements as specified in the API standards. The standards are the basis for contractual requirements for the exchange of the liquids. The provings must be run correctly to establish meter accuracy and thus control the correct billing for custody exchange. The provings become a legal document in case of a meter settlement lawsuit. (Such provings for gas measurement are more often the exception rather than the rule. The throughput test is the basis for accurate liquid metering.)
The proof of accurate metering is the balance between liquids into and out of the system adjusted for inventory changes of liquid in the system. Most often the balances are quite close on a well-measured system, but a running balance must be kept that will indicate any changes occurring in the system. These balances should be kept on a given time period such as day, week, month, or year. Shorter-term balances will show more excursions but are useful for spotting troubles and initiating maintenance before the system accuracy is lost beyond some agreed upon percentage of total deliveries. A typical target balance is between 0.1 and 0.25%. To a degree, the value chosen reflects the complexity of the system and control of maintenance practices. Pipelines use loss allowances to offset the financial loss due to the uncertainties of the liquid pipeline measurement. In a system that is handling hundreds of millions of dollars worth of liquids, an allowance of only 0.25% (a common value used) can result in millions of dollars of lost revenue; vigorous effort should be invested to keep measurements correct so the lost revenue will be as close to zero as possible.
Tracking system balance reports are usually reported on control charts that display visually the gain and loss of a system. They determine the stability of the system and show any trends or step changes in the balances. They are the basis for initiating studies to improve performance. This performance evaluation, a detailed review of proving and maintenance reports to spot any troubled meter stations, should include a study of:
Personnel: how properly trained and committed;
Procedures: how well API requirements are met;
Facilities: built how close to API standards;
Equipment: operating in proper range;
Calibration: done correctly and on proper schedule;
Piping: no leaks or improperly operating valves;
Computer/calculation: correct programs and data correctly used; and
A completion of the study should point out any troubled stations and what needs to be changed in their operation and maintenance to improve their accuracy.
Specific Liquid Maintenance Problems
In addition to the straightforward maintenance problems of metering systems covered so far, there are unusual problems that can be experienced in special instances.
Stabilized crude oil is crude stored at atmospheric pressure to allow light-end components to be reduced over time. Stabilizing crude oil minimizes the possibility of two-phase flow resulting from light ends breaking out in the metering system. Pressure and temperature correction factors in the ASTM/API tables for reducing liquid measurement from flowing to standard pressures and temperatures are based on stabilized crude. Use of these factors on unstabilized crude can produce a significant error. Thus, trying to measure two-phase flow with conventional meters and using correction factors incorrectly should be avoided.
Waxy crude, crude oil with high percentages of wax, can create problems if the “wax point” temperature is reached. This is a particular problem when the temperature is variable in a system; for example, a North Sea system normally operated 30°F above the wax point, because of the well production temperature. A multiple turbine meter prover system operated well for a period of time, but suddenly the meter factor tests gave highly erratic results for all the turbines.
The turbines were removed for inspection, but nothing untoward was found. After repeated provings, the turbine metering was resumed. Again the values became erratic. The operator removed the meters for inspection. This time there was a light coating of wax on all meter parts in contact with the crude. This meter system was located at a central platform, below which one million barrels of oil were stored in the cold North Sea. This storage was used as an emergency reserve when pipeline operating problems occurred and only occasionally used for delivery. The length of time that the crude stayed in storage varied. Proving became erratic after crude was delivered from the storage after it had been held for some time. When warm crude was returned to the meter, the deposited wax was melted. This caused the on-again, off-again erratic meter factors.
The problem was solved by the meter specialist knowing that meter and prover systems would not act erratically unless something had occurred. In this case, normal maintenance found nothing, but the combination of knowing performance characteristics and personnel persistence paid off by finding the problem, even though it was transient as the wax deposits came and went.
Another unusual proving and turbine meter installation with confusing results occurred at two multiple turbine stations that were located on either side of a prover. One set of meters proved as expected, but provings for the other set (using the same prover) would not repeat. To study the problem, a meter from one station was exchanged for a meter from the other station. The provings showed that the meter that was good became erratic, and the bad meter became good in its new location. Both stations were mirror images of each other and were built to the API standards by the same manufacturer. Once again, the meter specialist knew that there had to be some difference that was related to the specific locations.
On further study, it was noted that the two stations fed from one pipeline with one elbowed off to the right and the other elbowed to the left. So the inlet piping was 180° different as it entered the station headers. In reviewing this, one station had an upstream piping that caused the flow to swirl clockwise and the other counterclockwise. Both stations had proper lengths and straightening vanes. The solution suggested was to put in doubled length vanes. When this was done, the provings in the bad station became repeatable.
The purpose of these three examples is to point out that the guidance for maintenance in the API standards is a good base, but intelligent analysis of the meter system may also be required to get the best flow measurement.