From Theory to Practice
Although standards are written to be theoretically accurate and completely instructive, many decisions must be made in actual flow measurement. This chapter points out that “ideal” installations seldom, if ever, exist in the real world, so allowances must be made for the non-ideal characteristics and the measurements should be evaluated accordingly. Very few measuring stations measure an absolutely pure and clean stream of constant composition. Flow pressure and temperature normally change with time, if not continually. Space is often limited. These limitations affect the measurements obtained.
The chapter discusses the effects of pressure, temperature, and composition ranges on a meter, and the difference between accuracy and uncertainty. It considers the practical limitations of the principles of fluid mechanics that meters use to arrive at a value of flow from the fluid’s transport properties.
Keywords
fluid mechanics; standard; accuracy; uncertainty; pressure; temperature; composition; meter; flow
A standard by definition is:
A document, established by consensus, which provides for common and repeated use, rules, guidelines or characteristics for activities or their results, aimed at the achievement of an acceptable degree of order in a given context.
It is written to be theoretically accurate and completely instructive. However, between a standard and the actual flow measurement, many decisions must be made. It is the application and use of the standard that becomes important. For example, ANSI/API 14.3/AGA Report No.2, Part 2, latest revision provides a table (2-8B) with installation requirements for a “meter tube” (the adjacent upstream and downstream piping attached to the meter). If 29D or more of upstream piping is used as the design basis, the meter meets standard requirements for all beta ratios except 0.75 (Figure 5-1).

However, for a specific meter station with space limitations and known maximum volumes, shorter meter tube lengths may be acceptable. It would be desirable to have the records reflect that such a meter tube was designed for a specific set of circumstances, so that the future users of the tube will be aware of the limitation and not expect it to be a universal length.
In process plants where a tube has defined flow limits that usually will not change, reduced tube lengths are more common than they are in the oil and natural gas industry; an upstream length of 29D is a fairly standard universal length for ANSI/API 14.3/AGA Report No. 3, Part 2, latest revision, although tube length may be even longer in some applications.
The standard’s lengths were arrived at by empirical tests, which indicated that shorter lengths caused the coefficient tolerance to exceed the stated limit. Therefore, designs can be made to minimum limits, but the designer should allow some safety factor by using longer lengths. The interpretation that a design is specified by the standards is not true; the standard simply establishes minimum limits. In other words, each standard is written on the basis of limits rather than design specifics.
Those using the standards may not fully understand this subtle difference between “what it says” and “what it means as interpreted by industry design, application, and use.” It is worthwhile to seek out these practical interpretations to reach the best design and minimize uncertainty. (Further discussion of accuracy versus uncertainty will follow in this chapter.)
Ideal Installations
An “ideal” installation is a worthy objective for a meter station. However, seldom, if ever, does such an ideal station exist in the real world. Deviation from ideal starts when meter manufacturers define their meter uncertainties based on the best possible conditions for use—and these conditions are often not reached in actual use, nor are they standardized from one manufacturer to another. The result is that a user should insist on a full and complete disclosure of uncertainty data derivation to make a legitimate comparison between meters from various manufacturers.
Likewise, a user may not take into account all flow peculiarities (such as dirt or pulsation present) not allowed for in the manufacturer’s data. It is important for the user to know, and the manufacturer to be informed of, as much of the expected flow application information as possible, in order to derive meaningful uncertainty values for a specific application.
An ideal meter station would be one in which pressure, temperature, and flow are stable—both long and short term—changing less than several percent. The fluid should be clean, of non-changing composition, and with no pulsation. Ample installation space should exist for the required straight meter tube lengths upstream and downstream. Duplicate instrumentation with automatic switchover to standby units in case of primary equipment failure should be included. Instrumentation should include automatic transducer testing, and sufficient periodic maintenance should be planned to reconfirm the meter’s uncertainty. Records should be kept to define any outages or anomalies occurring at the station. And meter data should be transferred automatically to the billing or other department with all volumes involved reviewed and accepted by everyone concerned.
Seldom does such an ideal station ever exist in real flow measurement. Therefore, allowances must be made for the non-ideal characteristics and the measurements should be evaluated accordingly.
Non-Ideal Installations
In most cases, requirements for real installations are non-ideal. Very few measuring stations measure an absolutely pure and clean stream of constant composition. Truly clean fluids exist only in designer’s minds, so fluid treatment or a meter cleaning system must be provided. Most flowing streams have variable flow rates that must be allowed for in instrumentation selection and measurement system design. And monthly inspection may or may not be frequent enough in dirty flowing conditions. Flow pressure and temperature normally change with time, if not continually. Space is often limited, so required inlet and outlet lengths may have to be compromised. These non-ideal conditions can cause considerable increases in uncertainty, and may well determine design considerations.
Station purchase, installation, and operation/maintenance costs should, but sometimes do not, reflect what the station will be used for—custody transfer, “company use,” line/process control, etc. The standards’ requirements are not created by considering station uncertainty resulting from noncompliance; they are written so that their requirements are the minimum necessary to produce desired measurement uncertainty.
Data on installation requirements are part of the background from which each standard is written. If additional knowledge is desired with respect to a standard’s application to a particular design, applicable references should be reviewed. Otherwise, the standards take no position on possible uncertainty values from each design deviation.
Fluid Characteristics Data
In addition to the flow measurement standards issued by various organizations, related data for fluid characteristics can be found in various other references. For example, pressure/volume/temperature (PVT) data are available in the Manual of Petroleum Measurement Standards. In addition, the American Society of Testing Materials (ASTM), American Chemical Society (ACS), and National Institute of Standards and Technology (NIST) have pertinent data. Also, universities, as part of advanced-studies programs, have published many correlations of selected fluids.
In each case, the data are based on specific parameter limits of pressure, temperature, and composition ranges. These limits should be known and the data should be used within them, since extrapolations may seriously compromise measurement uncertainty. Equations of these correlations for similar products should also be used carefully; results may not agree because of data uncertainty limits. Each industry uses “accepted data.” From time to time, these data are updated on the basis of additional work. The quality and limitations of all such work must be determined before the results are used for good system design.
Limitations of Uncertainty
As previously mentioned, of all the questions brought up at a gathering of flow measurement personnel, the most frequently asked and the least satisfactorily answered is, “What is a meter’s accuracy?”
It is an unfortunate fact of life that the one-upmanship often practiced in both the purchase and sale of flow measurement devices may obscure actual meter performance. To adequately define the problem, the following areas of interest must be considered before any discussion is meaningful:
2. Design of equipment and technical limitations;
3. Manufacturers’ adherence to proper techniques when controlling the manufacture of the precision device;
4. Installation of the equipment in such a way as to maintain the manufacturing tolerance;
5. Operation of the station in a manner to produce the best measurement uncertainty;
6. Maintenance required for getting long-term measurement performance;
Definition of Accuracy
You have seen the term “uncertainty” used in the preceding pages. What is the difference between accuracy and uncertainty? For many decades, accuracy was the term most commonly used to describe a meter’s ability to measure flow. It was defined as the ratio of indicated measurement to true measurement. This sounds quite reasonable until an attempt is made to define and demonstrate true flow. Some definitions of “true flow” have included:
1. What the recording chart from an orifice meter says;
3. What the government agency says;
An obvious weakness in each definition is the way that it allows a wide variety of answers. Testing by many individuals, manufacturers, research firms, and standards groups has added a large body of information—but not all the results are in agreement. The flow measurement industry had no acceptable statement of exactly how indicated and true values should be obtained or compared. In recent years, a more useful concept has been used: uncertainty. This is defined as a statement of twice the standard deviation of a statistically valid test sample population. This in itself is not an absolute statement of what a given meter will do; it simply states how it will do in some 95% of the cases compared to “the most probable value” as determined by ideal tests.
The test procedure is not specified. The investigator—whether an industry body, a manufacturer, or a governmental agency—sets the test conditions. Results may appear “correlated” when fluid is measured once. In industry, however, fluid is normally measured twice: once in and once out of a system. Differences then become apparent.
The second area of caution relates to the accuracy or uncertainty of a meter system compared to a primary measuring device. The user is interested in overall system accuracy (i.e., how good is the volume from the system readout), not statements about individual parts—and particularly not a statistical statement based on full-scale accuracy reading of the transducers of a system when measurements are typically not at 100% of range. Without this understanding of the background of the “accuracy numbers game,” it is difficult to evaluate statements about a meter’s uncertainty made by users and manufacturers.
Most of the numbers that come up in a discussion of flow accuracies are supplied by sources other than the one with the most critical data: the user under actual field conditions. The user, then, should be aware of all pertinent factors involved so that a meaningful estimate of likely field measurement accuracy can be made. Properly used flow meters of all types are capable of accuracies that fit in certain categories of proper application. It is the responsibility of those using such meters to fit the meters to actual needs properly.
Design and Technical Limitations
All flow meters use the principles of fluid mechanics to arrive at a value of flow from the fluid’s transport properties. Each of these principles has technical as well as practical limitations. For example, the orifice meter is one of a category of meters that requires a pressure drop larger than the pressure drop in normal piping for proper measurement. If insufficient pressure drop is available for measurement, then a head meter cannot be used accurately. This statement seems self-evident; however, users sometimes apply an orifice meter with only a few inches of water differential and still want “accurate” flow measurement. Similarly, an ultrasonic meter that senses velocity must sense an accurate average velocity in relation to a known hydraulic area of the meter opening, or else there is no way to calculate accurate volumes. This means a proper profile must be presented to the meter, and it must be kept clean (Figures 5-2–5-5).


In general, all flow devices are subject to the following limitations, as documented in standards or manufacturers’ literature. Ignoring these considerations means that any statement of accuracy is meaningless:
• Reynolds number sensitivity;
• Special piping requirements (flow profile dependency);
• Practical rangeability limits;
• Acceptable calibration data;
• Accurate measurement of several variables to arrive at standard volume;
By coordinating the desired measurement with the above information and relevant standards and/or manufacturer’s data, intelligent decisions can be made regarding the possible accuracy that can be expected for a given installation.
The Reynolds number, covered previously, relates how one fluid flow behaves in relation to other fluids with the same number. Meters are affected to a larger or smaller degree depending on the specific meter’s response to the flowing Reynolds number. Reynolds number sensitivity should be checked when considering a meter for a given job.
Pulsating flow presents a problem for most flow meters. Whenever a designer suspects that pulsation will be present, the meter must be installed with pulsation eliminators between the source of pulsation and the metering device. Work carried out with most commercially used metering devices indicates that virtually no meter is immune from the effects of pulsation.
Piping requirements and flow profile interrelate. Piping adjacent to the meter run can help create a proper, fully developed flow profile. As previously mentioned, the lengths specified by various standards are the minimum required, and any additional straight pipe will simply add confidence that the measurement is not affected.
Meter manufacturers should—and most do—control all design variables found to affect development of the proper flow profile. However, the care that a manufacturer puts into a meter is useless if proper installation, operation, and maintenance procedures are not followed by the user.
Any installation with meter tube lengths less than those required by standards or manufacturer requirements will result in unpredictable performance and hence should not be used without an in-place calibration.
Measurement with minimum uncertainty will usually occur at the upper range of a meter. Any physical location where measured variables tend to be stable will be better than those where wide fluctuations occur. Measurement will be aided by regulating pressure, stabilizing temperature, and ensuring consistent flow-stream composition.
Once again, standards or the manufacturer’s recommended guidelines should be followed for establishing tolerance in the manufacture of meter tubes.
The way that the primary element is attached to the meter tube is important. For example, fabrication should begin with properly selected pipe or meter run tubing. Heat from welding can cause distortion at critical points, so unless proper welding techniques are used, a unit that will assure the minimum uncertainty cannot be produced.
The meter and adjacent piping must be properly aligned. If gaskets are used, they should be undercut by approximately 1/8 inch to prevent an extrusion of the gasket into the line when bolts are tightened. Seemingly insignificant items of this nature cannot be overlooked if minimum uncertainty is desired from the primary measurement device.
As previously noted, recommendations concerning the upstream and downstream piping of a meter tube are covered quite thoroughly in standards and manufacturers’ literature. No attempt will be made here to duplicate this coverage, other than to emphasize again that meter tube lengths for all measurement conditions will be best obtained by using the extreme conditions as the design standard minimum (Figure 5-6).

Gauge lines are also important. On differential devices in which the primary element is designed and installed to give an accurate differential at the taps, proper lead lines must also be installed to ensure the inherent minimum uncertainty of the primary device.
Several considerations in the design and installation of these lines for gas measurement must be noted. For gas measurement applications, taps should come off the top of the line, or at least no more than 45 degrees from the vertical of a gas measuring line. The connecting lines should have a diameter of at least 3/8 inch, be as short in length as convenient, and have no direction or diameter changes, in order to minimize leaks and pulsation effects. They should be installed with an upward slope away from the line of at least 1 inch per foot of tubing length, with the differential device located above the line. This facilitates drainage of any condensable fluids back into the line.
The presence of liquid blockage in sections of these gauge lines can cause bias in the order of the equivalent head of water (an inch of water is equal to an inch of differential bias). All gases at flowing temperatures above ambient with pressures near condensation have this problem.
Natural gas saturated with water poses the same problem, even though natural gas itself may not condense. A cold night or a cold rain can cause the entire gauge line and instrument to fill with fluid; then, on warm up, the fluid will evaporate. During this time the instrument indication will be biased in determining rate or total flow. This is more critical for a differential transducer than for a static pressure device; however, the installation suggestions above will minimize problems for both devices.
For liquid applications, the lines should come off the bottom half of the pipe, preferably at 45 degrees from the bottom to prevent solids from filling the line and blocking the differential device. The purpose of the installation is to keep the connecting lines full of liquid even though there occasionally may be gas going down the flow line with the liquid. If a liquid is likely to be heated above its vaporization point by the ambient temperature, then some type of insulation should be installed to control the temperature and maintain the liquid leg in the lead lines.
The flow profile, the pattern or “flow signature” (the combination of velocity profile, swirl, and turbulence) at the meter inlet, is very important for accurate measurement. Two factors control this pattern:
a. The piping configuration—including length, roundness, and smoothness—and the nearest pipe fitting such as elbows, valves, tees.
b. Reynolds number (see Chapter 2)—which is the guide to the shape, size, and stability of the inlet pattern.
Fortunately, most gas is handled at relatively high Reynolds numbers (above 10,000), so that the internal viscous forces are seldom a major component of the predominant inertial forces. A high Reynolds number range is one in which the flow pattern is easily stabilized, provided that the piping is properly installed.
Liquids can have a range of Reynolds numbers depending on their viscosity. A liquid that has a higher viscosity than water should be checked to make sure its Reynolds number is higher than is required for the particular meter. Some meters are specifically designed to operate at high viscosity where the Reynolds numbers are low.
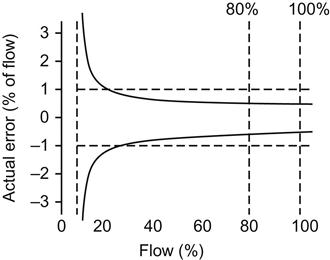
Practical rangeability limits vary with the meter and measurement conditions. A single meter has a limited range for the accurate flow determination, and both the high and low extremes of this should not be approached. It is important to examine a meter’s response at very low flow rates carefully. An application’s rangeability can be extended by the use of multiple meters in situations where wide variations in flow are experienced and minimum uncertainty is required over the full flow range (Figure 5-7).

A head meter, as the name implies, requires the sacrifice of some pressure, which is of little significance in most fluid measurement, but can be a severe limitation at low operating pressures.
The current standards limit the orifice meter run inside diameter size to 2 inches minimum and 30 inches maximum. Likewise, smaller sizes (as low as 1/4 inch diameter) may be used with special designs, but they are not covered by oil and gas industry standards. Larger sizes are also not covered in standards but are used on the basis of extrapolated data. Turbine meters are available in different limited sizes from various manufacturers, with the largest meter made in the United States presently limited to 12 inches in gas applications and 24 inches in liquid applications. European manufacturers make larger gas turbine meters. Rangeability for turbine meters typically runs from about 10 to 1 on liquid meters and on low-pressure gases. For high-pressure gases, a range to more than 100 to 1 is normal. For positive displacement (PD) meters the rangeability depends on the make of meter, and runs from about 20 to 1 to as much as 1,000 to 1 on both liquids and gases.
If a meter’s performance is stable and repeatable, its rangeability may be extended by characterizing its performance electronically.
Standard calibration data depend upon measurements collected over time. Some meters are fully covered by industry standards that have evolved over many years. Calibration data for them have been tested many times. Newer meters have to go through a period of acceptance, and testing normally starts with data supplied by the manufacturer and accepted by the user for non-custody transfer metering.
The supplied coefficients must be carefully evaluated, and checks must made frequently on new meters. Once sufficient experience has been gained and data made available, standards organizations will run their own tests (or accept tests made by others) and prepare a standard.
The industry usually accepts either source of calibration data but will be more cautious about using data from new meters when custody transfer measurement is involved. Standards typically take from five to ten years to complete from the date of development of a meter.
Single phase flow exists in most practical measurement situations. The flow pattern is affected by the presence of two-phase flow, and density is difficult to determine for a non-homogeneous fluid. There are some approximating methods for measuring two-phase flow with head meters, but the resulting data are not precise. The Coriolis meter can measure two-phase flow over limited ranges. There are some new multiphase meters currently being developed to measure three-phase streams (water, oil, gas), but at the time of publication of this book these are just beginning to be used.
Measurement of the other variables needed to derive an accurate standard volume (at “base” conditions) requires attention and understanding equal to that involved with the primary device. The overall accuracy of the flow meter begins with the primary device, but it is also dependent on the transducers necessary to obtain the flowing density either directly with a densitometer or indirectly—through measurement of pressure, temperature, compressibility, and relative density—to convert flowing conditions to base conditions.
Density
As noted, accurate calculation of standard volume through a meter requires knowing the fluid density at the meter and proper interpretation of the measurement through use of appropriate equations to reduce the flow to base conditions (Figure 5-8).
In the past, this calculation of the density from flowing conditions was “standard.” Today instruments that can measure density directly are commonly used. A density measurement is needed at flow-sensitive points, such as at the plane of the orifice-plate bore or at the rotor in a turbine meter. A densitometer may be installed in a less sensitive location provided correction or control of the variables is made to arrive at the correct density from the remote location. In cases where a gas chromatograph is used, this can provide density data.
In any event, it is important to always keep in mind that the end product sought is the actual density at the measuring point.
Differential Pressure
Two of the major sources of error in the application of a head meter come from taking the square root of the differential measurement and from the effects of small errors in low differentials, which can cause large errors in flow data. For example, an error of 0.5 inches at 100 inches represents a 0.23% error of flow, at 75 inches it is a 0.33% flow error, but at 10 inches it creates a 2.5% flow error.
Good practice to achieve high accuracy dictates that the differential be kept as high as possible within the strength limitations of the primary device, and the range of flow fluctuation should be limited to the differential measuring device range (Figure 5-9).

Temperature
Errors in temperature measurement have a small effect on head meter flow accuracies; for most gases, there is an 0.1% error in flow rate per degree Fahrenheit. For non-head meters, temperature errors cause measurement errors twice as large as this.
For liquids, the effects of temperature are much smaller, except for those that are 40% or more less dense than water.
Relative Density (Specific Gravity)
An 0.001% error in reading the relative density of a 0.6 natural gas will cause an error of about 0.1% in flow measurement with a head meter; this can introduce fairly large errors in gases with changing compositions, unless the measurement is integrated into the volume calculation rather than averaged over a time period. This factor also enters into the “accuracy” statement of an orifice meter as a secondary factor in determining the compressibility factor. Relative density only affects the compressibility determination for non-head meters and it does not enter as a direct correction.
For liquids, corrections for the effect of temperature and pressure are related to the measure of relative density or composition and must be used in calculations (Figure 5-10).

Gas Compressibility
The compressibility factor of natural gas (which corrects for the ratio of actual volume to ideal volume) is roughly an 0.5% correction in volume per 100 psi of pressure for an orifice meter under normal pressure and temperature conditions. Hence, an error of several percent in the compressibility factor only produces a small error in volume. However, if the gas is near its critical point, correction factors of as much as 225% are required, and small errors in measured variables (temperature and pressure) are reflected as large errors in volume. These values are doubled for non-head meters.
Likewise, gases with large concentrations of non-hydrocarbon gases in their compositions are not as difficult to calculate as accurately, since new data are available from the AGA on these mixtures. Some of the theoretical values obtained by the pseudocritical method (based on the mixture composition) have shown errors of several percent when compared with empirically determined test data on the same gas. This problem becomes more pronounced as the percentage of methane is reduced. If the value of the product handled is sufficient, then actual compressibility tests are recommended to confirm that the calculated data complies with the tolerances required.
Liquid Compressibility
The compressibility factor of a liquid is usually ignored. However, at a flowing temperature within 75% (approximately) of the absolute critical temperature of petroleum, it must be considered.
If a specific weight device (commercially referred to as a densitometer) is used, calculation of flow rate is simplified and the number of error sources is reduced. Assuming an accurate device, the mathematical calculation of flow can be improved and the tolerance reduced. The usual four variables—temperature, pressure, relative density, and compressibility—are reduced to density (if mass is being measured), or density and base relative density (if volume is the desired measurement unit).
In each of the cases cited where there are errors in the measured variables, these arise from two sources:
1. Measurement of the variables.
2. Interpretation of the measurement for conversion to a mass or volume by calculation using the appropriate flow formula (Figure 5-11).

Recording and Calculating Data
Recording and calculating data are the final steps in obtaining accurate flow measurements. All secondary devices must be calibrated against a recognized standard. Likewise, when metering devices are exposed to widely varying ambient conditions, calibrations should be made that cover the ranges encountered; if the effects are large enough, consideration should be given to controlling the environment in which the secondary devices operate by adding a housing with cooling and/or heating. The development of new, smart transducers has given the user another option to take care of the problem—but at a higher initial price than for standard transducers. However, the smart transducers are more stable and require less maintenance. A balance between the accuracy required and the cost of obtaining it will determine the extent to which you can justify testing and purchasing smart transducers versus installing housing (Figure 5-12).

Measured data must be either recorded or transferred to a central calculation office for flow rate conversion, or this can be calculated directly by computer equipment installed at either location. Each step of recording or transducing and interpreting adds potential sources of error to the flow measurement. A simpler system with proper maintenance is usually found to yield the best results and optimum return on investment.
One of the most serious problems with the use of new types of recording and calculation equipment is the failure of manufacturers and users to recognize that proper personnel training is needed to get accurate measurements with the equipment. Anyone who buys or sells without extensive training in the use of equipment that is “different” or “strange” can be assured that, at worst, the equipment will turn out to be “no good,” and at best, that there will be a time period before enough familiarity is gained to allow the equipment’s capabilities to be realized.
Summary
By following the guidelines in this book and the provisions of the standards, along with recommendations from manufacturers and users regarding similar applications, primary elements can be selected that will offer the best possible accuracy in any specific measurement installation.
Any overview of accurate flow measurement should contain a discussion about what kind of results can be obtained if all precautions are taken. Without full qualification of the data source and complete definition, accuracy statements are meaningless. Proof of accuracy usually comes down to a study of system balances of measured flow inputs versus flow outputs. Experience shows clearly that the only way that acceptable balances are obtained is by following all of the best (not good) practices in design, application, installation, operation, maintenance, and interpretation (Figure 5-13).

There is no such thing as absolutely accurate flow measurement.
Measurement is always performed to some limit of accuracy. The purpose of any flow measurement should be to measure as accurately as possible within pertinent economic constraints. For a “flow purist,” measurement should be completely accurate; but for a commercial flow-system designer, the cost relative to measurement accuracy and system maintenance must be considered. Since flow measurement has a tolerance within budget limits, the designer’s function is to minimize this tolerance so that the investment for better accuracy can be demonstrated as desirable.
It is very important that the accuracy is reaffirmable during flowing conditions, so that full confidence in the flow metering system can be enjoyed over extended time periods. An equally important consideration is that the accuracy is actually reaffirmed on a scheduled basis.
A final note should be added on this balance between accuracy and system cost. The law of diminishing returns for flow measurement says that beyond some point, additional expenditure will not buy any provable better measurement (Figure 5-14).