The Code Coverage functionality keeps track of which objects and which lines of code have been executed by your own session since you started and stopped the coverage. We used this feature extensively in combination with the debugger to find and fix bugs and also to investigate how certain features work in Dynamics NAV.
Incomprehensibly, this functionality is no longer available as a standard feature in Dynamics NAV 2013. Doing some quick research on the Internet, we found a blog post written by Carsten Scholling on the German NAV Dev elopers Blog. The blog post is titled Pimp your NAV 2013: Code coverage upgrade in 30 minutes (http://blogs.msdn.com/b/german_nav_developer/archive/2012/08/26/pimp-your-nav-2013-code-coverage-in-30-minuten-nachr-252-sten.aspx). Carsten has developed his own Code Coverage page. In this section, we will show you how to include this feature in your Dynamics NAV, and how it works.
We have provided a file containing the Code Coverage objects that Carsten published on his blog. The file is called CodeCoverage.txt. Follow these steps in order to import the objects in to your Dynamics NAV environment.
- Open the Microsoft Dynamics NAV development environment.
- Click on File and then on Import. Select the
CodeCoverage.txtfile and click on Open. - Find Page 50020 and Page 50021, and select them.
- Objects imported from the
.txtfile are not compiled. Therefore, click on Tools and then on Compile.
Follow these steps in order to use the Code Coverage feature in the small example we have been debugging: creating a new bank account.
- From the Microsoft Dynamics NAV development environment, find page
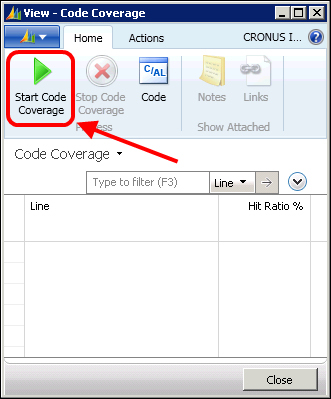
50020, go to Code Coverage, and click the Run button. - The Code Coverage page will open. Click on the Start Code Coverage option as shown in the following screenshot:
- Open the Bank Accounts page, and click on the New option in order to create a new bank account. On the Bank Account Card page, click on enter to let the system give you a number from the number series configured for bank accounts.
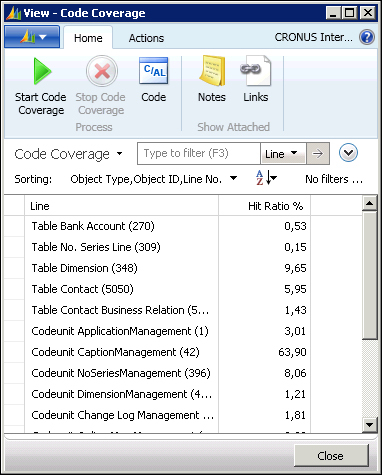
- Go back to the Code Coverage page and click on the Stop Code Coverage option. A list with all the objects used since you started the code coverage will appear as shown in the following screenshot:
- Select the Table Bank Account (270) line and click on the Code option found on the action pane.
- The Code Coverage Code page will open, showing all the code of the selected object:

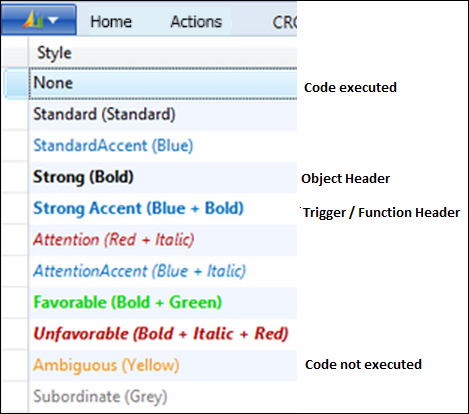
Note that different lines are shown in different styles. Each style has its own meaning. The following screenshot shows the meaning each style has in the Code Coverage feature, for Dynamics NAV 2013
- To see the code of all the objects, and not the selected object only, you can remove the current filter from the Code Coverage Code page.
- To only see executed code, you can add the following filter to the Code Coverage Code page:

You are free to use the Code Coverage feature whenever you find it useful. In this section, we will give you some tips on when we find it useful. We have used the Code Coverage feature in the following cases:
- On large transactions; to find where a particular field is modified, a record is inserted, a function called, and so on.
We have found that using breakpoints is a good feature to debug only the code you need to follow. Especially in large transactions, where a lot of statements need to be executed before the program flow reaches the part you want to examine. But what if you have no idea where to place your breakpoint?
On the Code Coverage Code page, you can remove all filters to see the code of all objects. Then add a filter to see the executed code. Next add a new filter on the Line column to find the code you are looking for.
For example, if we want to find where Document No. is assigned during the sales posting routine, we can set the following filters and get the following result:
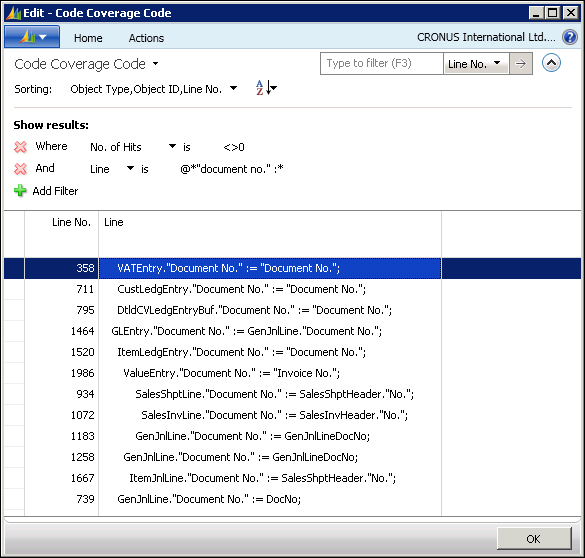
This gives us an idea about where to place breakpoints, where to start debugging and how a certain area works. This would be very helpful if we wanted to develop any feature regarding document numbers, or if we were finding a bug regarding the document numbers.
Let your imagination flow, because you can find any kind of information just by changing the filter of the Line column.
- With respect to permission setup, setting permissions on Dynamics NAV is a tedious task. To give permissions to a user to only perform certain tasks, you need to give the user permissions to all the objects that the task uses.
Code Coverage is the perfect feature to help you determine all the objects used on a particular task. Just start Code Coverage, perform the task, and then go back to the Code Coverage page to get a complete list of all the objects that the user will need permission for.
We have seen two cases where the Code Coverage feature is useful. We are pretty sure that many people use Code Coverage for many other reasons. Just start using it while developing and we are pretty sure that you will find it very helpful.
We have never used it to track objects' usage, but it could work. If you could just start Code Coverage each time a session starts, track all the objects used, and save it in some kind of log, you would be able to see statistics of object usage that could be very helpful in making certain decisions.