Debugging in Dynamics NAV 2013 has never been this easy. With the release of Dynamics NAV 2013, we can find a brand new debugger that offers the developers tools that they did not have before. Conditional breakpoints or debugging other users sessions are very nice features that will make debugging an easy job.
The debugger starts from the Dynamics NAV development environment. The user with which you are logged in must be assigned the SUPER permission set. Go to Tools | Debugger | Debug Session.
If you did not have a company open, the system will prompt you to select a company as shown in the following screenshot:

If you already had a company open in the development environment, the system will skip this step. However, you can manually change the company by clicking on File and then going to Company | Open.
The Session List page will open as shown in the following screenshot:

Note that the page shows all sessions on the current database from all companies. This means that it doesn't really matter what company you select from the Dynamics NAV development environment.
The session you select can be any of the following:
- A RoleTailored Client session
- A Microsoft Dynamics NAV Portal Framework for Microsoft SharePoint 2010 session
- An OData Web Services session
- An SOAP Web Services session
- An NAS Services session
- A background session started by using the
STARTSESSIONfunction.
Place the cursor on the line corresponding to the session you want to debug and then click on the Debug button from the ribbon bar. You can select your own session or any other session from any other user. You can also click on the Debug Next option, to debug a session that is not on the session list. The next session can be a session of any client mentioned before.
The user won't be able to work with his/her session while you are debugging; so, whenever possible, open your own session and debug your session. If you cannot reproduce the bug because of user setup conditions, debug the session of the user that is encountering the problem but remember to warn him/her.
The Debugger page will now open as shown in the following screenshot:
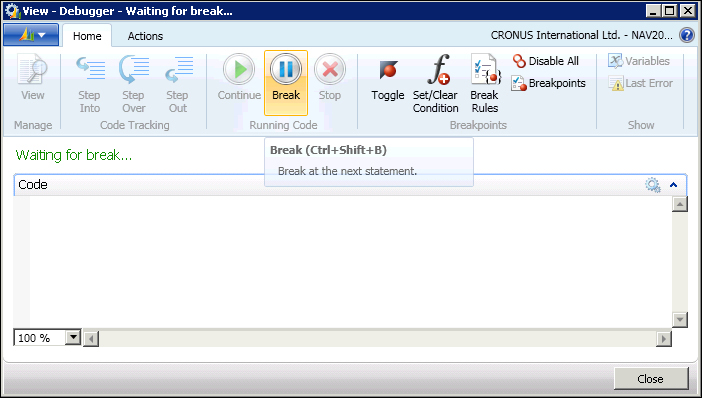
Note that the Code area is blank. You can still work with the session you have selected, but no code appears on the debugger. There are two options to actually start to debug code:
- Place a breakpoint on an object and wait until the session reaches the breakpoint. The Placing breakpoints section of this chapter explains how to do this.
- Click on the Break icon on the ribbon bar. The debugger will stop on the next line of code that the session executes.
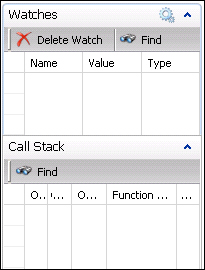
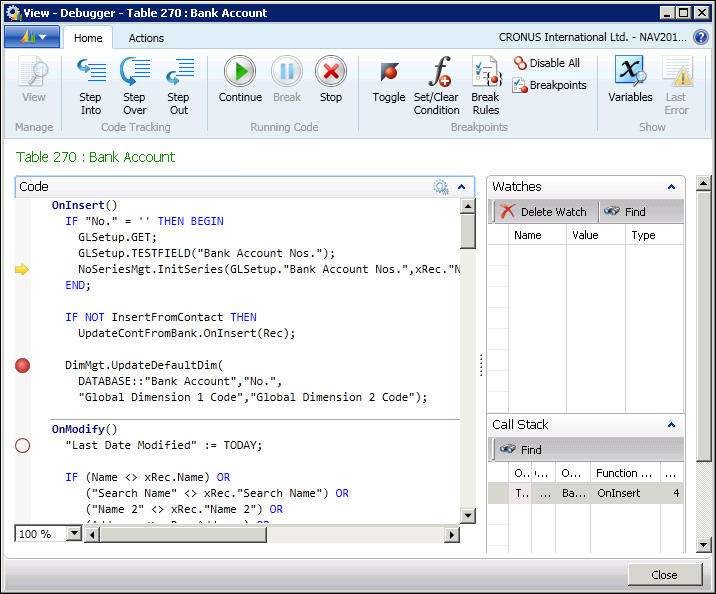
You will notice that in the Debugger page you can only see the Code area, but you are missing two important parts that you will need to debug. The Call Stack FactBox is a list that shows the functions and triggers that are currently active. The Watches FactBox will allow you to select variables to see their current value.
Follow these steps to enable those options:
- Click on the Dynamics NAV icon at the upper-left side of the page, and then go to Customize | Customize This Page… as shown in the following screenshot:

- On the left side, select the FactBoxes option. From the Available FactBoxes lists, select Watches and click on the Add >> button. Do the same with the Call Stack option. Click on OK.

- The system warns you that you will have to reopen the Debugger page for customizations to take effect. Click on OK, and then click on Close to close the Debugger page.
- From the Session List page, select the session you want to debug, and click on the Debug icon. The Debugger page will open again, with the Watches and Call Stack FactBoxes on the right-hand side of the page, as shown in the following screenshot:
This can be considered as the debugger setup. From the Debugger page, click on the Break Rules icon found on the ribbon bar. The Debugger Break Rules page opens as shown in the following screenshot:
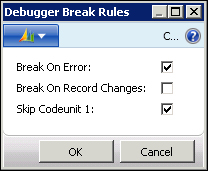
In Dynamics NAV 2013, you can find three basic options on the debugger feature:
- Break On Error: If the debugger is set to break on errors, it breaks execution both on errors that are handled in code and on unhandled errors. By default, the debugger is set to break on errors.
- Break On Record Changes: If the debugger is set to break on record changes, it breaks before creating, modifying, or deleting a record. Therefore, the debugger stops on any of the following statements:
INSERT,MODIFY,MODIFYALL,DELETE,DELETEALL.By default, the debugger is not set to break on record changes.
- Skip Codeunit 1: Many of the triggers in codeunit 1 Application Management are not important for debugging a business scenario. This is due to the fact that they are seldom important for debugging and because the codeunit 1 triggers are called frequently in the application. So you can specify that the debugger skips all code in codeunit 1. If you skip codeunit 1, when you break on the next statement the debugger does not break on code in codeunit 1. It continues until the first line of code after codeunit 1. In addition, when you step through the lines of code, the debugger does not step into code in codeunit 1. If you skip codeunit 1, you also implicitly skip all code that is called from codeunit 1.
If you explicitly set a breakpoint in codeunit 1 or in code that is called from codeunit 1, the debugger breaks execution when it hits the specific breakpoint, regardless of whether you have selected the setting to Skip Codeunit 1.
By default, the debugger is set to Skip Codeunit 1.
If the debugger is set up to break on error, the best way to determine the cause of a runtime error is to disable all breakpoints and click on Continue. The debugger will automatically stop the execution of the code when it encounters an error.
A breakpoint is an intentional stop or pause placed in an object. It is a mark that you can set on a statement. When the program flow reaches the statement, the debugger intervenes and suspends execution until you instruct it to continue. During the interruption, you can inspect the environment or start a line-by-line code execution.
There are several ways of placing and removing breakpoints. This section will show you all the different ways so that you can choose the one that best suits your debugging needs.
From the Microsoft Dynamics NAV development environment, select Table 270 Bank Account and click on the Design button to open the Table Designer window. Then press F9 or click on View, C/AL Code to open the C/AL Editor.
Place the cursor on one statement, a line of code, and press F9. A red bullet will appear on the left-hand side of the statement. Press F9 again; the bullet is now a white bullet. Press F9 again and the bullet disappears; you have removed the breakpoint.
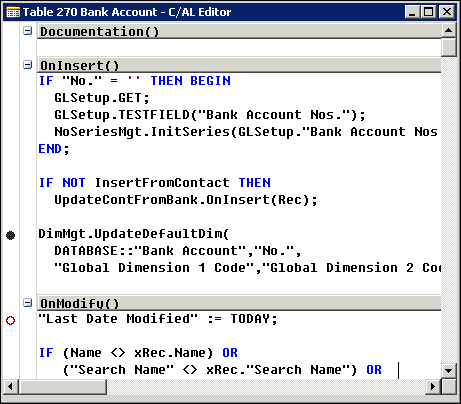
The red bullet indicates that a breakpoint is enabled for that statement. The debugger will stop when the program flow reaches the statement.
The white bullet indicates that a breakpoint was placed before, but it is now disabled. This means that the debugger will not stop on that statement.
With the debugger on, place the cursor on one statement, a line of code, and press F9. A red bullet will appear on the left-hand side of the statement. Press F9 again; the bullet is now a white bullet. Press F9 again and the bullet disappears. You have now removed the breakpoint.
Instead of pressing F9, you can also use the Toggle icon found on the ribbon bar, as shown in the following screenshot:
Red and white bullets indicate the same breakpoints as explained in the last section. This means that you can place breakpoints from the Object Designer window or from the debugger with the same effect.
The only difference is that breakpoints placed from the Object Designer window are seen from the debugger, but breakpoints placed from the debugger cannot be seen from the Object Designer window.
The end of each function contains a blank statement where you can also place a breakpoint. If you do so, the execution flow will stop right after all the code on the function has been executed and right before returning to the calling function. This is something we could not do in the previous versions of Dynamics NAV.
You can place a conditional breakpoint in Dynamics NAV. The debugger will only stop the execution if the program flow reaches the breakpoint and the condition is true. Otherwise, the execution continues.
The condition can include any variables or fields that are currently in scope of the following types: BigInteger, Boolean, Code, Decimal, Integer, Option, Text, WideText.
Place the cursor on the statement where you want to place the conditional breakpoint, and the click on the Set/Clear Condition icon found on the ribbon bar. The following page will now open:

Write your condition using any of the supported operators: =, <>, <, >, <=, >=. Then click on OK to go back to the debugger.
On the left-hand side of the statement, a red bullet with a white cross inside will appear. This indicates that the statement has a conditional breakpoint.
From the debugger breakpoint you can view, set, enable, disable, or delete breakpoints. You can also set, modify, or delete conditions for the breakpoints.
From the Debugger page, click on the Breakpoints icon found on the ribbon bar to open the Debugger Breakpoint List window, as shown in the following screenshot:

On the ribbon pane of the page, you will find options to create new breakpoints and to enable or disable the existing ones. You can also modify the Condition column of any existing breakpoint.
When the debugger stops the execution of the program flow, you have four options to continue the execution. You can find those options on the ribbon pane of the Debugger page, as shown in the following screenshot:

The following is a description of each of the options available to continue execution:
- Step Into: Click on the Step Into icon or press F11, to execute the current statement. If the statement contains a function call, execute the function and break at the first statement inside the function.
- Step Over: Click on the Step Over icon or press F10, to execute the current statement. If the statement contains a function call, execute the function and break at the first statement outside the function.
- Step Out: Click on the Step Out icon or press Shift + F11, to execute the remaining statements in the current function and break at the next statement in the calling function.
- Continue: Click on the Continue icon or press F5, to continue until the next break.
Let's see an example of each execution mode: the insertion of a new record on the Bank Account table. We will use the same example for all the four options.
Our "Step Into" execution starts with the first statement of the OnInsert trigger of the Bank Account table. The yellow arrow (in the following screenshot) shows the line that is currently going to be executed:
If you press F11 repeatedly, you will see how each statement is executed. Four statements later, we find a function call. The debugger then stops on the first statement of the InitSeries function. A few statements later we find a new function call, and the debugger goes to the first statement of the GetNextNo function.
Using these options, the debugger stops on each and every single statement. If you keep on debugging this example, you will see that after pressing F11 310 times and visiting 28 functions and triggers, the new bank account will get inserted.
Try to avoid this option unless you don't know what you are looking for and you have no other option than executing all the statements one by one, especially for long transactions.
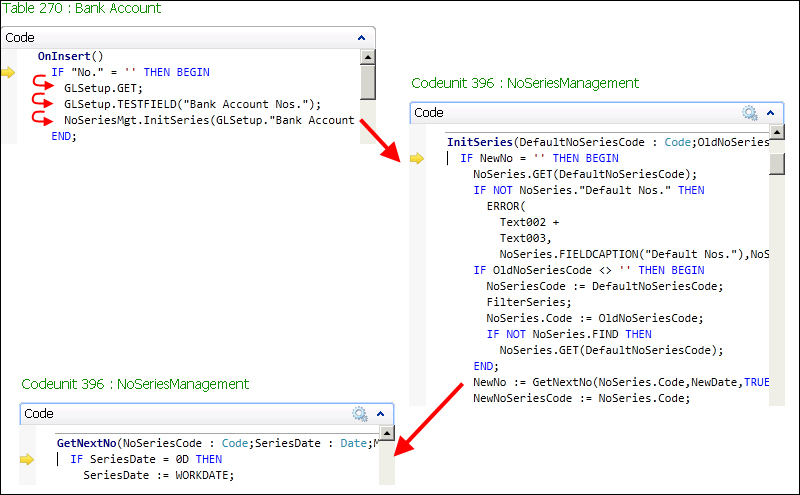
In the last section, we have used the Step Into option until we reached the first statement of the GetNextNo function. We will continue debugging from that point, but using the Step Over option.
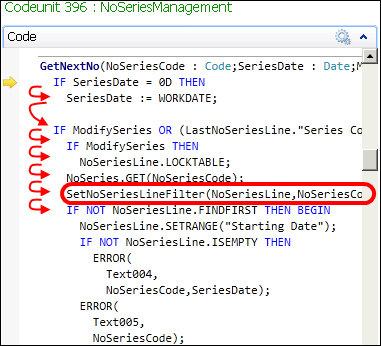
If you press F10 a few times, you will see that the debugger stops on each statement, just as the Step Into option does.
The seventh statement of the function is a call to the SetNoSeriesLineFilter function. If you use the Step Over option on that statement, the debugger will execute all the code inside the function without stopping and will stop on the first statement after the function call. That is, the next statement in the current function.
Use this option when you already know the code that executes inside the function and you know that the function that is going to be called does not contain the bug you are looking for.
In the last section, we have used the Step Over option until we reached the first statement after the SetNoSeriesLineFilter function call, which is the GetNextNo function. We will continue debugging from that point, but using the Step Out option. Please refer to the following screenshot before proceeding:
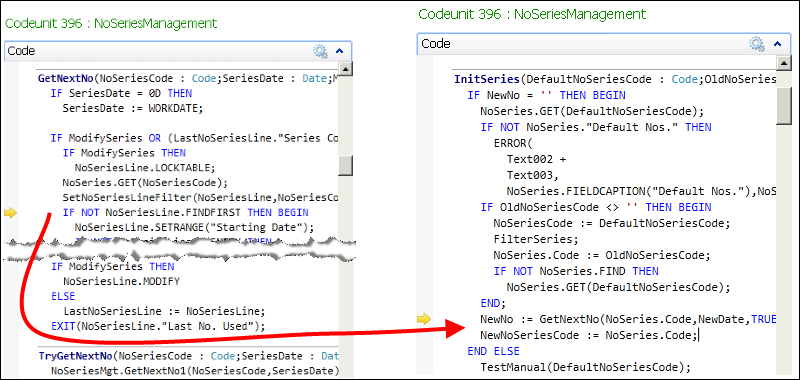
The Step Out option executes all the statements in the current function, and stops on the first statement of the calling function.
We are now on the GetNextNo function that was called from the InitSeries function, as we have seen in the The Step Into option section. If you click on the Step Out option, the debugger will execute all the remaining statements in the GetNextNo function, including the statements inside the new function call. After that, the debugger will stop on the next statement of the calling function, the InitSeries function.
Use this option if you have stepped inside a function to see its code and variables but, once inside the function, you have realized that the bug you are looking for is not there.
In the last section, we have used the Step Out option until we reached the next statement after the call of the GetNextNo function. We will continue debugging the code from that point, but using the Continue option.
With the Continue option, the execution of the code continues until:
- A breakpoint is reached
- We click on the Break option again
- An error occurs
Now, click on the Continue option on our example and see what happens.

In the Code part of the debugger, we keep seeing the code we had before the Continue option was clicked. But the yellow arrow that showed us the current line is not there anymore. At the top of the previous screenshot, we can read that the debugger is now waiting for a break.
The execution of the code has continued, a new bank account has been created, the user gets back the control of the execution, and the debugger is waiting for a new breakpoint.
You can use this option if you don't need to follow the code line by line and want to wait for a breakpoint instead. You also can use this option if an error occurs on a process and you want to know where the error occurs. In this case, you can turn on the debugger, reproduce the process that is causing the problem, and use the Continue option to let the debugger find the line causing the error. Of course, you will need the Break on error option enabled. You can read the Break rules section for more information about this option.
The Call Stack FactBox shows the active functions of the current execution. The Call Stack FactBox gives us information about the function that is currently on execution, and also from where this function has been called.
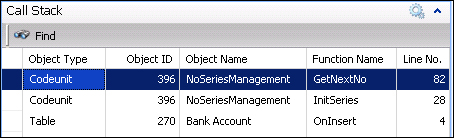
In the preceding screenshot, we can see the call stack corresponding to the code execution which we were analyzing in the Step Into option.
We started debugging on the OnInsert trigger of the Bank Account table. We used the Step Into option until we reached a call to the InitSeries function. With this, we kept using the Step Into option until we reached the GetNextNo function. The The Step Into option section stopped there.
And this is exactly what we see on the Call Stack FactBox.
The top line shows us the current function, while the bottom line shows the first function from where we started debugging. It also gives us valuable information, such as the object that contains the functions that are executed.
You can select any of the lines of the Call Stack FactBox. We have selected the bottom line. Now you can see that the Code area of the debugger changes, showing the code of the line selected on the Call Stack FactBox.

Note that a green arrow shows us the last statement executed before the execution flow jumped to a new function.
We can now place a new breakpoint on the function, as can be seen a couple of statements after the green arrow.
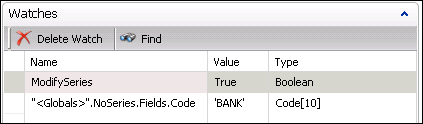
The Watches FactBox is used to view the values of variables. You can select some variables from the Debugger Variables List window and add them to the Watches FactBox. Those variables will be shown until you delete them, even if they run out of scope. If this happens, the text <Out of Scope> will be displayed in the Value column of the Watches FactBox. All the variables added to the Watches FactBox persist between debugging sessions.
There are two ways to add a variable to the Watches FactBox:
- From the Debugger Variable List window
- From the code viewer.
To add variables from the Debugger Variables List window, follow these steps:
- On the Debugger page, click on the Variables option found on the Actions pane. The Debugger Variable List page will open as shown in the following screenshot:
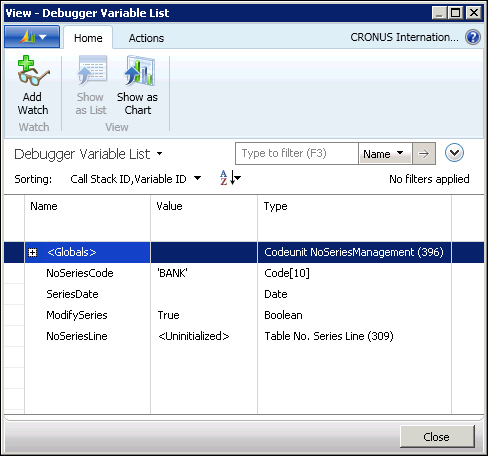
- Select a variable from the list and click on the Add Watch icon. Then click on the Close button.
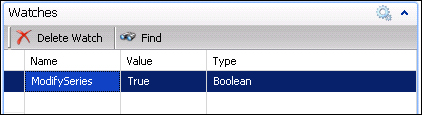
- Back on the Debugger page, you will see the selected variable on the Watches FactBox. You can view the name of the variable, its value, and its type as shown in the following screenshot:
To add variables from the code viewer, follow these steps:
- In the code viewer, hover the mouse pointer over the variable that you want to watch, or select it as shown in the following screenshot:

- A data tip appears, as you can see on the preceding screenshot. Click on the watch icon found on the left-hand side of the data tip (the glasses with a green plus symbol).
- The variable will now be shown on the Watches FactBox as shown in the following screenshot: