
Report development is completely different from what it used to be. The report development experience changed in Dynamics NAV 2009 with the introduction of Report Definition Language Client-side (RDLC) report, but it changes again with the actual release of the application.
With Dynamics NAV 2009, RDLC-based reports were introduced, but reports were still compatible with the classic definition of reports in Dynamics NAV. RDLC reports were actually based on the classic definition of the report.
With Dynamics NAV 2013, the reports classic definition has disappeared and only RLDC-based reports are available. This is why the report development experience has changed again. It now resembles the development experience of pages, queries, or XMLPorts.
Creating reports includes designing both the business logic that covers the kind of information the report will contain, and the layout that deals with how the report will look when it is printed.
In Microsoft Dynamics NAV 2013, to design a client report definition (RDLC), you design the data model with Report Dataset Designer and the layout with Visual Studio Report Designer. To do this, Visual Studio 2010 Professional or above is required.
Visual Studio Report Designer offers several new options and features. Furthermore, due to its thorough integration with Microsoft SQL Server, it is possible to take advantage of the reporting capabilities of Microsoft Report Viewer, including the following:
- Richer formatting
- Interactive sorting
- Graphics and charts
- Export possibilities (PDF, Microsoft Office Excel, and Microsoft Office Word)
A report object is composed of a report dataset and a visual layout. You design a report by first defining the dataset and then designing the visual layout. Report objects also contain properties, triggers, code, and an optional request page.
The following diagram shows components of a report and how they are related in Microsoft Dynamics NAV 2013.

Reports in Dynamics NAV 2013 are executed in two steps, which reflect the two steps in the report design. The first data set design in C/SIDE followed by report layout design in Visual Studio.
- The C/AL runtime retrieves the data from the involved source tables, performs necessary calculations, and combines the data in a single flattened dataset. This is performed by the NAV server.
- The produced dataset is transferred to the report viewer's runtime hosted on the NAV client, which, in turn, renders the dataset data according to the report layout definition.
The dataset is defined on the Report Dataset Designer in the Microsoft Dynamics NAV development environment. The report dataset is built from data items and columns. A data item is a table. A column can be one of the following:
- Field in a table
- Variable
- Expression
- Text constant
Typically, data items correspond to fields in a table. When the report is run, each data item is iterated for all records in the underlying table with an appropriate filter defined.
When a report is based on more than one table, you must set relations between the data items so you can retrieve and organize the data. In Report Dataset Designer, you indent data items to establish a hierarchy of data items and control how the information is gathered.
For example, to create a report that displays a list of customers and lists the sales orders that were placed by each customer, you must define the following data items:
- A data item that corresponds to the
Customertable - A data item that corresponds to the
Sales Linetable
You indent the second data item, which is the Sales Line table. As the report works through the records in the Customer table, it finds each customer's sales orders by examining the records in the Sales Line table.
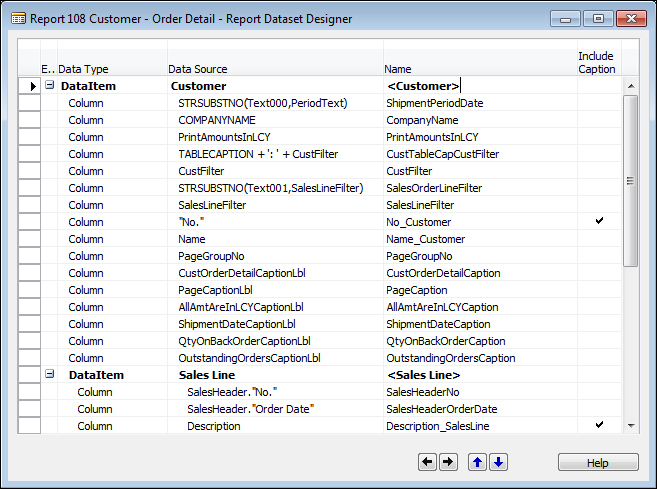
The following screenshot shows the dataset definition of Report 108 Customer – Order Detail:
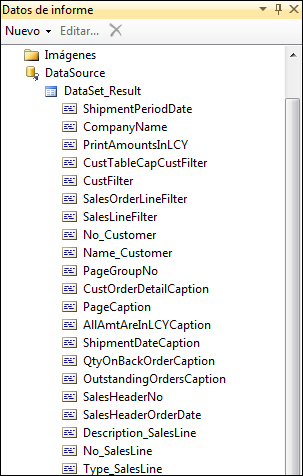
And this is how the dataset looks on Visual Studio:
You build the visual layout of a report by arranging data items. A report that is displayed or printed must have a client report definition (RDLC) layout. You use Visual Studio Report Designer to design the RDLC layout. Microsoft Dynamics NAV 2013 supports RDLC 2008. You generally display most data in the body of a report, and you use the header to display information before any data item record is displayed. For example, you can display a report title, company, and user information in the header of a report.
With Visual Studio Report Designer, you can add useful features to your report layouts, such as:
- Links from a field on a report to either a page or another report
- Images and graphs
- The ability to toggle columns so you can hide or display data
- The ability for users to interactively change the column on which data in the report is sorted
- The ability to display RTF text
A report in Visual Studio always has exactly one body, and it is not possible to add more than one. Optionally, it can have one page header and one page footer. Extra headers or footers cannot be added.
When the report runs, it first runs the page header, then the page body, and then the page footer. It will not run the page body for each record. Looping through records is done by using a data region in the body section.
However, now it is possible in RDLC2008, in the page header sections, to work with data fields. This is different from RDLC2005 that was used to define RTC reports in Dynamics NAV 2009.
Reports use a variety of report items to organize data on a report page. The design surface is not what you see is what you get. The report items have an initial layout position that can change when the report is processed. The following list describes typical uses for different report items:
- Textbox – It is used on titles, date stamps, and report names.
- Table, Matrix – It is used to display tabular data from a report dataset. Table and matrix are templates of a Tablix data region and provide a starting grid layout for data from a report dataset.
- Chart – It is used to graphically display data from a report dataset.
- Gauge – It is used to present a visual image for a single value within a range of values.
- List – It is used to create free-form layout, such as the forms on a webpage.
- Image – It is used to add existing images to a report.
- Line – It uses lines as graphical elements.
- Rectangle – It can be used as a container for other report items. Rectangles are often used to help control how report items appear on a report page when the report is rendered.
The following screenshot shows the layout definition of the 108, Customer – Order Detail report:

The RoleTailored client report works with a flattened dataset. This means that data from multiple tables is joined before it is sent to the client.
In the Report Dataset Designer, there can be multiple data items that might or might not be indented. Depending on the indentation and relations between data items, a resultset is generated at runtime. This resultset is the result of the flattening of the indented data items into a two-dimensional resultset.
The rules for flattening data can be described as follows:
- Reports with one data item – This corresponds to a single
SELECT Column FROM Tablestatement. The result can be displayed in the body section. - Reports with indented data items – This is similar to the following SQL statement:
SELECT Column FROM Table A INNER/OUTER JOIN Table B ON Table A.Column = Table B.Column.
If
PrintOnlyIfDetailis set toTrueon the parent, anINNER JOINis used. IfPrintOnlyIfDetailis set toFalseon the parent data item, anOUTER JOINis used. The resulting set can then be displayed using grouping and filtering. - Reports with multiple data items on the same level – This is similar to a UNION statement. Again, grouping and filtering can be needed to display the correct records. The difference with a UNION statement is that both data items will have different fields and a different number of columns. Actually, it is more like a concatenation of multiple resultsets.
When working with flattened datasets, the result of queries will be one single dataset containing information from multiple tables. Once the dataset is available, the dataset can be processed using filtering and sorting and the report can be rendered.
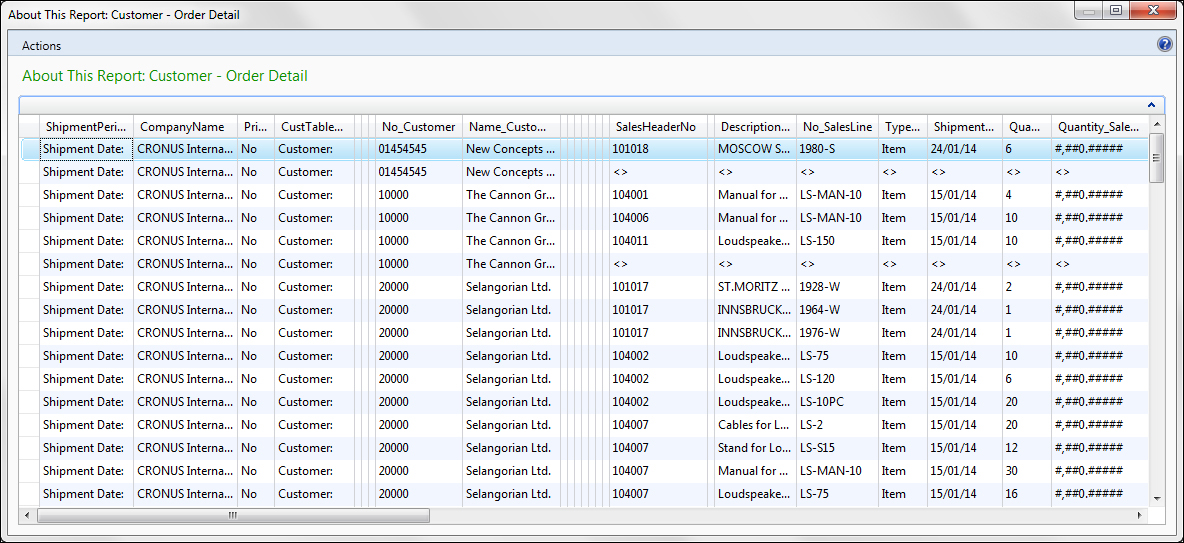
The following is the result of the flattened dataset when report 108, Customer – Order Detail is run:
Designing reports with Visual Studio brings you many possibilities and options to define the report look and feel. You could be creative and use a new look and feel each time you create a new report, but it will be time consuming and you might confuse the end users. It is much easier, both for developers and users, to have reports with similar look and feel.
These are the general guidelines and recommendations regarding the user interface of Dynamics NAV 2013 reports. All standard reports follow these guidelines.
|
Report title | |
|---|---|
|
Attribute |
Value |
|
Font |
Segoe UI 14 pt Bold |
|
Cell height |
20 pt |
|
Cell padding |
left: 5 pt, right: 5 pt, top: 0 pt, bottom: 0 pt |
|
Text alignment |
Document reports: Right and All other reports: Left |
|
Other text in the header | |
|---|---|
|
Attribute |
Value |
|
Font |
Segoe UI 14 pt Regular |
|
Cell height |
10 pt |
|
Cell padding |
left: 5 pt, right: 5 pt, top: 0 pt, bottom: 0 pt |
|
Space to body | |
|---|---|
|
Attribute |
Value |
|
Height |
20 pt |
|
Headers in the body | |
|---|---|
|
Attribute |
Value |
|
Font |
Segoe UI 8 pt Bold |
|
Cell height |
10 pt |
|
Cell padding |
left: 5 pt, right: 5 pt, top: 0 pt, bottom: 0 pt |
|
All other text | |
|---|---|
|
Attribute |
Value |
|
Font |
Segoe UI 8 pt Regular |
|
Cell height |
10 pt |
|
Cell padding |
left: 5 pt, right: 5 pt, top: 0 pt, bottom: 0 pt |
|
Line spacing | |
|---|---|
|
Attribute |
Value |
|
Height |
10 pt. Multiplication of 10s. (As a designer/developer, you can use your discretion to space the content). |
|
Table Header | ||
|---|---|---|
|
Number of row |
Attribute |
Value |
|
Row 1 (Title) |
Font |
Bold |
|
Vertical align |
Bottom | |
|
Height |
Up to 30 pt in height if required (allowed to be up to 3 lines) | |
|
Row 2 |
Height |
2.5 pt |
|
Border |
Bottom; black; solid | |
|
Width |
1 pt | |
|
Row 3 |
Height |
2.5 pt |
|
Row 4 (Text) |
Vertical align |
Bottom |
The output of the previous table is as follows:

|
Attribute |
Value |
|---|---|
|
Height |
10pt |
|
Cell padding |
left: 5 pt, right: 5pt, top: 0 pt, bottom: 0 pt (if row needs to be indented, add +10 pt to left padding) |
|
Vertical align |
Top (default) |
|
Cell colors | |
|---|---|
|
Type of report |
Value |
|
List reports |
Alternate BackgroundColor= mod 2, "WhiteSmoke", "White" |
|
Logo | |
|---|---|
|
Attribute |
Value |
|
Height |
40 pt |
|
Space below logo |
10 pt |
|
Attribute |
Value |
|---|---|
|
Numeric fields |
Right aligned (included header) |
|
Text fields |
Left aligned |
|
Numeric text |
Left aligned (for example, Customer No.) |
|
Date/time |
Left aligned |
|
Colors | |
|---|---|
|
Where |
Value |
|
Link |
Blue (no underline) |
|
Chart |
Palette: Bright Pastel |
Report 108, Customer – Order Detail has been designed following these guidelines. You can see the result in the following screenshot:
