
Chapter 6: Debugging Kernel Memory Issues – Part 2
Welcome to the second portion of our detailed discussions on a really key topic – understanding and learning how to detect kernel memory corruption defects. In the preceding chapter, we introduced the reason why memory bugs are common and challenging and went on to cover some really important tools and technologies to help catch and defeat them – KASAN and UBSAN (along the way, covering the usage of the newer Clang compiler).
In this chapter, we continue this discussion. Here, we will focus on the following main topics:
- Detecting slab memory corruption via SLUB debug
- Finding memory leakage issues with kmemleak
- Catching memory defects in the kernel – comparison and notes (Part 2)
Technical requirements
The technical requirements and workspace remain identical to what's described in Chapter 1, A General Introduction to Debugging Software. The code examples can be found within the book's GitHub repository here: https://github.com/PacktPublishing/Linux-Kernel-Debugging.
Detecting slab memory corruption via SLUB debug
Memory corruption can occur due to various bugs or defects: Uninitialized Memory Reads (UMR), Use After Free (UAF), Use After Return (UAR), double-free, memory leakage, or illegal Out Of Bounds (OOB) accesses that attempt to work upon (read/write/execute) illegal memory regions. They're unfortunately a very common root cause of bugs. Being able to debug them is a key skill. Having already checked out a few ways to catch them (the detailed coverage of setting up and using KASAN and UBSAN in the previous chapter), let's now leverage the kernel's built-in SLUB debug features to catch these bugs!
As you will know, memory is dynamically allocated and freed via the kernel's engine – the page (or Buddy System) allocator. To mitigate serious wastage (internal fragmentation) issues that it can face, the slab allocator (or slab cache) is layered upon it, serving two primary tasks – providing fragments of pages efficiently (within the kernel, allocation requests for small pieces of memory, from a few bytes to a couple of kilobytes, tend to be very common), and serving as a cache for commonly used data structures.
Current Linux kernels typically have three mutually exclusive implementations of the slab layer – the original SLAB, the newer and superior SLUB implementation, and the seldom-used SLOB implementation. It's key to realize that the following discussion is with respect to only the SLUB (unqueued allocator) implementation of the slab layer. It's typically the default in most Linux installations (the config option is named CONFIG_SLUB. It's found in the menuconfig UI here: General setup | Choose SLAB allocator).
Tip
Basic knowledge of the kernel memory management system, the page, slab allocator, and the various APIs to actually allocate (and free) kernel memory are a prerequisite for these materials. I've covered this (and much more) in the Linux Kernel Programming book (published by Packt in March 2021).
Let's quickly check out configuring the kernel for SLUB debug.
Configuring the kernel for SLUB debug
The kernel provides a good deal of support to help debug slab (SLUB, really) memory corruption issues. Within the kernel config UI, you'll find the following:
- General Setup | Enable SLUB debugging support (CONFIG_SLUB_DEBUG):
- Turning this on buys you plenty of built-in SLUB debug support, the ability to view all slab caches via /sys/slab, and runtime cache validation support.
- This config is automatically turned on (auto-selected) when Generic KASAN is on.
- Memory Debugging | SLUB debugging on by default (CONFIG_SLUB_DEBUG_ON is explained later).
Let's look up the kernel config for SLUB on my x86_64 Ubuntu guest running our custom debug kernel:
$ grep SLUB_DEBUG /boot/config-5.10.60-dbg02
CONFIG_SLUB_DEBUG=y
# CONFIG_SLUB_DEBUG_ON is not set
This config implies that SLUB debugging is available but disabled by default (as CONFIG_SLUB_DEBUG_ON is off). While always enabling it is perhaps useful for catching memory corruption, it can have quite a large (and adverse) performance impact. To mitigate this, you can – should, really – configure your debug kernel with CONFIG_SLUB_DEBUG_ON turned off by default (as seen here) and use the kernel command-line parameter slub_debug to fine-tune SLUB debugging as and when required.
The official kernel documentation here covers the usage of slub_debug in detail: https://www.kernel.org/doc/html/latest/vm/slub.html. We'll summarize it along with some examples to demonstrate how to use this powerful feature.
Leveraging SLUB debug features via the slub_debug kernel parameter
So, you'd like to leverage the slub_debug kernel command-line parameter! To do so, let's first understand the various option flags you can pass via it at boot time:
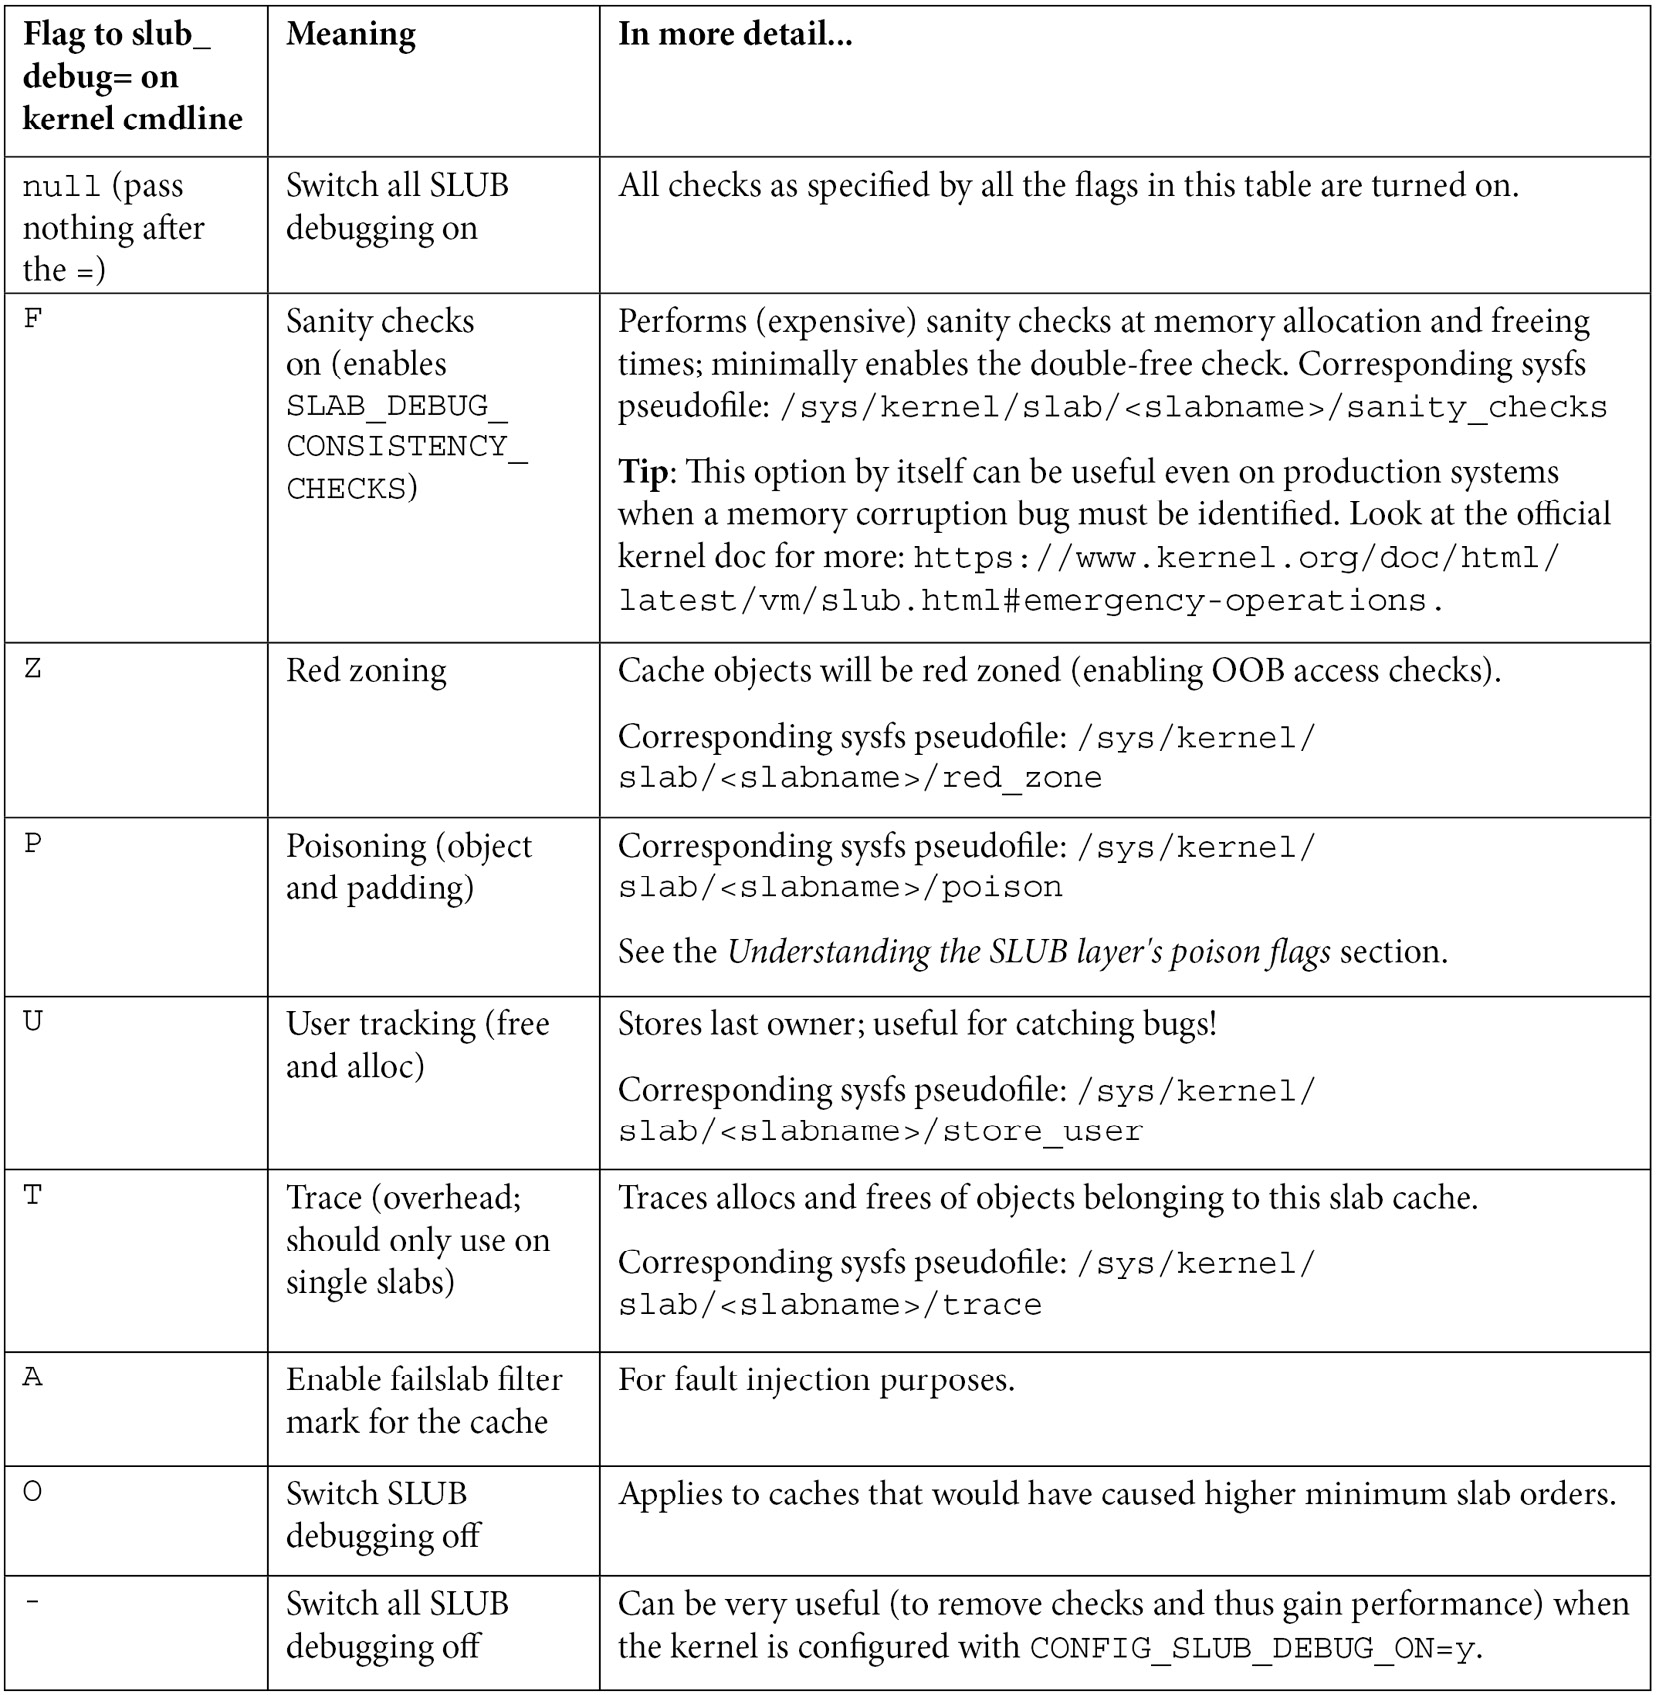
Table 6.1 – The slub_debug=<NNN> flags and corresponding sysfs entries if any
A brief description of pretty much every (pseudo) file under /sys/kernel/slab/<slabname> can be found in the kernel documentation here (a word of caution: it seems to be quite aged): https://www.kernel.org/doc/Documentation/ABI/testing/sysfs-kernel-slab.
Understanding the SLUB layer's poison flags
The poison flags defined by the kernel are defined as follows:
// include/linux/poison.h
#define POISON_INUSE 0x5a /* for use-uninitialised poisoning */
#define POISON_FREE 0x6b /* for use-after-free poisoning */
#define POISON_END 0xa5 /* end-byte of poisoning */
Here's the nitty-gritty on these poison values:
- When you use the SLAB_POISON flag when creating a slab cache (typically via the kmem_cache_create() kernel API) or set poisoning to on via the kernel parameter slub_debug=P, the slab memory gets auto-initialized to the value 0x6b (which is ASCII k, corresponding to the POISON_FREE macro). In effect, when this flag is enabled, this (0x6b) is the value that valid but uninitialized slab memory regions are set to on creation.
- The POISON_INUSE value (0x5a equals ASCII Z) is used to denote padding zones, before or after red zones.
- The last legal byte of the slab memory object is set to POISON_END, 0xa5.
(You'll come across a nice example of seeing these poison values in action a bit later in this section, in Figure 6.4.)
Our ch5/kmembugs_test.c code has the function umr_slub(). It employs the kmalloc() API to dynamically allocate 32 bytes and then reads the just allocated memory to test the UMR defect on slab (SLUB) memory. Here's the output when we run this test case (10 UMR on slab (SLUB) memory) on a regular kernel with no slub debug flags enabled:
[ 6845.100813] testcase to run: 10
[ 6845.101126] test_kmembugs:umr_slub(): testcase 10: simple UMR on slab memory
[ 6845.101771] test_kmembugs:umr_slub(): q[3] is 0x0
[ 6845.102203] q: 00000000: 00 00 00 00 00 00 00 00 00 00 00 00 00 00 00 00 ................
[ 6845.102946] q: 00000010: 00 00 00 00 00 00 00 00 00 00 00 00 00 00 00 00 ................
With no slub debug flags or features enabled, the uninitialized memory region (all 32 bytes of it) shows up as the value 0x0. You'll soon find that, when run with slub_debug turned ON, though no error report is generated, a dump of the memory region shows the poison value 0x6b, denoting that its a valid but uninitialized memory region!
Passing the SLUB debug flags
Any and all SLUB debug flags – those seen in the earlier table – can be passed to a kernel configured with CONFIG_SLUB_DEBUG=y (as ours are, both the custom production and debug kernels) via the slub_debug kernel parameter. The format is as follows:
slub_debug=<flag1flag2...>,<slab1>,<slab2>,...
As can be seen, you can pass various slub debug flags. Don't leave any spaces between them; just concatenate them together. To set all flags on, set slub_debug to NULL; to turn all off, set it to -. Any combination is possible; for example, passing the kernel parameter slub_debug=FZPU enables, for all slab cache memory, the following SLUB features:
- Sanity checks (F)
- Red zoning (Z)
- Poisoning (P)
- User tracking (U)
Confirm this after boot with the following:
$ cat /proc/cmdline
BOOT_IMAGE=/boot/vmlinuz-5.10.60-dbg02-gcc root=UUID=<...> ro quiet splash 3 slub_debug=FZPU
This is also reflected within the sysfs entry for the slab cache(s). Let's look up the slab cache kmalloc-32, which of course provides generic 32-byte memory fragments to any requester, as an example:
$ export SLAB=/sys/kernel/slab/kmalloc-32
$ sudo cat ${SLAB}/sanity_checks ${SLAB}/red_zone ${SLAB}/poison ${SLAB}/store_user
1
1
1
1
$
They're all set to 1, indicating they're all on (the default is typically 0 – off).
All right, no dawdling. Let's run our (relevant) test cases to see where the kernel's SLUB debug infrastructure can help us.
Running and tabulating the SLUB debug test cases
All test cases are in the (same) module here: ch5/kmembugs_test/kmembugs_test.c (as well as the companion debugfs_kmembugs.c). Here, as we're testing SLUB debug, we only run the test cases that pertain to slab memory. We'll test on our custom production kernel as well as the distro kernel itself. Why? This is because most distros (including the one I'm using here, Ubuntu 20.04 LTS) configure the kernel with CONFIG_SLUB_DEBUG=y. This is also the default choice within the init/Kconfig file where it's defined. (Another reason we don't test with our debug kernel is obvious – with KASAN and UBSAN turned on, they tend to catch bugs first.)
Importantly, to test, we'll boot the system by passing the kernel parameter as follows:
- slub_debug=-, implying it's off.
- slub_debug=FZPU, implying these four flags and the SLUB debug features pertaining to them are turned on for all slabs on the system.
Then run the relevant test cases via the test_kmembugs.ko kernel module and associated run_tests script for each of these scenarios. The following table summarizes the results.
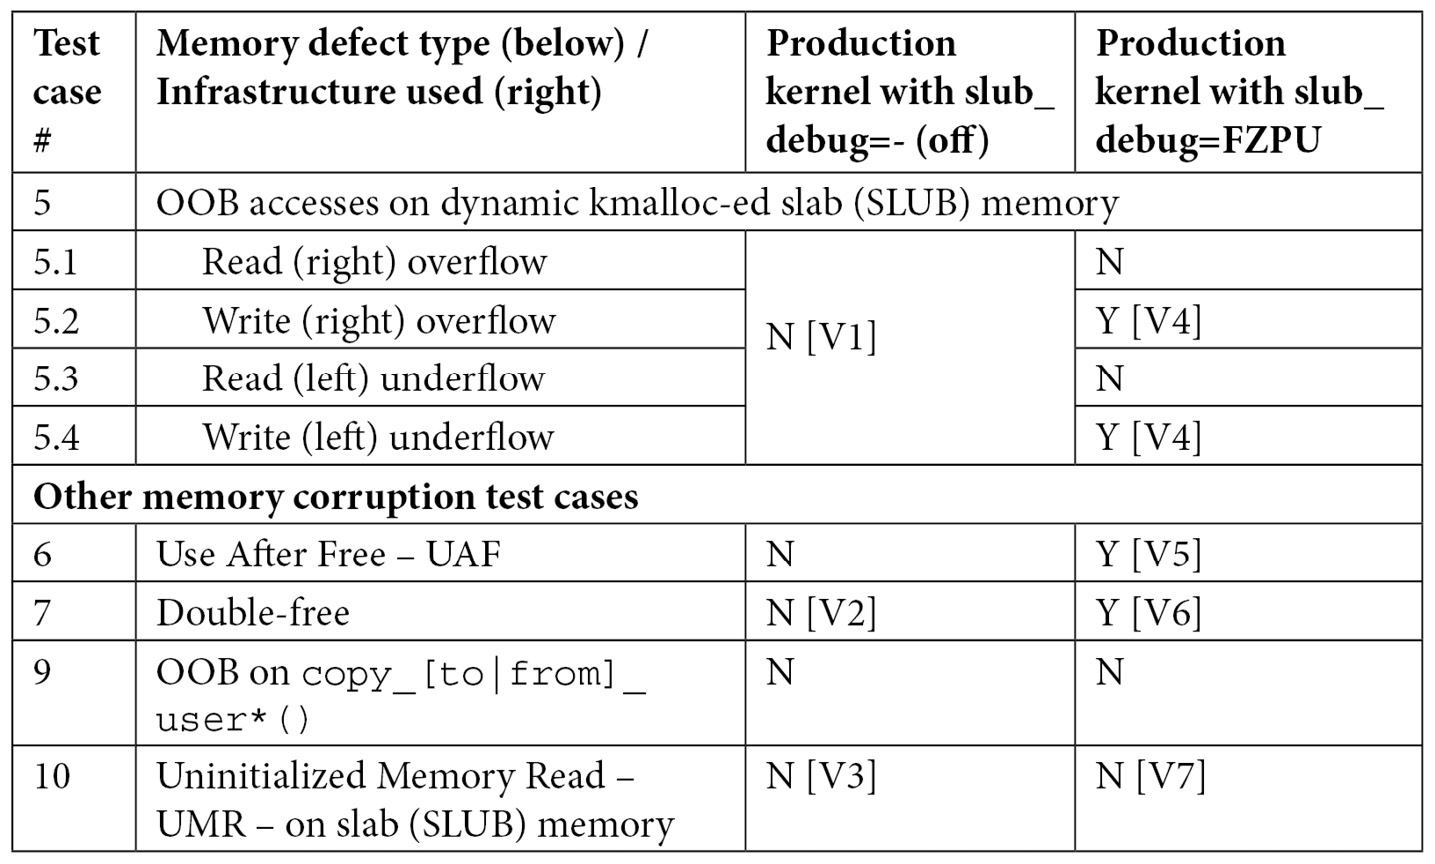
Table 6.2 – Summary of findings when running relevant memory defect test cases against both our production kernel without slub_debug features and with slub_debug=FZPU
As mentioned earlier, don't forget to also look at Table 6.4, effectively, an all-in-one-place comparison table.
Okay, now let's dive into the details of running our test cases seen in the previous table.
Test environment: x86_64 guest running Ubuntu 20.04 LTS with our custom 5.10.60-prod01 production kernel (configured as mentioned earlier).
Running SLUB debug test cases on a kernel with slub_debug turned off
First, let's look at what occurs when we run our test cases without SLUB debug features enabled (corresponding to column 3 and points [V1], [V2], and [V3] in Table 6.2):
- No memory bugs are caught when slub_debug=-, that is, is off (FYI, our first three test cases – the UMR, UAR, and memory leakage – fail to be detected as well).
- [V1]: The system could simply Oops or hang here or even appear to remain unscathed, but that's not really the case... Once the kernel is buggy, the system is buggy.
- [V2]: A segfault might occur on the double-free defect. The vanilla or production 5.x kernel indicates it like this:
kernel BUG at mm/slub.c:305!
And the instruction pointer register (RIP on the x86_64) will be pointing at the kfree() API. The report, of course, has the usual details – the process context the bug occurred in and the kernel call trace.
Interestingly, what's at line 305 in mm/slub.c? I checked on the mainline kernel version 5.10.60, here: https://elixir.bootlin.com/linux/v5.10.60/source/mm/slub.c.

Figure 6.1 – Partial screenshot of the excellent Bootlin kernel source browser
You can see we're bang on target: line 305 is what triggered the double-free bug. The vanilla kernel has the intelligence to detect this (naïve) case of a double-free, which is a form of memory corruption.
- [V3]: The UMR on slab memory with our production kernel and slub_debug flags set to - – implying it's off – isn't caught. The kmalloc-ed memory region appears to be initialized to 0x0.
Okay, let's move on now to testing with the kernel SLUB debug feature(s) turned on.
Running SLUB debug test cases on a kernel with slub_debug turned on
Now, let's rerun our test cases, this time with the kernel's SLUB debug features enabled by passing along the slub_debug=FZPU kernel parameter. Here's a screenshot showing setting the slub_debug=FZPU kernel parameter in the GRUB bootloader on the production kernel (as seen on VirtualBox):
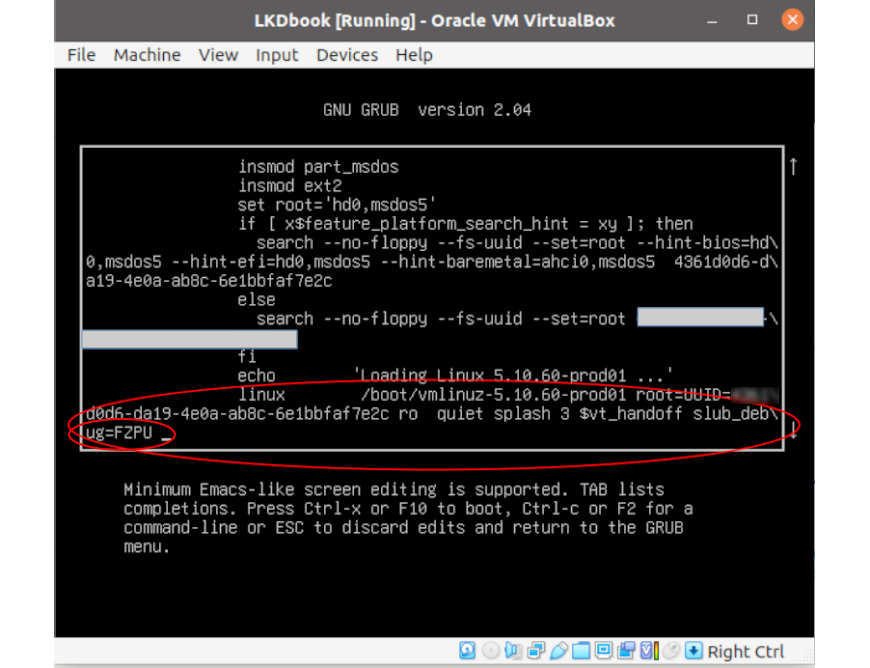
Figure 6.2 – The GRUB menu for editing the distro kernel parameters with the slub_debug=FZPU kernel parameter added
Verify that the kernel command line we edited via the bootloader has made it intact:
$ dmesg |grep "Kernel command line"
[ 0.094445] Kernel command line: BOOT_IMAGE=/boot/vmlinuz-5.11.0-40-generic root=UUID=<...> ro quiet splash 3 slub_debug=FZPU
It's fine; running cat /proc/cmdline will reveal the same. We run our test cases again, this time with SLUB debug enabled. The results are as seen in Table 6.2, in the fourth column.
Refer back to Table 6.2, noticing the places marked with [V4]. SLUB debug catches both the write over - and underflow (right and left) OOB accesses on slab memory. However, as we saw with UBSAN, it only seems able to catch it when the buggy access is via incorrect indices to the memory region, not when the OOB access is via a pointer! Also, the OOB reads do not seem to be caught.
Let's now learn a key skill: how to interpret the SLUB debug error report in detail.
Interpreting the kernel's SLUB debug error report
Let's look in detail at catching a few of our buggy test cases. We load up and use our run_tests script to execute them.
Interpreting the right OOB write overflow on slab memory
We begin with test case #5.2. The right OOB access, here the write overflow (right) on the slab object (marked as [V4] in the table), has the kernel's SLUB debug framework leap into action and complain quite loudly as follows:
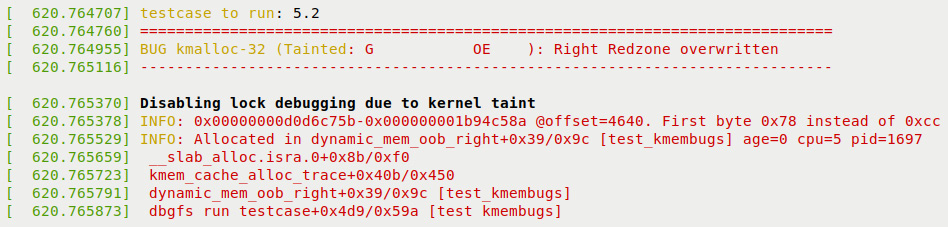
Figure 6.3 – Partial screenshot, 1 of 3, showing SLUB debug catching the right OOB while writing
First off, following the word BUG is the name of the affected slab cache (here, it's the kmalloc-32 one, as our test case code performed a dynamic memory allocation of, in fact, exactly 32 bytes).
Next, the kernel taint flags are followed by the issue at hand – the OOB access defect that caused the SLUB debug code to say Right Redzone overwritten. This is pretty self-explanatory – it's what actually did occur. Within our kmembugs_test.c:dynamic_mem_oob_right() test case function, we did just this: performed a write at byte 32 (the legal range is bytes 0 to 31, of course).
Next, the first INFO line spits out the start and end of the corrupted memory region. Note that these kernel virtual addresses are hashed here, for security, preventing info leaks. Recall that we ran this test case on our production kernel, after all.
Next, the second INFO line shows where the buggy access took place in the code – via the usual <func>+0xoff_from_func/0xlen_of_func [modname] notation. (Here, it happens to be dynamic_mem_oob_right+0x39/0x9c [test_kmembugs].) This implies that the defect occurred in the function named dynamic_mem_oob_right() at an offset of 0x39 bytes from the start of this function, and the kernel estimates the function's length to be 0x9c bytes. (In the next chapter, we'll see how we can leverage this key information!)
Further, the process context running – its PID and the CPU core it ran upon – is displayed to the right.
This is followed by a (kernel-mode) stack trace:
kmem_cache_alloc_trace+0x40b/0x450
dynamic_mem_oob_right+0x39/0x9c [test_kmembugs]
dbgfs_run_testcase+0x4d9/0x59a [test_kmembugs]
full_proxy_write+0x5c/0x90
vfs_write+0xca/0x2c0
[...]
We haven't shown the full stack call trace here. Read it bottom-up, ignoring any lines that begin with a ? . So, here, it's quite clear – the dynamic_mem_oob_right() function, located in the kernel module test_kmembugs, is where the trouble seems to be...
Next, the third INFO line provides information on which task performed the free. This can be useful, helping us identify the culprit as, typically, the task that frees the slab is the one that allocated it in the first place:
INFO:Freed in kvfree+0x28/0x30 [...]
The call stack leading to the free is displayed under this INFO: line as well. Note that this who-freed information may not always be available or accurate though.
More information follows: a couple more INFO lines that display a few statistics on the slab and the particular object within it that got corrupted, the content of the left and right red zones, any padding, and the actual memory region content.
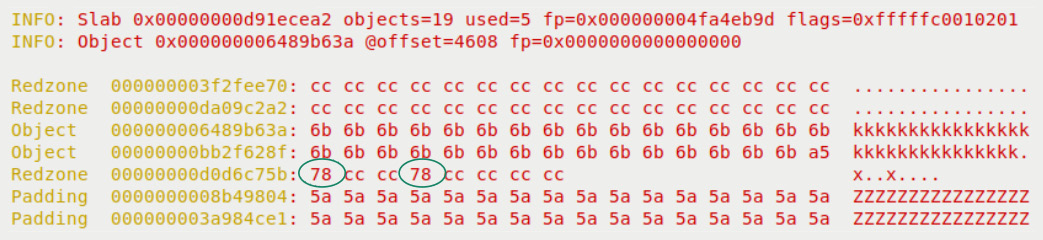
Figure 6.4 – Partial screenshot, 2 of 3, of the SLUB debug interpretation of corrupted slab memory, the red zones, object memory, and padding with faulty writes circled
Take a look at a snippet of our buggy test case code, the one that ran here:
// ch5/kmembugs_test.c
int dynamic_mem_oob_right(int mode)
{volatile char *kptr, ch = 0;
char *volatile ptr;
size_t sz = 32;
kptr = (char *)kmalloc(sz, GFP_KERNEL);
[...]
ptr = (char *)kptr + sz + 3; // right OOB
[...]
} else if (mode == WRITE) {/* Interesting: this OOB access isn't caught by UBSAN but is caught by KASAN! */
*(volatile char *)ptr = 'x'; // invalid, OOB right write
/* ... but these below OOB accesses are caught by KASAN/UBSAN. We conclude that only the index-based accesses are caught by UBSAN. */
kptr[sz] = 'x'; // invalid, OOB right write
}
As you can see highlighted, in two places, we (deliberately) perform an invalid right OOB access – writing the character x. Both are caught by the kernel SLUB debug infrastructure!
Do notice in Figure 6.4 the value 0x78 is our x character being (wrongly) written by the test case code – I've circled the incorrect writes in the figure! Next, the poison values are used if the poison flag (P) is set for the slab, as is the case here. Here, the poison value 0x6b denotes the value that's used to initialize the valid slab memory region, 0xa5 denotes the end poisoning marker byte, and 0x5a denotes use-uninitialized poisoning – useful indeed.
Further, the typical output when most kinds of kernel bugs occur follows: a detailed Call Trace (the kernel-mode stack being unwound – read it bottom-up, ignoring lines that begin with ?), and some of the CPU registers and their values:
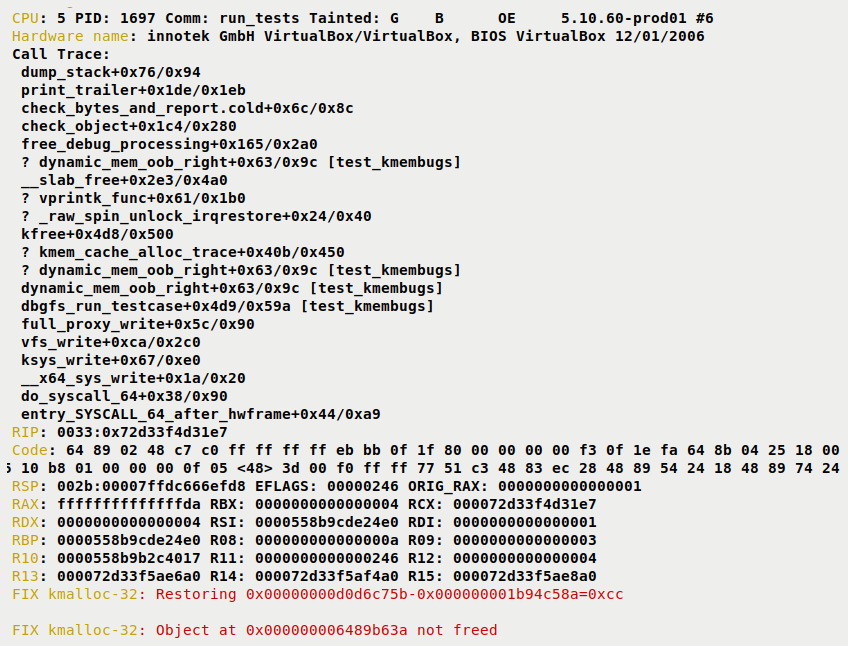
Figure 6.5 – Partial screenshot, 3 of 3, of the SLUB debug error report (continued) showing the process context, hardware, kernel stack trace, CPU register values, and FIX info
Finally, the kernel SLUB debug framework even informs us what it restores and what's to fix – see the last two lines of the preceding screenshot (beginning with FIX kmalloc-32:). With the F flag – the SLUB sanity checks feature – enabled, the kernel attempts to clean up the mess and restore the slab object state to what would be deemed the correct form. Of course, this may not always be possible to do. Also, this SLUB debug error report is generated before the slab object in question has been freed, hence the ... not freed message (our code does free it).
For more info, do refer to the official kernel documentation here: SLUB Debug output: https://www.kernel.org/doc/html/latest/vm/slub.html#slub-debug-output.
Interpreting the UAF bug on slab memory
Now let's interpret the Use After Free (UAF) bug being caught (marked as [V5] in Table 6.2). The UAF bug is caught by the slub debug framework. The error report (within the syslog) looks like this:
BUG kmalloc-32 (Tainted: G B OE ): Poison overwritten
[ 3747.701588] --------------------------------------------
[ 3747.707061] INFO: 0x00000000d969b0bf-0x00000000d969b0bf @offset=872. First byte 0x79 instead of 0x6b
[ 3747.710110] INFO: Allocated in uaf+0x20/0x47 [test_kmembugs] age=5 cpu=5 pid=2306
The format remains the same as described earlier. This time, the UAF defect caused the SLUB debug code to say Poison overwritten. Why? In our uaf() test case, we did just this, freed the slab object and then performed a write to a byte within it!
Next, the INFO line spits out the start and end of the corrupted memory region. Note that these kernel virtual addresses are hashed here, for security, preventing info-leaks. Recall that we ran this test case on our production kernel, after all.
The PID of the task performing the allocation (the process context) is seen – along with the kernel module name in square brackets, if applicable, as well as the function within it where the allocation took place.
This is followed by a stack trace (we don't show this here) and then information on which task performed the free. This can be useful, helping us identify the culprit as, typically, the task that frees the slab is the one that allocated it in the first place.
INFO: Freed in uaf+0x34/0x47 [test_kmembugs] age=5 cpu=5 pid=2306
Let's move along to the next test case, the double-free...
Interpreting the double-free on slab memory
Finally, a quick note on the double-free defect, successfully caught again (marked as [V6] in Table 6.2). Here, the kernel reports it as follows:
BUG kmalloc-32 (Tainted: G B OE ): Object already free
[ 3997.543154] --------------------------------------------
[ 3997.544129] INFO: Allocated in double_free+0x20/0x4b [test_kmembugs] age=1 cpu=5 pid=2330
The very same template as described earlier follows this output... Do try it out for yourself, both reading and interpreting it.
By the way, we've already seen how the SLUB debug framework deals with uninitialized memory reads (the UMR defect) on slab cache memory (test case #10, marked as [V3] and [V7] in Table 6.2). When run with slub_debug on, though no error report is generated, a dump of the memory region shows the poison value 0x6b, denoting the fact that this memory region is in an uninitialized state.
So, going by our experiments, while the kernel SLUB debug framework seems to catch most of the memory corruption issues on slab memory, it doesn't seem to catch the read OOB accesses on slab memory. Note that KASAN does (see Table 6.4)!
Learning how to use the slabinfo and related utilities
Another utility program that can prove to be very useful for understanding and helping debug the slab caches is one named slabinfo. Though a user-mode app, its code is in fact part of the kernel source tree, here:
tools/vm/slabinfo.c
Build it by simply changing directory to the tools/vm folder within your kernel source tree and typing make. Running it does require root access. Once built, for convenience, I like to create a soft or symbolic link to the binary executable named /usr/bin/slabinfo. Here it is on my system:
$ ls -l $(which slabinfo)
lrwxrwxrwx 1 root root 71 Nov 20 16:26 /usr/bin/slabinfo -> <...>/linux-5.10.60/tools/vm/slabinfo
Display its help screen by passing the -h (or--help) option switch. This reveals a large number of possible option switches. The following screenshot shows them all (for the 5.10.60 kernel):

Figure 6.6 – The help screen of the kernel slabinfo utility
A few things to note when running slabinfo:
- By default, this tool will only display slabs that have data within them (the same as with the -l switch, in effect). You can change this by running slabinfo -e. It displays only the empty caches – there can be quite a few!
- All options may not work straight away. Most require that the kernel is compiled with SLUB debug on (CONFIG_SLUB_DEBUG=y). Typically, this is the case, even for distro kernels. Some options require the SLUB flags to be passed on the kernel command line (via the usual slub_debug parameter).
- You need to run it as root.
Let's begin by doing a quick run (with no parameters), seeing the header line and a line of sample output, that of the kmalloc-32 slab cache – I've spaced the lines to fit):
$ sudo slabinfo |head -n1
Name Objects Objsize Space Slabs/Part/Cpu O/S O %Fr %Ef Flg
$ sudo slabinfo | grep "^kmalloc-32"
kmalloc-32 35072 32 1.1M 224/0/50 128 0 0 100
$
A quick roundup of the header line columns is as follows:
- The name of the slab cache (Name).
- The number of objects currently allocated (Objects).
- The size of each object is then shown (here, its 32 bytes, of course) (Objsize).
- The total space taken up in kernel memory by these objects (essentially, it's Objects * Objsize) (Space).
- The slab cache memory distribution for this cache: number of full slabs, partial slabs, and per-CPU slabs (Slabs/Part/Cpu).
- The number of objects per slab (O/S).
- The order of the page allocator from where memory is carved out for this cache (the order is from 0 to MAX_ORDER). Typically, MAX_ORDER is the value 11, to give us a total of 12 orders. 2^order is the size of free memory chunks (in pages) on the page allocator free list for that order (O).
- The amount of cache memory free in percentage terms (%Fr).
- The effective memory usage as a percentage (%Ef).
- The slab flags (can be empty) (Flg).
Want to see the actual printf() that emits these slab cache stats? It's right here: https://elixir.bootlin.com/linux/v5.10.60/source/tools/vm/slabinfo.c#L640.
All possible values for the slab flags and their meaning are as follows (pertain to the column named Flg on the extreme right of slabinfo normal output):
- *: Aliases present
- d: For DMA memory slabs
- A: Hardware cache line (hwcache) aligned
- P: Slab is poisoned
- a: Reclaim accounting active
- Z: Slab is red zoned
- F: Slab has sanity checking on
- U: Slab stores user
- T: Slab is being traced
Note that the columns change when the -D (display active) option switch is passed.
An FAQ, perhaps: Of the many slab caches that are currently allocated (and have some data content), which takes up the most kernel memory? This is easily answered by slabinfo: one way is to run it with the -B switch, to display the space taken in bytes, allowing you to easily sort on this column. Even simpler, the -S option switch has slabinfo sort the slab caches by size (largest first) with nice, human-readable size units displayed. The following screenshot shows us doing so for the top 10 highest kernel memory consuming slab caches:

Figure 6.7 – The top 10 slab caches sorted by total kernel memory space taken (fourth column)
Interestingly (as often happens with software), the -U 'Show unreclaimable slabs only' option of slabinfo came into being due to a system getting panicked. This occurred when the unreclaimable slab memory usage went too close to 100% and the Out Of Memory (OOM) killer was unable to find any candidate to kill! The patch has the utility – as well as the OOM kill code paths – display all unreclaimable slabs, to help with troubleshooting. This patch got mainlined in the 4.15 kernel. Here's the commit – do take a peek at it: https://github.com/torvalds/linux/commit/7ad3f188aac15772c97523dc4ca3e8e5b6294b9c. Along with the -U switch, the -S option (sort by size), makes troubleshooting these corner cases easier!
The sort-by-loss (-L) option switch has slabinfo sort the slab caches by the amount of kernel memory lost. A better word than lost, perhaps, is wasted. This is the usual well-known internal fragmentation issue: when memory is allocated via the slab layer, it internally does so via a best-fit model. This often results in a (hopefully small) amount of memory being wasted or lost. For example, attempting to allocate 100 bytes via the kmalloc() API will have the kernel actually allocate memory from the kmalloc-128 slab cache (as it can't possibly give you less via the kmalloc-96 cache), with the result that your slab object actually consumes 128 bytes of kernel memory. Thus, the loss or wastage in this case is 28 bytes. Running sudo slabinfo –L |head will quickly show you (in descending order) the slabs with maximum wastage (or loss – look at the fourth column, labeled Loss).
Once you've identified a slab cache that you'd like to further investigate, the -r (report) option will have slabinfo emit detailed statistics. By default, this is on all slabs. You can always pass a regular expression specifying which slabs you're interested in! For example, sudo slabinfo –r vm.* will display details on all slabs matching the regex pattern vm.*. With the SLUB debug flags enabled, it even shows the origin (and number) of allocs and frees for each cache; it can be useful!
At times, you might see a slab cache with a name that's unfamiliar. Trying the -a (or --aliases) option to show aliases can be useful to reveal what kernel object(s) it's being used to cache.
The -T option has slabinfo display overall totals, a summary snapshot of all slab caches. This is useful to get a quick overview of how many slab caches exist, how many are active, how much kernel memory in all is being used, and so on. This kind of information is extended when you use the -X option switch. It now shows even more detail. The following screenshot is an example of running sudo slabinfo –X on my x86_64 Ubuntu guest:

Figure 6.8 – Screenshot showing extended summary information via slabinfo -X
These can serve as useful diagnostics when troubleshooting a system (you'll find more in a similar vein in the later section entitled Practical stuff – what's eating my memory?).
Running slabinfo with the -z (zero) option switch has it show all slab caches, both the ones with data as well as the empty ones.
Debug-related options for slabinfo
For debug purposes, slabinfo has a -d and a -v option switch, allowing you to pass debug flags and validate slabs, respectively. Note that both these option switches will only work when the system is booted with the slub_debug kernel parameter set to some non-null value.
It's interesting to see: when booted with slub_debug=FZPU, all the slab caches show up with (at least) these flags set!
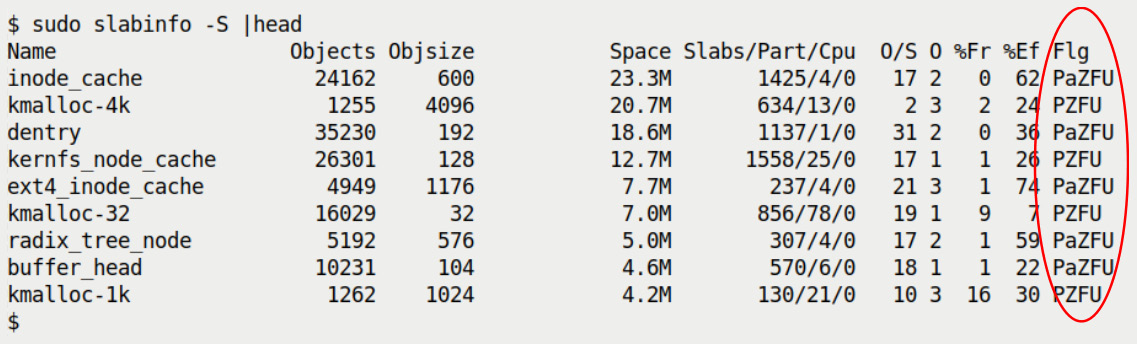
Figure 6.9 – Partial screenshot – the focus is on the SLUB debug flags being set as we booted with slub_debug=FZPU
Notice how, for all slabs, the flags minimally contain PZFU.
Regarding the -d option switch, passing it by itself turns debugging off . (Quite non-intuitively, right? Then again, this is consistent with the way the kernel parameter slub_debug behaves.) When you want the kernel's SLUB debugging options on, pass along the usual SLUB debug flags, like so: --debug=<flag1flag2...>. The slabinfo help screen shows all of this clearly. Look at Figure 6.6, specifically the last few lines – the ones that describe the --debug option switch.
What really happens under the hood when you do pass, say, --debug=fzput (or, if 'a' is passed, all these SLUB debug flags are set), as a parameter to slabinfo is this: the utility opens (as root, of course) the underlying /sys/kernel/slab/<slabname> pseudofile for that slab cache (if you passed one or more of them as a parameter), else for all slabs, and arranges to set these to 1, meaning enabled:
- If f|F is passed in --debug=<...>, /sys/kernel/slab/<slabname>/sanity_checks is set to 1.
- If z|Z is passed in --debug=<...>, /sys/kernel/slab/<slabname>/red_zone is set to 1.
- And similarly for the rest...
FYI, the code that does this is here: https://elixir.bootlin.com/linux/v5.10.60/source/tools/vm/slabinfo.c#L717.
The -v option switch to slabinfo can again be useful for debugging: it validates all slabs, and on any errors being detected, it spews out diagnostics/error reports to the kernel log. The format of the report is in fact identical to the error report format that the kernel's SLUB debug infrastructure produces (we covered this in detail here: Interpreting the kernel's SLUB debug error report).
As with the debug option switch, the –v causes slabinfo to write 1 into the pseudofile /sys/kernel/slab/<slabcache>/validate. The kernel documents this as follows: Writing to the validate file causes SLUB to traverse all of its cache's objects and check the validity of metadata. All slab objects will be checked. The detailed output is written to the kernel log. This can be useful when troubleshooting a live system that you suspect might suffer from slab (SLUB) memory corruption.
Finally, we'll just mention the fact that there's even a utility script, slabinfo-gnuplot.sh, to plot graphs to help visualize slab (SLUB) functioning over time! I'll leave it to you to browse the kernel documentation that explains how to leverage it, here: https://www.kernel.org/doc/Documentation/vm/slub.txt, in the section named Extended slabinfo mode and plotting.
The /proc/slabinfo pseudofile
Also, the kernel of course exposes all this useful information on live slabs on the system via procfs, particularly, the pseudofile /proc/slabinfo (again, you'll require root access to view it). Here's a sampling of the large data available (internally, for each slab, it breaks the data into three types: statistics, tunables, slabdata). First, the header shows the version number and the columns:
$ sudo head -n2 /proc/slabinfo
slabinfo - version: 2.1
# name <active_objs> <num_objs> <objsize> <objperslab> <pagesperslab> : tunables <limit> <batchcount> <sharedfactor> : slabdata <active_slabs> <num_slabs> <sharedavail>
And here's some data from it:
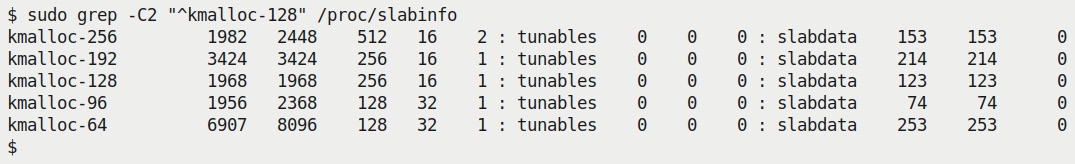
Figure 6.10 – A screenshot showing some data from /proc/slabinfo the slabdata columns being pertinent
The man page on slabinfo(5) covers interpreting this data, in effect, all slab caches exposed via /proc/slabinfo. We'll leave it to you to check it out. (Unfortunately, it seems a bit dated in the sense that both the statistics and tunables information – the first two columns – pertain to only the older SLAB implementation.)
By the way, the vmstat utility also has the ability to display the kernel slab caches and some statistics (via its -m option switch). It essentially does so by reading /proc/slabinfo, and thus implies you must run it as root. Try this on your box:
sudo vmstat -m
Check out the man page on vmstat(8) for more information.
The slabtop utility
As with top (and the more modern htop and the cool btop utilities), to see who's consuming CPU in real time, we have the slabtop(1) utility to see live, real-time kernel slab cache usage, sorted by the maximum number of slab objects by default (the sort field can always be changed via the -s or --sort option switch). It too is based on data obtained from /proc/slabinfo and thus, as usual, you'll require root access to run it. Using slabtop, you can see for yourself how, besides the caches for specific kernel data structures, the small-sized generic caches (typically the ones named kmalloc-*) are often the ones being employed the most. Do try it and check out its man page for details.
eBPF's slabratetop utility
Finally, and a recent addition, is the eBPF slabratetop utility (it could be named slabratetop-bpfcc, as is the case on my system). It displays, in real time, the kernel's SLAB/SLUB memory cache allocation rate in a manner like the top utility does, refreshing it once a second by default. It internally tracks the kmem_cache_alloc() API to track the rate and total bytes allocated via this commonly used interface to allocate slab objects within the kernel. Via option switches, you can control the output interval (in seconds) and the number of times to show it (along with a couple of other switches).
So, entering the following will have the utility display the active caches (allocation rate and the number of bytes allocated) in 5-second interval summaries, thrice:
sudo slabratetop-bpfcc 5 3
Do refer to its man page and/or pass the -h option switch to see a brief help screen.
Practical stuff – what's eating my memory?
So, knowing about these utilities, how can they practically help? Well, one common case is needing to know what's eating up memory (RAM) and from where exactly it is being eaten up.
The first question is very wide-ranging. In terms of user-mode processes and threads, utilities such as smem, ps, and so on, can help. On a raw level, peeking at memory statistics under procfs can really help as well. For example, you can track memory usage of all threads by looking through procfs with something such as the following:
grep "^Vm.*:" /proc/*/status
Within this output, the VmRSS number is a reasonable measure of physical memory usage (with the unit being kilobytes). So, doing the following can quickly show you the PIDs of the top 10 processes or threads consuming the most RAM:
grep -r "^VmRSS" /proc/*/status |sed 's/kB$//'|sort -t: -k3n |tail
Here, rather than userspace, you're perhaps more interested in who or what is eating kernel dynamic – slab cache – memory, right? Here's one investigative scenario:
- First, use slabratetop (or slabratetop-bpfcc) to figure out which slab cache, among the many present within the kernel, is being consumed the most.
- Second, use dynamic kprobes to look up the kernel-mode stack in real time to see who or what within the kernel is eating into this cache!
We can easily achieve the first step like this:
sudo slabratetop-bpfcc
[...]
CACHE ALLOCS BYTES
names_cache 18 78336
vm_area_struct 176 46464
...
Okay, based on this sample output, there's a slab cache on my (guest) system named names_cache that is consuming the greatest number of bytes. Also, you can see that the vm_area_struct slab cache is currently seeing the greatest number of allocations, all within the given time interval (a second by default).
Let's say we want to dig deeper and investigate what code paths within the kernel are allocating memory from the vm_area_struct slab cache (pretty often, 176 times per second, as of right now). In other words, how can you figure out who or what within the kernel is performing these allocations? Okay, let's see: we know that most specific slab cache objects are allocated via the kmem_cache_alloc() kernel interface. Thus, seeing the (kernel) stack of kmem_cache_alloc() in real time will help you pinpoint who the allocation is being performed by, or where from!
So how do we do that? That's the second part. Recall what you learned in the chapter on Kprobes, specifically using dynamic kprobes (we covered this in Chapter 4, Debugging via Instrumentation – Kprobes, in the Setting up a dynamic kprobe (via kprobe events) on any function) section. Let's leverage that knowledge and look deeper into this. We'll begin by using the kprobe[-perf] command (Bash script, really) to probe all running instances of the kmem_cache_alloc() API in real time and reveal the internal kernel mode stack (by passing along the -s option switch):
sudo kprobe-perf -s 'p:kmem_cache_alloc name=+0(+96(%di)):string'
Also, do recall from Chapter 4, Debugging via Instrumentation – Kprobes, in the Understanding the basics of the Application Binary Interface (ABI) section, that on x86_64, the RDI register holds the first parameter. Here, for the kmem_cache_alloc() API, the first parameter is a pointer to struct kmem_cache. Within this structure, at an offset of 96 bytes, is the thing we're after, the member named name – the name of the slab cache being allocated from!
On to the next point. The preceding command will probe for and show you all the slab cache allocations currently being performed by the popular kmem_cache_alloc() API. Let's filter its output to see only the one of interest to us right now, the one for the vm_area_struct slab cache:
sudo kprobe-perf -s 'p:kmem_cache_alloc
name=+0(+96(%di)):string' | grep -A10
"name=.*vm_area_struct"
A small portion of the output is seen in the following screenshot:
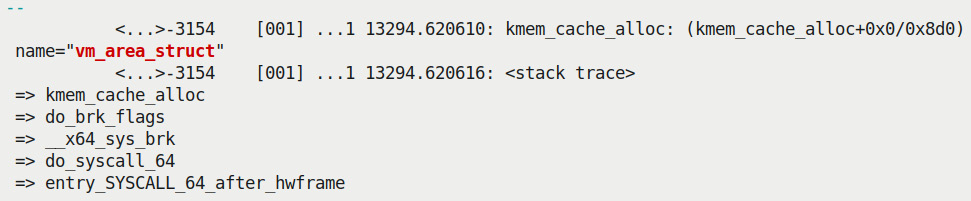
Figure 6.11 – Partial screenshot showing output from the kprobe-perf script with the kernel-mode stack showing the lead up to the kmem_cache_alloc() API for the VMA structure alloc
You might need to adjust the grep –An (I've kept n as 10 here) parameter to show a certain number of lines after the match). Quite clearly, this particular call chain shows us that the kmem_cache_alloc() API has been invoked via a system call, sys_brk(). FYI, this system call (named brk() in userspace) is typically the one issued when a memory region of a process needs to be created, or an existing one grown or shrunk.
Now, internally, the kernel manages the memory regions (technically, the mappings) of a process via the Virtual Memory Area (VMA) metadata structure. Thus, when creating a new mapping of a process – as is the case here – the VMA object will naturally need to be allocated. As the VMA is a frequently used kernel structure, it's kept on a custom slab cache and allocated from it – the one named vm_area_struct! This is the call chain from before that allocates a VMA object from this very slab cache:
sys_brk() --> do_brk() --> do_brk_flags() --> vm_area_alloc() --> kmem_cache_alloc()
Here's the actual line of code where the vm_area_alloc() routine is invoked: https://elixir.bootlin.com/linux/v5.10.60/source/mm/mmap.c#L3110, which in turn issues the kmem_cache_alloc() API, allocating an instance of a VMA object from its slab cache and then initializing it. Interesting.
Security Tip
Though unrelated to this topic, I think security is important. To guarantee that slab memory is always wiped, both at the time of allocation and freeing, pass these on the kernel command line: init_on_alloc=1 init_on_free=1. Of course, doing this can result in performance impact; do test and ascertain whether to use one, both, or none on your project. More information in a similar vein can be found here: https://kernsec.org/wiki/index.php/Kernel_Self_Protection_Project/Recommended_Settings.
Good job on covering this section on SLUB debug and its offshoots. Now let's finish this large topic on kernel memory debugging by – finally! – learning how to catch those dangerous leakage bugs. Read on!
Finding memory leakage issues with kmemleak
What is a memory leak and why does it matter? A memory leak is a situation where you have allocated memory dynamically but failed to free it. Well, you think you have succeeded in freeing it but the reality is that it hasn't been freed. The classic pedagogical case is a simple one like this (let's just make it a userspace example for simplicity):
static foo(void) {
char *ptr = malloc(1024);
/* ... work with it ... */
// forget to free it
}
Now, once you return from the function foo(), it's basically impossible to free the memory pointed to by the variable ptr. Why? You know it, ptr is a local variable and is out of scope once you've returned from foo(). Now, the 1,024 bytes of allocated memory is, in effect, locked up, inaccessible, wasted – we call this a leak. Of course, once the user process dies, it's freed back to the system.
Catching Memory Leaks in Userspace Apps
This book focuses purely on kernel debugging. Userspace app memory issues and debugging them are covered in a lot of detail in my earlier book, Hands-On System Programming with Linux, Packt, October 2018 (see chapters 5 and 6). In a word, using the newer Sanitizer toolset (especially the all-powerful Address Sanitizer (ASAN), as well as the older Valgrind suite of tools will certainly help in userspace debug.
This can certainly happen within the kernel too (just substitute the preceding user code for a kernel module and the malloc() function with a kmalloc() or a similar API!). Even a small leakage of a few bytes can become a huge issue when the code that causes the leak runs often (in a loop, perhaps). Not just that, unlike userspace, the kernel isn't expected to die... the leaked memory is thus lost forever (yes, even when a module has a leak and is unloaded, the dynamic kernel memory allocated isn't within the module; it's typically slab or page allocator memory!).
Now, you might say Hey, I know, but come on, if I allocate memory, I'll certainly free it. True, but when the project is large and complex, believe me, you can miss it. As a simple example, check out this pseudocode snippet:
static int kfoo_leaky(void) {char *ptr1 = kmalloc(GFP_KERNEL, 1024), *ptr2;
/* ... work with ptr1 ... */
// ...
if (bar() < 0)
return –EINVAL;
// ...
ptr2 = vmalloc(5120); [...]
// ... work with ptr2 ...
if (kbar() < 0)
return –EIO;
// ...
vfree(ptr2);
kfree(ptr1);
return 0;
}
You see it, don't you? At both the error return call sites before the final return, we've returned without freeing the memory buffers previously allocated – classic memory leaks! This kind of thing is in fact a pretty common pattern, so much so that the kernel community has evolved a set of helpful coding style guidelines, one of which will certainly have helped avoid a disaster of this sort: using the (controversial) goto to perform cleanup (like freeing memory buffers!) before returning. Don't knock it till you try it – it works really well when used correctly. (This technique is formally called Centralized exiting of functions – read all about it here: https://www.kernel.org/doc/html/latest/process/coding-style.html#centralized-exiting-of-functions).
Here's a fix (via the centralized exiting of functions route):
static int kfoo(void) {char *ptr1 = kmalloc(GFP_KERNEL, 1024), *ptr2;
int ret = 0;
/* ... work with ptr1 ... */
// ...
if (bar() < 0) {ret = -EINVAL;
goto bar_failed;
}
// ...
ptr2 = vmalloc(5120); [...]
// ... work with ptr2 ...
if (kbar() < 0){ret = -EIO;
goto kbar_failed;
}
// ...
kbar_failed:
vfree(ptr2);
bar_failed:
kfree(ptr1);
return ret;
}
Quite elegant, right? The later you fail, the higher/the earlier (in the code) you jump, so as to perform all the required cleanup. So here, if the function kbar() fails, it goes to the kbar_failed label, performing the required free via the vfree()API, and then neatly falls through performing the next required free via the kfree() API as well. I'm betting you've seen code like this all over the kernel; it's a very common and useful technique. (Again, a random example: see the code of a function belonging to the Cadence MACB/GEM Ethernet Controller network driver here: https://elixir.bootlin.com/linux/v5.10.60/source/drivers/net/ethernet/cadence/macb_main.c#L3578).
Here's another common root cause of leakage bugs: an interface is designed in such a way that it allocates memory, usually to a pointer passed by reference to it as a parameter. It's often deliberately designed such that the caller is responsible for freeing the memory buffer (after using it). But what happens when the caller fails to do so? A leakage bug, of course! Typically, this will be well documented, but then who reads documentation... (hey, that means read it!).
Can I see some real kernel memory leakage bugs?
Sure. First, head over to the kernel.org Bugzilla site, https://bugzilla.kernel.org/. Go to the Search | Advanced Search tab there. Fill in some search criteria – in the Summary tab, perhaps you'd want to type in something (such as memory leak). You can filter down by Product (or subsystem), Component (within Product), and even Status and Resolution! Then, click on the Search button. Here's a screenshot of the search screen for an example search I did, for your reference:

Figure 6.12 – kernel.org Bugzilla, searching for "memory leak" within bugs submitted under Drivers
(This particular search, at the time I made it, yielded 11 results.)
Again, as an example, here's one memory leak bug report from the kernel Bugzilla: backport-iwlwifi: memory leak when changing channels (https://bugzilla.kernel.org/show_bug.cgi?id=206811). Look at it and download the attachment labeled dmesg.log after reboot. The kernel log output shows that none other than kmemleak detected the leakage! We cover the interpretation of the report in the Interpreting kmemleak's report section.
The real challenge is this: without explicitly employing powerful tools – such as kmemleak for the kernel (for userspace, there's ASAN, MSAN, Valgrind's memcheck, and so on) – memory leaks often go unnoticed in development and even in testing and in the field. But when they strike one fine day, the symptoms can appear random – the system might run perfectly for a long while (even several months), when all of a sudden, it experiences random failures or even abruptly crashes. Debugging such situations can, at times, be next to impossible – the team blames power variances/outages, lightning, anything convenient to explain away the inexplicable random crash! How often have you heard support say Just reboot and try it again – it'll likely work? And the unfortunate thing is that it often does, thus, the real issue is glossed over. Unfortunately, this will simply not do on mission-critical projects or products; it will eventually cause customer confidence to deteriorate and could ultimately result in failure.
It's a serious problem. Don't let it become one on your project! Take the trouble to perform long-spanning coverage testing (and for long durations – a week or more).
Configuring the kernel for kmemleak
Before going further, do realize that kmemleak is, again, not a magic bullet: it's designed to track and catch memory leakage for dynamic kernel memory allocations performed via the kmalloc(), vmalloc(), kmem_cache_alloc(), and friends APIs only. These being the interfaces via which memory is typically allocated, it does serve an extremely useful purpose.
The key kernel config option, the one we need to enable, is CONFIG_DEBUG_KMEMLEAK=y (several related ones are mentioned here as well). Of course, there's the usual trade-off: being able to catch leakage bugs is a tremendous thing, but can cause a pretty high overhead on memory allocations and freeing. Thus, of course, we recommend setting this up in your custom debug kernel (and/or in your production kernel during intense testing, where performance isn't what matters and catching defects does).
The usual make menuconfig UI can be used to set up the kernel config; the relevant menu is here: Kernel hacking | Memory Debugging | Kernel memory leak detector. Turn it on.
Tip
You can edit the kernel config file non-interactively by leveraging the kernel's built-in config script here: scripts/config (it's a Bash script). Just run it and it will display a help screen.
Once configured for kmemleak, a quick grep for DEBUG_KMEMLEAK on our debug kernel's config file (/boot/config-5.10.60-dbg02 on my system) reveals that it's indeed all set and ready to go; see the following screenshot:

Figure 6.13 – Our debug kernel configured for kmemleak
A one-liner regarding each of the configs seen in the preceding screenshot is shown here:
- Does the architecture support kmemleak? Yes, as CONFIG_HAVE_DEBUG_KMEMLEAK=y (implies that kmemleak is supported on this CPU).
- Is the kmemleak config on? Yes, as CONFIG_DEBUG_KMEMLEAK=y.
- For allocations that might occur before kmemleak is fully initialized, a memory pool of this size (in bytes) is used to hold metadata: CONFIG_DEBUG_KMEMLEAK_MEM_POOL_SIZE=16000
- Build a module for testing kmemleak? Yes, as CONFIG_DEBUG_KMEMLEAK_TEST=m.
- Is kmemleak disabled by default? Yes, as CONFIG_DEBUG_KMEMLEAK_DEFAULT_OFF=y. Enable it by passing kmemleak=on on the kernel command line.
- Is scanning memory for leaks enabled (every 10 minutes) by default? Yes, as CONFIG_DEBUG_KMEMLEAK_AUTO_SCAN=y. This is considered reasonable for most systems, except perhaps low-end embedded systems.
Better chances of finding leaks with kmemleak are gained by enabling SLUB debug features on the kernel (CONFIG_SLUB_DEBUG=y). This is mainly due to the poisoning of slabs, which helps the leak detector as well. (As you'll realize from the previous section, this config option is typically on by default in any case!)
Using kmemleak
Using kmemleak is straightforward. Here's a basic five-step checklist and steps to follow:
- First, verify the following:
- The debug filesystem (debugfs) is mounted and visible: we'll assume it is and mounted in the usual location, /sys/kernel/debug.
- Kmemleak's enabled and running: for now, we assume it's fine. What if it isn't? More on this in the Addressing the issue – unable to write to the kmemleak pseudofile section that follows...
- Run your (possibly buggy) code or test cases, or just let the system run...
- Initiate a memory scan. As root, do the following:
echo scan > /sys/kernel/debug/kmemleak
This kicks a kernel thread (no prizes for guessing that it's named kmemleak) into action, actively scanning memory for leaks... Once done, if a leak (or the suspicion of one) is found, a message in this format is sent to the kernel log:
kmemleak: 1 new suspected memory leaks (see /sys/kernel/debug/kmemleak)
- View the result of the scan by looking up the kmemleak debugfs pseudofile:
cat /sys/kernel/debug/kmemleak
- (Optional) Clear all the current memory leak results. As root, do the following:
echo clear > /sys/kernel/debug/kmemleak
Note that as long as kmemleak memory scanning is active (it is by default), new leaks could come up. They can be seen by again simply reading the kmemleak debugfs pseudofile.
Before going any further, it's quite possible that Step 1.B will come up – kmemleak may not be enabled in the first place! The following section will help you troubleshoot and figure it out. Once you've read it, we'll move on to trying out kmemleak with our leaky test cases!
Addressing the issue – unable to write to the kmemleak pseudofile
A common issue could turn up: when attempting to write to the kmemleak debugfs file, often, you get an error like this:
# echo scan > /sys/kernel/debug/kmemleak
bash: echo: write error: Operation not permitted
Search the kernel log (via dmesg or journalctl -k) for a message like this:
kmemleak: Kernel memory leak detector disabled
If it does show up, it obviously shows that kmemleak, though configured, is still disabled at runtime. How come? It usually implies that kmemleak hasn't been correctly or fully enabled yet.
Here's a simple yet interesting way to debug what went wrong at boot (we certainly mentioned this technique in Chapter 3, Debug via Instrumentation – printk and Friends): at boot, ensure you pass the debug and initcall_debug parameters on the kernel command line, in order to enable debug printks and see details of all kernel init hooks. Now, once booted and running, do this:
$ cat /proc/cmdline
BOOT_IMAGE=/boot/vmlinuz-5.10.60-dbg02-gcc root=UUID=<...> ro quiet splash 3 debug initcall_debug
Look up the kernel log, searching for kmemleak:

Figure 6.14 – Screenshot showing how kmemleak failed at boot
We can see the following:
- The init function kmemleak_late_init() failed, returning the value -12. This is the negative errno value, of course (recall the kernel's 0/-E return convention).
- errno value 12 is ENOMEM, implying it failed as it ran out of memory.
- The error perhaps occurred here, in the initialization code of kmemleak:
// mm/kmemleak.c
static int __init kmemleak_late_init(void)
{
kmemleak_initialized = 1;
debugfs_create_file("kmemleak", 0644, NULL, NULL,
&kmemleak_fops);
if (kmemleak_error) {
/* Some error occurred and kmemleak was disabled.
*There is a [...] */
schedule_work(&cleanup_work);
return -ENOMEM;
} [...]
One possible reason that the kmemleak_error variable gets set is that the early log buffer used by kmemleak at boot isn't quite large enough. The size is a kernel config, CONFIG_DEBUG_KMEMLEAK_MEM_POOL_SIZE, and typically defaults to 16,000 bytes (as you can see above). So, let's try changing it to a larger value and retry (by the way, this config was earlier named CONFIG_DEBUG_KMEMLEAK_EARLY_LOG_SIZE; it was renamed to CONFIG_DEBUG_KMEMLEAK_MEM_POOL_SIZE in the 5.5 kernel):
$ scripts/config -s CONFIG_DEBUG_KMEMLEAK_MEM_POOL_SIZE
16000
$ scripts/config --set-val CONFIG_DEBUG_KMEMLEAK_MEM_POOL_SIZE 32000
$ scripts/config -s CONFIG_DEBUG_KMEMLEAK_MEM_POOL_SIZE
32000
(The –s option switch to the config script is to show the current value of the kernel config supplied as a parameter; the --set-val switch is to set a kernel config). We now build the reconfigured (debug) kernel, reboot, and test.
Guess what? We get the very same error: dmesg again shows that kmemleak is disabled!
A dollop of thought will reveal the actual – and rather silly – issue: to enable kmemleak, we must pass kmemleak=on via the kernel command line. In fact, we already mentioned this very point in the section on configuring kmemleak: Is kmemleak disabled by default? Yes, as CONFIG_DEBUG_KMEMLEAK_DEFAULT_OFF=y).
Important
Want to use kmemleak to detect kernel-space memory leaks? Then, after configuring the kernel for it, you have to explicitly enable it by passing kmemleak=on on the kernel command line.
Once this is done, all seems well (to verify, I even set the value of CONFIG_DEBUG_KMEMLEAK_MEM_POOL_SIZE back to its default of 16,000, rebuilt the kernel, and rebooted):
$ dmesg |grep "kmemleak"
[ 0.000000] Command line: BOOT_IMAGE=/boot/vmlinuz-5.10.60-dbg02-gcc root=UUID=<...> ro quiet splash 3 kmemleak=on
[...]
[ 6.743927] kmemleak: Kernel memory leak detector initialized (mem pool available: 14090)
[ 6.743956] kmemleak: Automatic memory scanning thread started
All good! Here's the kmemleak kernel thread:
$ ps -e|grep kmemleak
144 ? 00:00:07 kmemleak
It, in fact, is deliberately run at a lower priority (a nice value of 10), thus only running when most other threads yield (recall that on Linux, the nice value ranges from -20 to +19, with -20 being the highest priority). By the way, you can check the nice value by running ps -el instead of just ps -e.
The Nature of Debugging
So, this particular debug session turned out to be a bit of a non-event. That's okay – we eventually figured it out and got kmemleak enabled, and that's what matters. It also shows a truth about the nature of debugging – quite often, we'll chase down a path (or several) that really doesn't lead anywhere (so-called red herrings). Worry not, it's all part of the experience! In fact, it helps – you will always learn something!
For the curious: passing kmemleak=on as a kernel parameter caused the mm/kmemleak.c:kmemleak_boot_config() function to set the kmemleak_skip_disable variable to 1, which skips disabling it at boot, which is what occurs otherwise.
Running our test cases and catching leakage defects
Now that kmemleak's enabled and running, let's get to the interesting bit – running our buggy, leaky as heck test cases! We have three of them: without further ado, let's get started with the first one.
Running test case 3.1 – simple memory leakage
The code of our first memory leakage test case is as follows:
// ch5/kmembugs_test/kmembugs_test.c
void leak_simple1(void)
{volatile char *p = NULL;
    pr_info("testcase 3.1: simple memory leak testcase 1
");
p = kzalloc(1520, GFP_KERNEL);
if (unlikely(!p))
return;
    pr_info("kzalloc(1520) = 0x%px
", p);
if (0) // test: ensure it isn't freed
kfree((char *)p);
#ifndef CONFIG_MODULES
    pr_info("kmem_cache_alloc(task_struct) = 0x%px
",
kmem_cache_alloc(task_struct, GFP_KERNEL));
#endif
    pr_info("vmalloc(5*1024) = 0x%px
", vmalloc(5*1024));
}
Clearly, this code has three memory leaks – the allocation of 1,520 bytes via the kzalloc() API, the allocation of a task_struct object from its slab cache via the kmem_cache_alloc() API , and the allocation of 5 kilobytes via the vmalloc() API. Notice though, that due to CONFIG_MODULES being set, the second case doesn't actually run, leaving us with two leaks. (Here, I haven't shown explicit code to check for the failure case for the latter two allocation APIs; you should check, of course.)
As mentioned at the beginning of this section, Using kmemleak, let's now perform steps 1 to 5 (1 to 4 actually, as step 5 is optional – it's shown later):
- Verify kmemleak's enabled, running, and its kthread is alive and well.
- Run the test case:
cd <booksrc>/ch5/kmembugs_test
./load_testmod
[...]
sudo ./run_tests --no-clear
--no_clear: will not clear kernel log buffer after running a testcase
Debugfs file: /sys/kernel/debug/test_kmembugs/lkd_dbgfs_run_testcase
Generic KASAN: enabled
UBSAN: enabled
KMEMLEAK: enabled
Select testcase to run:
1 Uninitialized Memory Read - UMR
[...]
Memory leakage
3.1 simple memory leakage testcase1
3.2 simple memory leakage testcase2 - caller to free memory
3.3 simple memory leakage testcase3 - memleak in interrupt ctx
[...]
(Type in the testcase number to run):
3.1
Running testcase "3.1" via test module now...
[...]
[ 4053.909155] testcase to run: 3.1
[ 4053.909169] test_kmembugs:leak_simple1(): testcase 3.1: simple memory leak testcase 1
[ 4053.909212] test_kmembugs:leak_simple1(): kzalloc(1520) = 0xffff888003f17000
[ 4053.909390] test_kmembugs:leak_simple1(): vmalloc(5*1024) = 0xffffc9000005c000
You can see from the output that the run_tests bash script first does a few quick config checks and determines that KASAN, UBSAN, and KMEMLEAK are all enabled (do browse through the script's code on the book's GitHub repo). It then displays the menu of available test cases and has us select one. We type in 3.1. The debugfs write hook, upon seeing this, invokes the test function – in this case, leak_simple1(). It executes and you can see its printk output. Of course, it's buggy, leaking memory twice, as expected.
- Here's the key part! Initiate a kmemleak memory scan, as root:
sudo sh -c "echo scan > /sys/kernel/debug/kmemleak"
Hang on tight, the memory scan can take some time (on my x86_64 Ubuntu VM running our custom debug kernel, it takes approximately 8 to 9 seconds)...
- We read the content within the kmemleak pseudofile (in the section immediately following this). Once done, and a potential leak(s) is found, the kernel log will show something like this:
dmesg | tail -n1
kmemleak: 2 new suspected memory leaks (see /sys/kernel/debug/kmemleak)
It even prompts you to now look up the kmemleak pseudofile, /sys/kernel/debug/kmemleak. (You could always rig up a script to poll for a line like this within the kernel log and only then read the scan report; I'll leave stuff like this to you as an exercise.)
Interpreting kmemleak's report: So, let's look up the details, as kmemleak's urging us to:
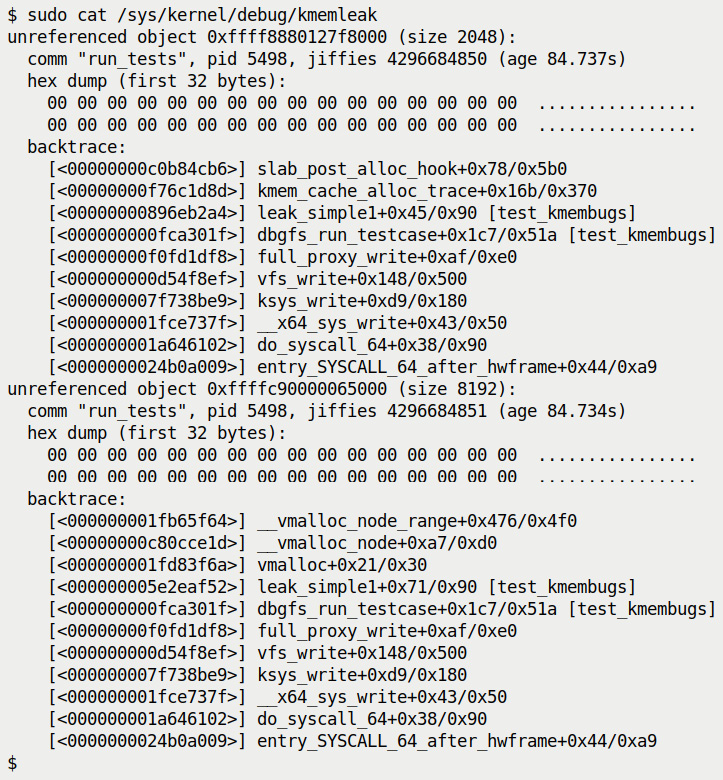
Figure 6.15 – kmemleak showing the memory leakage report for our test case #3.1
Aha, the screenshot shows that both leakage bugs have indeed been caught! Bravo.
Let's interpret in detail the first of kmemleak's reports:
- unreferenced object 0xffff8880127f8000 (size 2048):: The KVA – the kernel virtual address – of the unreferenced object, the orphaned memory chunk, the one that was allocated but not freed, is displayed, followed by it's size in bytes.
- Our test code issued a call: kzalloc(1520, GFP_KERNEL); asking for 1,520 bytes whereas the report shows the allocated size as 2,048 bytes. We know why this is: the slab layer allocates memory on a best-fit basis; the closest slab cache greater than or equal to the size we want is the kmalloc-2k one, thus the size shows up as 2,048 bytes.
- comm "run_tests", pid 5498, jiffies 4296684850 (age 84.737s): This line shows the (process) context in which the leak occurred, the value of the jiffies variable when it occurred, and the age – this is the time elapsed from when the process context (the one that ran the leaky kernel code) ran to now... (doing sudo cat /sys/kernel/debug/kmemleak a little later will show that the age has increased!). Keeping an eye on the age field can be useful: it allows you to see if a detected leak is an old one (you can then clear the list by writing clear to the kmemleak pseudofile).
- Next, a hex dump of the first 32 bytes of the affected memory chunk is displayed (as we issued the kzalloc() API here, the memory is initialized to all zeros).
- This is followed by the crucial information – a stack backtrace, which of course you read bottom-up. In this particular first leak test case, you can see from the trace that a write system call was issued (showing up as the frame __x64_sys_write here; this originates from the echo command we issued, of course). It, as expected, ended up in our debugfs write routine.
- Next, we see dbgfs_run_testcase+0x1c7/0x51a [test_kmembugs]. As mentioned earlier, this implies that the code that ran was at an offset of 0x1c7 bytes from the start of this function and the length of the function is 0x51a bytes. The module name is in square brackets, showing that this function lives within that module.
- It called the function leak_simple1(), again, within our module.
- This function, as we know, issued the kzalloc() API, which is a simple wrapper around the kmalloc() API, which works by allocating memory from an existing slab cache (one of the kmalloc-*() slab caches – as mentioned earlier, it will be the one named kmalloc-2k).
- This allocation is internally done via the kmem_cache_alloc() API, which kmemleak tracks (thus it shows up in the stack backtrace as kmem_cache_alloc_trace()).
So, there we are – we can see that our test case indeed caused the leak! The interpretation of the second leak is completely analogous. This time, the stack backtrace clearly shows that the leak_simple1() function in the test_kmembugs module allocated a memory buffer by invoking the vmalloc() API, which we quite deliberately didn't subsequently free, causing the leak.
- Optionally (and step 5 of this procedure), we can clear (as root) all the current memory leak results:
$ sudo sh -c "echo clear > /sys/kernel/debug/kmemleak"
$ sudo cat /sys/kernel/debug/kmemleak
Done. Clearing the previous results is useful, allowing you to de-clutter the report output; this is especially true when running development code (or test cases) over and over.
Running test case 3.2 – the "caller-must-free" case
Our second memory leakage test case is interesting: here, we invoke a function (named leak_simple2()) that allocates a small 8-byte piece of memory via the kmalloc() API and sets it content to the string literal, leaky!!. It then returns the pointer to this memory object to the caller. This is fine. The caller then collects the result in another pointer and prints its value – it's as expected. Here's the code of the caller:
// ch5/kmembugs_test/debugfs_kmembugs.c
[...]
else if (!strncmp(udata, "3.2", 4)) {res2 = (char *)leak_simple2();
// caller's expected to free the memory!
    pr_info(" res2 = "%s"
", res2 == NULL ? "<whoops, it's NULL>" : (char *)res2);
if (0) /* test: ensure it isn't freed by us, the caller */
kfree((char *)res2);
}
Run it (via our run_tests script), then perform the usual:
$ sudo sh -c "echo scan > /sys/kernel/debug/kmemleak"
$ sudo cat /sys/kernel/debug/kmemleak
unreferenced object 0xffff8880074b5d20 (size 8):
comm "run_tests", pid 5779, jiffies 4298012622 (age 181.044s)
hex dump (first 8 bytes):
6c 65 61 6b 79 21 21 00 leaky!!.
backtrace:
[<00000000c0b84cb6>] slab_post_alloc_hook+0x78/0x5b0
[<00000000f76c1d8d>] kmem_cache_alloc_trace+0x16b/0x370
[<000000009f614545>] leak_simple2+0xc0/0x19b [test_kmembugs]
[<00000000747f9f09>] dbgfs_run_testcase+0x1e6/0x51a [test_kmembugs]
[...]
Great, it's caught. Interestingly, the first time I ran the scan, nothing seemed to be detected. Running it again after a minute or so yielded the expected result – it reported one new suspected memory leak. Also, having the address of the unreferenced (or orphaned) memory buffer lets you investigate more about it via the kmemleak dump command. We cover it and related stuff in the upcoming section, Controlling the kmemleak scanner.
Running test case 3.3 – memory leak in interrupt context
Until now, we've been pretty much exclusively running our test cases by having a process run through our (buggy) kernel module code. This, of course, implies that the kernel code was run in process context. The other context in which kernel code can possibly run is interrupt context, literally, within the context of an interrupt.
Types of Interrupt Contexts
More precisely, within interrupt context, we can have a hardirq (the actual hardware interrupt handler), the so-called softirq, and the tasklet (the common way in which bottom halves are implemented – the tasklet is in fact a type of softirq). These details (and a lot more!) are covered in depth in my earlier book Linux Kernel Programming – Part 2 (hey, it's freely downloadable too).
So, what if we have a memory leak in code that runs in interrupt context? Will kmemleak detect it? The only way to know is to try – the empirical approach!
The code of our third – interrupt-context – memory leakage test case is as follows:
// ch5/kmembugs_test/kmembugs_test.c
void leak_simple3(void)
{ pr_info("testcase 3.3: simple memory leak testcase 3
");irq_work_queue(&irqwork);
}
To achieve running in interrupt context without an actual device that generates interrupts, we make use of a kernel feature – the irq_work* functionality. It allows the ability to run code in interrupt (hardirq) context. Without going into details, to set this up, in the init code of our module, we called the init_irq_work() API. It registers the fact that our function named irq_work_leaky() will be invoked in hardirq context. But when will this happen? Whenever the irq_work_queue() function triggers it! This is the code of the actual interrupt context function:
/* This function runs in (hardirq) interrupt context */
void irq_work_leaky(struct irq_work *irqwk)
{int want_sleep_in_atomic_bug = 0;
PRINT_CTX();
if (want_sleep_in_atomic_bug == 1)
        pr_debug("kzalloc(129) = 0x%px
",
kzalloc(129, GFP_KERNEL));
else
        pr_debug("kzalloc(129) = 0x%px
",
kzalloc(129, GFP_ATOMIC));
}
The leakage bug is obvious. Did you see the sneaky bug that we can cause to surface (if you set the variable want_sleep_in_atomic_bug to 1?) This leads to an allocation with the GFP_KERNEL flag in an atomic context – a bug! Okay, we'll ignore that for now as it won't trigger as the variable is set to 0 (try it out and see, though).
We execute the test case (via our trusty run_tests wrapper script). To be safe, let's clear the kmemleak internal state first:
sudo sh -c "echo clear > /sys/kernel/debug/kmemleak"
Then, run the relevant test case:
$ sudo ./run_tests
[...]
(Type in the testcase number to run):
3.3
[...]
Now, let's have kmemleak scan kernel memory for any suspected leaks, and dump its report:
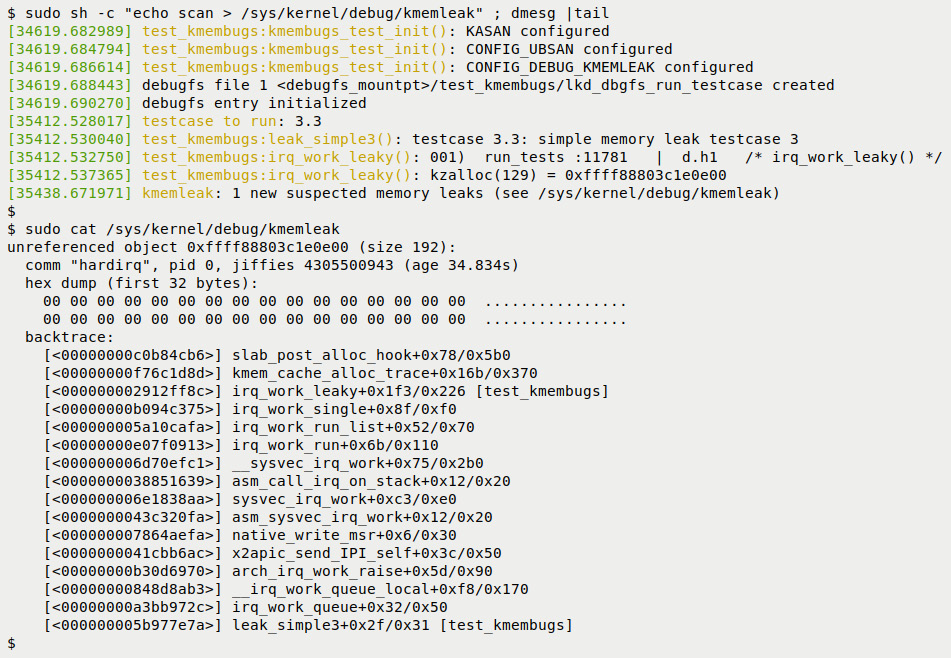
Figure 6.16 – kmemleak catches the leak in interrupt context
- Test case 3.3 runs. The custom convenient.h:PRINT_CTX() macro shows the context: you can see the d.h1 token within, showing that the irq_work_leaky() function ran in the hardirq interrupt context (we covered interpreting the PRINT_CTX() macro's output in Chapter 4, Debug via Instrumentation – Kprobes, in the Interpreting the PRINT_CTX() macro's output section).
- The top line shows we ran the kmemleak scan command, getting it to check for any leakage.
- The read of the kmemleak pseudofile tells the story: the orphaned or unreferenced object, the memory buffer we allocated but didn't free. This time, the context is "hardirq" – perfect, the leak did indeed occur in an interrupt, not process, context. This is followed by the hex dump of the first 32 bytes and then the stack backtrace (whose output verifies the situation).
Next, let's check out the kernel's built-in kmemleak test module.
The kernel's kmemleak test module
While configuring the kernel for kmemleak, we set CONFIG_DEBUG_KMEMLEAK_TEST=m. This has the build generate the kmemleak test kernel module, for my (guest) system, here: /lib/modules/$(uname –r)/kernel/samples/kmemleak/kmemleak-test.ko.
This module's code is present within the samples folder of the kernel source tree, here: samples/kmemleak/kmemleak-test.c. Please do take a peek; though short and sweet (and full of leaks), it quite comprehensively runs memory leakage tests! I inserted it into kernel memory with the command:
sudo modprobe kmemleak-test
The dmesg output is seen below. I also did the usual kmemleak scan and dumped it's report; it caught all 13 memory leaks (!). The first of its reports (catching the first leak) is visible here as well:

Figure 6.17 – Output from trying out the kernel's kmemleak-test module; the first kmemleak report is seen at the bottom
Notice that the addresses of the allocated memory buffers are printed with the %p specifier, leading to the kernel hashing it (info leak prevention, security), but the kmemleak report shows the actual kernel virtual address. Do try it out yourself and read the full report.
Controlling the kmemleak scanner
This is the kmemleak debugfs pseudofile, our means to work with kmemleak:
$ sudo ls -l /sys/kernel/debug/kmemleak
rw-r—r-- 1 root 0 Nov 26 11:34 /sys/kernel/debug/kmemleak
As you know by now, reading from it has the underlying kernel callback display the last memory leakage report, if any. We've also seen a few values that can be written to it, in order to control and modify kmemleak's actions at runtime. There are a few more; we summarize all values you can write (you'll need root access, of course) in the following table:
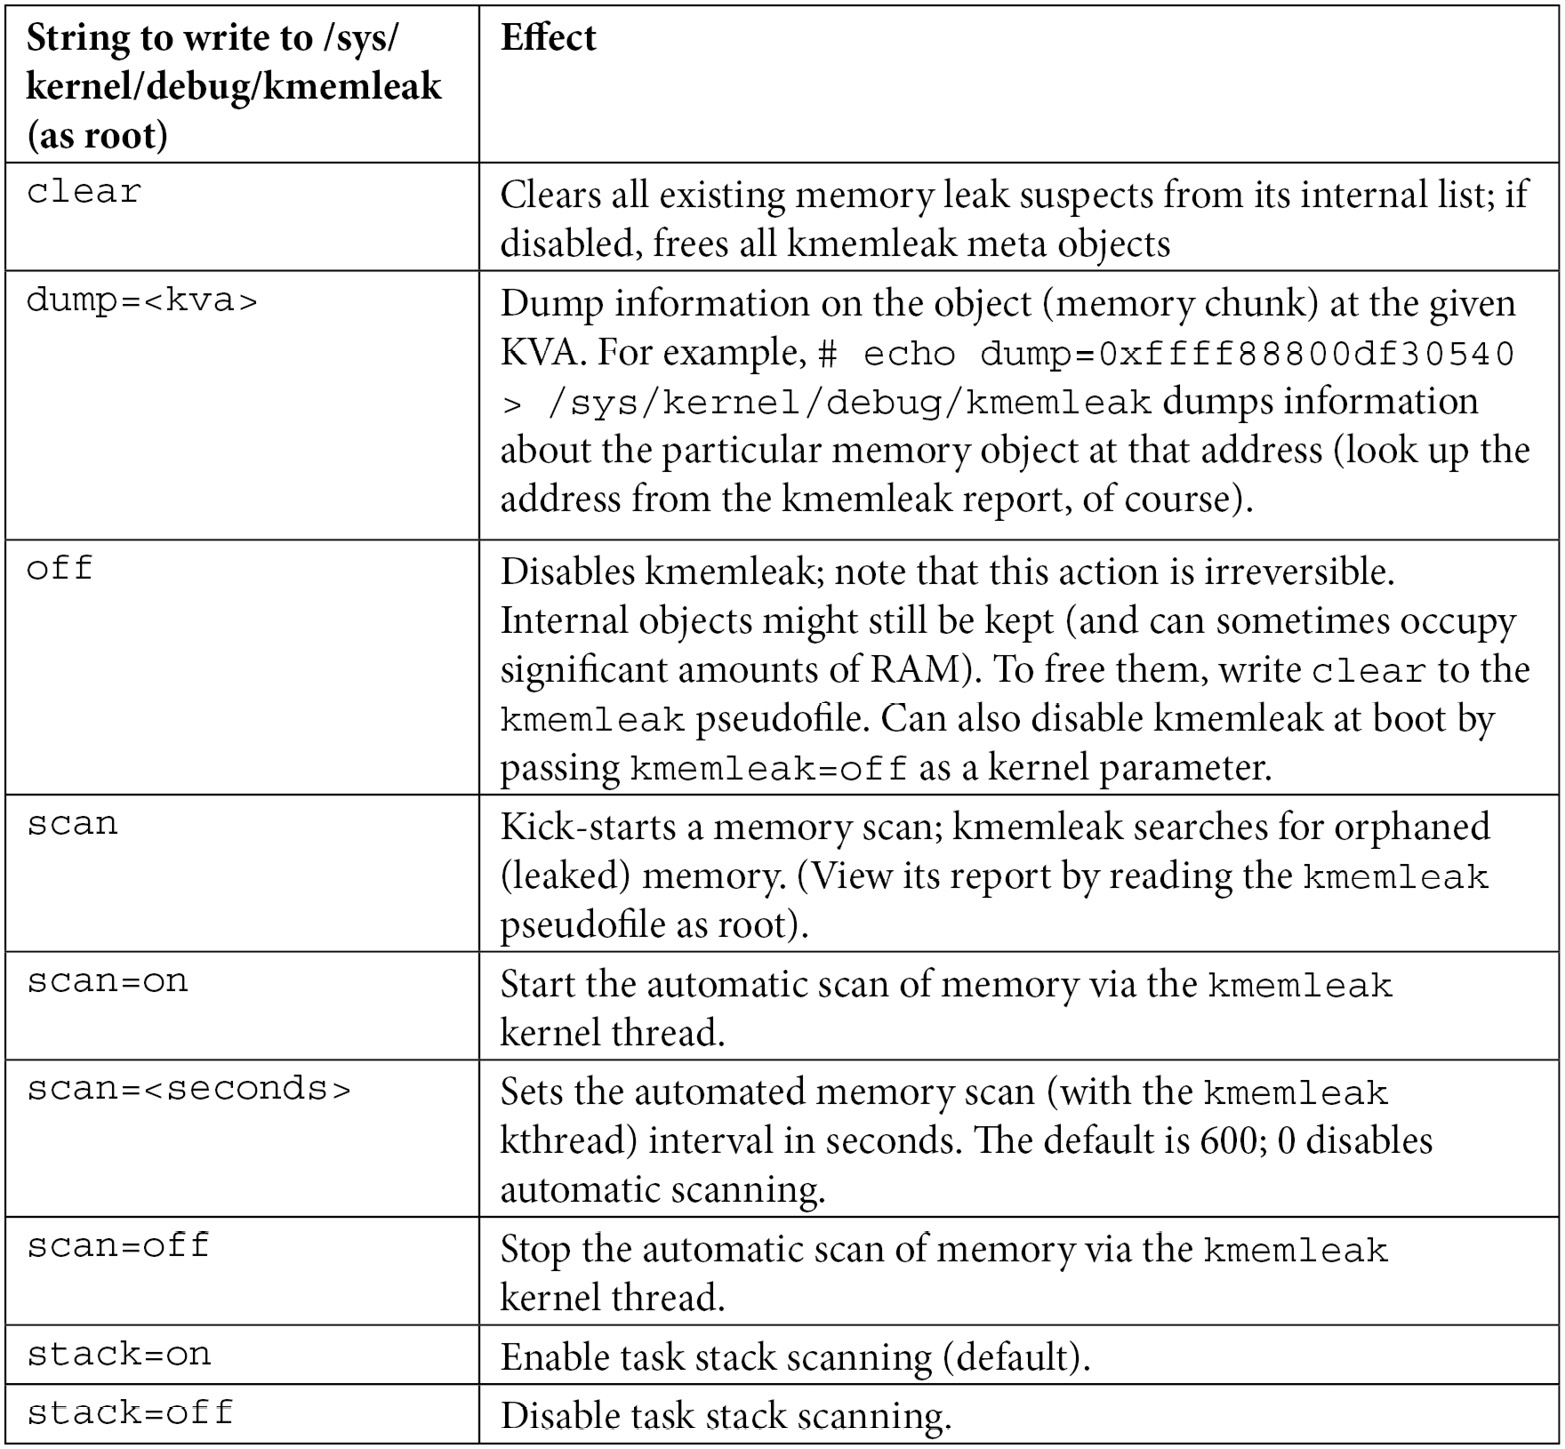
Table 6.3 – Values to write to the kmemleak pseudofile to control it
The code that governs the action to be taken on these writes can be seen here: mm/kmemleak.c:kmemleak_write().
A quick tip: If you need to test something specific and want a clean slate, as such, it's easy to: first clean the kmemleak internal list, run your module or test(s), and run the scan command, followed by the read to the kmemleak pseudofile. So, something like this:
# echo clean > /sys/kernel/debug/kmemleak
//... run your module / test cases(s) / kernel code / ...
// wait a bit ...
# echo scan > /sys/kernel/debug/kmemleak
// check dmesg last line to see if new leak(s) have been found by kmemleak
// If so, get the report
# cat /sys/kernel/debug/kmemleak
As with any such tool, the possibility of false positives is present. The official kernel documentation provides some tips on how you could deal with it (if required): https://www.kernel.org/doc/html/latest/dev-tools/kmemleak.html#dealing-with-false-positives-negatives. This document also covers some details about the internal algorithm used by kmemleak to detect memory leakage. Do check it out (https://www.kernel.org/doc/html/latest/dev-tools/kmemleak.html#basic-algorithm).
A few tips for developers regarding dynamic kernel memory allocation
Though not directly related to debugging, we feel it's well worth mentioning a few tips with respect to dynamic kernel memory allocation and freeing, for a modern driver or module author. This is in line with the age-old principle that prevention is better than cure!
Preventing leakage with the modern devres memory allocation APIs
Modern driver authors should definitely exploit the kernel's resource-managed (or devres) devm_k{m,z}alloc() APIs. The key point: they allow you to allocate memory and not worry about freeing it! Though there are several (they all are of the form devm_*()), let's focus on the common case, the following dynamic memory allocation APIs for you, the typical driver author:
void *devm_kmalloc(struct device *dev, size_t size, gfp_t gfp);
void *devm_kzalloc(struct device *dev, size_t size, gfp_t gfp);
Why do we stress that only driver authors are to use them? Simple: the first, mandatory parameter is a pointer to the device structure, typical in all kinds of device drivers.
The reason why these resource-managed APIs are useful is that there is no need for the developer to explicitly free the memory allocated by them. The kernel resource management framework guarantees that it will automatically free the memory buffer upon driver detach, and/or, if a kernel module, when the module is removed (or the device is detached, whichever occurs first).
As you'll surely realize, this feature immediately enhances code robustness. Why? Simple, we're all human and make mistakes. Leaking memory (especially on error code paths) is indeed a fairly common bug!
A few relevant points regarding the usage of these devres APIs:
- A key point – don't attempt to blindly replace k[m|z]alloc() with the corresponding devm_k[m|z]alloc() APIs! These resource-managed allocations are really designed to be used only in the init and/or probe() methods of a device driver (all drivers that work with the kernel's unified device model will typically supply the probe() and remove() (or disconnect()) methods. We will not delve into these aspects here.
- devm_kzalloc() is usually preferred as it initializes the buffer as well, thus eclipsing the, again all too common, uninitialized memory read (UMR) types of defects. Internally (as with kzalloc()), it is merely a thin wrapper over the devm_kmalloc() API. (It's popular: the 5.10.60 kernel has the devm_kzalloc() function being invoked well over 5,000 times.)
- The second and third parameters are the usual ones, as with the k[m|z]alloc() APIs – the number of bytes to allocate and the Get Free Page (GFP) flags to use. The first parameter, though, is a pointer to struct device. Quite obviously, it represents the device that your driver is driving.
- As the memory allocated by these APIs is auto-freed (on driver detach or module removal), you don't have to do anything after allocation. It can, though, be freed via the devm_kfree() API. Doing this, however, is usually an indication that the managed APIs are the wrong ones to use...
- The managed APIs are exported (and thus available) only to modules licensed under the GNU General Public License (GPL) (ah, the sweet revenge of the kernel community).
A few more tips on memory-related issues for developers follow...
Other (more developer-biased) common memory-related bugs
Studies have shown that <insert anything you'd like here>. Okay, jokes aside, there's evidence to suggest that preventing bugs during the development cycle (and/or early unit testing) itself causes the least impact on the product (both cost-wise and otherwise). Good, solid coding practices are skills one continually hones as a developer. As we've seen, when it comes to working directly with memory, a non-managed language such as C can be a nightmare, both bug- and security-wise. Thus, here's a hopefully useful quick list with regard to common development-time defects that can occur when using the kernel's memory allocation/free slab APIs:
- Performing a kernel slab allocation with the wrong GFP flag(s); for example, with GFP_KERNEL when in an atomic context (such as an interrupt context of any sort, or when holding a spinlock), here, you should use the GFP_ATOMIC flag, of course!
For instance, here's the patch to one such bug: https://lore.kernel.org/lkml/[email protected]/.
- Memory allocated via k{m|z}alloc() but freed with vfree(), and vice versa.
- Not checking the failure case (NULL, of course, for memory allocations). This might seem pedantic, but it can and does happen! Using the if (unlikely(!p)) { […] kind of semantic is fine.
- Doing things such as the following:
if (p)
kfree(p);
It's not required but quite harmless – still, don't. The reverse isn't: only performing some action after a free conditionally, if the pointer is NULL. In other words, assuming that the free interface sets the pointer variable to NULL! It does not (though that would be quite intuitive).
- Failing to realize the wastage (internal fragmentation) that can occur when allocating memory via the slab layer. Use the ksize() API to see the actual number of bytes allocated. For example, in this pseudocode, p = kmalloc(4097); n = ksize(p);, you'll find the value of n – the actual memory allocated – is 8,192, implying a wastage of 8,192-4,097 = 4,095 bytes, or almost 100%! Ask yourself: could I not redesign to allocate 4,096 bytes via kmalloc(), instead of 4,097? Also, recall, you can leverage using slabinfo with the –L option switch to see losses/wastage in all slab caches.
With this, we complete our detailed coverage on understanding and catching dangerous memory leakage defects within the kernel! Great going. Let's complete this long chapter with a kind of summarization of the many tools and techniques we've used.
Catching memory defects in the kernel – comparisons and notes (Part 2)
The table that follows is an extension of the one in the previous chapter (Table 5.5), adding the rightmost column, that of employing the kernel's SLUB debug framework. Here, we tabulate and hence summarize our test case results for our test runs with all the tooling technologies/kernels – vanilla/distro kernel, compiler warnings, with KASAN, with UBSAN, and with SLUB debug with our debug kernel – we employed in the preceding and this chapter. In effect, it's a compilation of all the findings in one place, thus allowing you to make quick (and hopefully helpful) comparisons.


Table 6.4 – Summary of various common memory defects and how various technologies react in catching them (or not)
As mentioned in the previous chapter, an explanation of the footnotes within this table (such as [C1], [K1], [U1], and so on) can be found in earlier relevant section. (For the footnotes within the third to sixth columns, refer to the previous chapter).
So, again, a very brief summary:
- KASAN catches pretty much all OOB buggy memory accesses on global (static), stack local, and dynamic (slab) memory. UBSAN doesn't catch the dynamic slab memory OOB accesses (test cases 4.x, 5.x).
- KASAN does not catch the UB defects (test cases 8.x). UBSAN does catch (most of) them.
- Neither KASAN nor UBSAN catch the first three test cases – UMR, UAR, and leakage bugs, but the compiler(s) generate warnings and static analyzers (cppcheck, others) can catch some of them.
- The kernel's SLUB debug framework is adept at catching most of the slab memory corruption defects, but no others.
- The kernel kmemleak infrastructure catches kernel memory leaks allocated by any of the k{m|z}alloc(), vmalloc(), or kmem_cache_alloc() (and friends) interfaces.
Miscellaneous notes
Again, a few more points on the footnotes regarding Table 6.4:
- [V1]: The system could simply Oops or hang here or even appear to remain unscathed, but that's not really the case... Once the kernel is buggy, the system is buggy.
- [V2]: Please see the explanation of this detailed note in the section Running SLUB debug test cases on a kernel with slub_debug turned off.
- [S1]: The kernel's SLUB debug infrastructure – when slub_debug=FZPU is passed as a kernel parameter – catches both write over and underflow (right and left) OOB accesses on slab memory. However, just as we saw with UBSAN, it only seems able to catch it when the buggy access is via incorrect indices to the memory region, not when the OOB access is via a pointer! Also, the OOB reads do not seem to be caught, only the writes.
So, there we are! We (finally) went through our single summary table (Table 6.4) for pretty much all the common memory defects and how they're caught, or not, by the tooling we've discussed in some depth.
Summary
Most dynamic memory allocation (and freeing) in the kernel is done via the kernel's powerful slab (internally, SLUB) interfaces. To debug them, the kernel provides a strong SLUB debug framework and several associated utilities (slabtop, slabratetop [-bpfcc], vmstat, and so on). Here, you learned how to catch SLUB bugs via the kernel's SLUB debug framework as well as how to leverage these utilities.
Among memory bugs, the very mention of the leakage defect raises dread and fear, even in very experienced developers! It's a deadly one indeed, as we (hopefully) showed you in the Can I see some real kernel memory leakage bugs? section! The kernel's powerful kmemleak framework can catch these dangerous leakage bugs. Be sure to test your product (for long durations) with it running!
As we covered these tools and frameworks, we tabulated the results, showing you the bugs a given tool can (or cannot) catch. To then summarize the whole thing, we built a larger table with columns covering all the test cases and all the tools (Table 6.4) – a quick and useful way for you to see and compare tooling and the memory defects they do and do not catch (this table's a superset of a similar table, Table 5.5, in the previous chapter)!
Good job! You've now completed the long but really important chapters on catching memory bugs in kernel space! Whew, plenty to chew on, right?! I'd definitely recommend you take the time to think about and digest these topics, practicing as you go (please do the few exercises suggested as well!). Then, when you've done so, take a break and let's meet in the next, very interesting chapter, where we'll tackle head-on the topic of what a kernel Oops is and how we diagnose it. See you there!
Further reading
- SLUB debug:
- Kernel documentation: Short users guide for SLUB: https://www.kernel.org/doc/html/latest/vm/slub.html#short-users-guide-for-slub
- slub_debug: Detect kernel heap memory corruption, TechVolve, Mar 2014: http://techvolve.blogspot.com/2014/04/slubdebug-detect-kernel-heap-memory.html
- slabratetop example by Brendan Gregg: https://github.com/iovisor/bcc/blob/master/tools/slabratetop_example.txt
- Interesting: Network Jitter: An In-Depth Case Study, Alibaba Cloud, Jan 2020, Medium: https://alibaba-cloud.medium.com/network-jitter-an-in-depth-case-study-cb42102aa928
- LLVM/Clang: LLVM FAQs, omnisci: https://www.omnisci.com/technical-glossary/llvm
- Kmemleak: Kernel Memory Leak Detector: https://www.kernel.org/doc/html/latest/dev-tools/kmemleak.html#kernel-memory-leak-detector
- Linux Kernel Memory Leak Detection, Catalin Marinas, 2011: https://events.static.linuxfound.org/images/stories/pdf/lceu11_marinas.pdf
- GRUB bootloader:
- How To Configure GRUB2 Boot Loader Settings In Ubuntu, Sk, Sept 2019: https://ostechnix.com/configure-grub-2-boot-loader-settings-ubuntu-16-04/
- GRUB: How do I change the default boot kernel: https://askubuntu.com/questions/216398/set-older-kernel-as-default-grub-entry
- The Heartbleed OpenSSL (TLS) vulnerability
- https://heartbleed.com/
- https://xkcd.com/1354/ (Brilliantly illustrated here)