
Raw data collected from a data source usually presents different particularities, such as data range, sampling, and category. Some variables result from measurements, while the others are a summary or even calculated. Preprocessing means to adapt these variables' values to form neural networks that can handle them properly.
Regarding weather variables, let's take a look at their range, sampling, and type, shown in the following table:
|
Variable |
Unit |
Range |
Sampling |
Type |
|---|---|---|---|---|
|
Mean temperature |
°C |
23.86–29.25 |
Hourly |
Average of hourly measurements |
|
Precipitation |
Mm |
0–161.20 |
Daily |
Accumulation of daily rain |
|
Insolation |
h |
0–10.40 |
Daily |
Count of hours receiving sun radiation |
|
Mean humidity |
% |
65.50–96.00 |
Hourly |
Average of hourly measurements |
|
Mean wind speed |
km/h |
0.00–3.27 |
Hourly |
Average of hourly measurements |
Except for insolation and precipitation, the variables are all measured and share the same sampling, but if we wanted, for example, to use an hourly dataset, we would have to preprocess all the variables to use the same sample rate. Three of the variables are summarized using daily average values, but if we wanted to, we could use hourly data measurements. However, the range would surely be larger.
Normalization is the process to get all the variables into the same data range, usually with smaller values, between 0 and 1 or -1 and 1. This helps the neural network to present values within the variable zone in activation functions such as sigmoid or hyperbolic tangent:

Values too high or too low may drive neurons to produce values that are too high or too low as well for the activation functions, therefore leading the derivative for these neurons to be too small, near zero.
The normalization should consider a predefined range of the dataset. It is performed right away:

Where Nmin and Nmax represent the normalized minimum and maximum limits, respectively; Xmin and Xmax denote X variable's minimum and maximum limits, respectively; X indicates the original value; and Xnorm refers to the normalized value. If we want the normalization to be between 0 and 1, for example, the equation is simplified as follows:
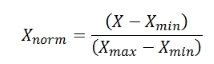
By applying the normalization, a new "normalized" dataset is produced and is fed to the neural network. One should also take into account that a neural network fed with normalized values will be trained to produce normalized values on the output, so the inverse (denormalization) process becomes necessary as well.

or:
For the normalization between 0 and 1.