
The two broader classes of problems that MLPs are suitable for are as follows: classification and regression. Classification means that given a dataset composed of records, each record should be labeled or classified. Regression means that given a set of inputs and outputs, one must find a function that maps the inputs to the outputs. Both types of problems belong to the category of supervised learning.
Given a list of classes and a dataset, one wishes to classify them, according to a historical dataset containing records and their respective classes. The following table shows an example of this dataset, considering the subjects' average grades between 0 and 10.
|
Student ID |
Subjects |
Profession | |||||||
|---|---|---|---|---|---|---|---|---|---|
|
English |
Math |
Physics |
Chemistry |
Geography |
History |
Literature |
Biology | ||
|
89543 |
7.82 |
8.82 |
8.35 |
7.45 |
6.55 |
6.39 |
5.90 |
7.03 |
Electrical engineer |
|
93201 |
8.33 |
6.75 |
8.01 |
6.98 |
7.95 |
7.76 |
6.98 |
6.84 |
Marketing professional |
|
95481 |
7.76 |
7.17 |
8.39 |
8.64 |
8.22 |
7.86 |
7.07 |
9.06 |
Doctor |
|
94105 |
8.25 |
7.54 |
7.34 |
7.65 |
8.65 |
8.10 |
8.40 |
7.44 |
Lawyer |
|
96305 |
8.05 |
6.75 |
6.54 |
7.20 |
7.96 |
7.54 |
8.01 |
7.86 |
School principal |
|
92904 |
6.95 |
8.85 |
9.10 |
7.54 |
7.50 |
6.65 |
5.86 |
6.76 |
Programmer |
|
… |
… |
… | |||||||
One example is the prediction of profession based on academic grades. Let's consider a dataset of former students who are now working. We compile a dataset containing each student's average grade on each subject and his/her current profession. Note that the output would be the name of professions, which neural networks are not able to give directly. Instead, we need to make one column (one output) for each known profession. If that student chose a certain profession, the column corresponding to that profession would have the value one; otherwise, it would be zero. The following chart shows a view of how this matrix would look like:

Now, we want to predict which profession a student will be likely to choose on the basis of his/her grades. To this end, we structure a neural network containing the number of academic subjects as the input and the number of known professions as the output, and an arbitrary number of hidden neurons in the hidden layer. A neural net schema for this problem is presented in the following figure:

For the classification problem, there is usually only one class for each data point. So, in the output layer, the neurons are fired to produce either zero or one; it is better to use activation functions that are output bounded between these two values. However, we must consider a case in which more than one neuron would fire, giving two classes for a record. There are a number of mechanisms to prevent this case, such as the softmax function or the winner-takes-all algorithm, for example. These mechanisms are going to be detailed in the practical application in Chapter 6, Classifying Disease Diagnosis.
After being trained, the neural network has learnt what the most probable profession for a given student will be, given his/her grades.
Regression involves finding some function that maps a set of inputs to a set of outputs. The following table shows a dataset containing k records of m independent inputs X known to be bound to n dependent outputs.
|
Input-independent data |
Output-dependent data | ||||||
|---|---|---|---|---|---|---|---|
|
X1 |
X2 |
… |
XM |
T1 |
T2 |
… |
TN |
|
x1[0] |
x2[0] |
… |
xm[0] |
t1[0] |
t2[0] |
… |
tn[0] |
|
x1[1] |
x2[1] |
… |
xm[1] |
t1[1] |
t2[1] |
… |
tn[1] |
|
… |
… |
… |
… |
… |
… |
… |
… |
|
x1[k] |
x2[k] |
… |
xm[k] |
t1[k] |
t2[k] |
… |
tn[k] |
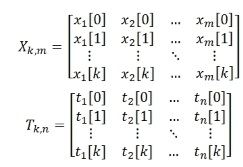
The preceding table can be compiled in the matrix format:
Where
Unlike the classification, the output values are numerical instead of labels or classes. There is also a historical database containing records of some behavior that we would like the neural network to learn. One example is the prediction of bus ticket prices between two cities. In this example, we collect information from a list of cities and the current ticket prices of a bus departing from one city and arriving in another. We structure the city features as well as the distance and/or time between them as the input and the bus ticket price as the output. The following figure illustrates this road net between the cities, represented as letters:

The following table shows a list of records taken from the cities mentioned in the preceding image and the structure to be fed into the neural network:
|
Features of city of origin |
Features of city of destination |
Features of the route |
Ticket fare | ||||||
|---|---|---|---|---|---|---|---|---|---|
|
Population |
GDP |
Routes |
Population |
GDP |
Routes |
Distance |
Time |
Stops | |
|
500,000 |
4.5 |
6 |
45,000 |
1.5 |
5 |
90 |
1,5 |
0 |
15 |
|
120,000 |
2.6 |
4 |
500,000 |
4.5 |
6 |
30 |
0,8 |
0 |
10 |
|
30,000 |
0.8 |
3 |
65,000 |
3.0 |
3 |
103 |
1,6 |
1 |
20 |
|
35,000 |
1.4 |
3 |
45,000 |
1.5 |
5 |
7 |
0.4 |
0 |
5 |
|
… | |||||||||
|
120,000 |
2.6 |
4 |
12,000 |
0.3 |
3 |
37 |
0.6 |
0 |
7 |
Having structured the dataset, we define an MLP network containing the exact number of features (multiplied by 2 in the case of two cities) plus the route features in the input, one output, and an arbitrary number of neurons in the hidden layer. In the case presented in the preceding table, there would be nine inputs. Since the output is numerical, there is no need to bound the output layer, so it is better to choose the linear function as the activation function in the output layer.
This neural network would give an estimate price for a route between two cities, which currently is not served by any bus transportation company.