
INTRODUCTION
The business processes are the means by which an organisation carries out the internal operations and delivers its products and services to its customers. In this chapter we will look at techniques for modelling business processes covering both the organisational view of process modelling and the more detailed business process models.
There are many reasons for creating business process models:
- To understand how the existing process works. This can be particularly useful if the process has ‘grown’ organically (without any real planning) and no one is quite sure what happens currently in response to an event.
- To explain to those working on the process what they do and how their task relates to the others working on the process. Here, the process model can be a training aid for new staff and an aide-memoire or reminder for more experienced personnel.
- To help ensure consistency of approach, so that everyone follows the same process and customers’ experiences are not wholly dependent on who is dealing with them, in other words the ‘luck of the draw’.
- To identify the problems and weaknesses of an existing business process with a view to developing and implementing an improved one. A model of an existing business process is often called an ‘as is’ model and the improved one is known as a ‘to be’ model.
ORGANISATIONAL CONTEXT
A typical organisation has many processes, many of which could be improved in some way or other. The costs and benefits of such improvement projects will vary enormously and, before embarking on a business process improvement project, it is useful to examine the organisational context in which the business processes take place. An understanding of the context will also help to understand how the process is affected by external environmental factors.
The traditional view of a business is based on the specialist functional areas such as sales, accounts and operations (Figure 7.1). Typically, this is documented on an organisation chart which shows the departments and how they are further subdivided, the reporting lines and the staff that work in the various areas. Individual employees tend to identify with a particular function – ‘I work in IT’ – because that defines not just the job that they do but also their social group, attitudes and culture.
Figure 7.1 Functional view of an organisation (Reproduced by permission of Assist Knowledge Development Ltd)

The functional view of an organisation is very useful for the internal management and staff to see how the organisation is structured and where they fit within it. However, there are some limitations with this view. It is predominantly internally oriented, concentrating on the structure of the organisation and the internal reporting lines, aspects that are usually of little interest to the organisation’s customers. Moreover, it defines the formal structure, ignoring the unofficial communication and cooperation between staff that can be just as important for success. The functional view is also ‘static’ as it does not show what the business does over time in order to react to an event such as a customer requesting a service.
The static nature of the functional view contrasts sharply with the process view. The people carrying out the tasks within a process could well belong to several different functions and may need to pass information or products across functional boundaries. For example:
- a customer may first tell a salesperson the details of an order;
- the order is then passed onto warehouse staff to physically make up the order;
- next, it is collected by logistics staff;
- the goods are then delivered to the customer.
The process view emphasises the need for cooperation between all the participants if the desired level of customer service is to be achieved. Thinking of the organisation as separate, autonomous departments may erect barriers and create operational difficulties that a more joined-up approach can overcome.
AN ALTERNATIVE VIEW OF AN ORGANISATION
Paul Harmon (2007) developed the organisation model that provides an alternative view of an organisation, providing a representation of both the internal processes and the external world with which the organisation operates (Figure 7.2). The model is often developed in two stages: firstly, the external factors that influence the organisation are considered and then the internal business process is analysed.
Figure 7.2 Organisation model (after Harmon, 2007)

The four areas shown outside the organisation in Figure 7.2 highlight those aspects of the external environment that need to be considered; they define the context in which the organisation operates. These four areas are:
- The suppliers of the resources required by the business processes. This covers not only the supply of physical materials but also external suppliers of finance, people and ideas.
- The beneficiaries from the organisation. While we always include the customers who purchase the products and services within this group, it is also important to take a broader view and include other types of customer. For example, the owners and senior executives of the organisation, or partner organisations that provide a sales channel to the customers. The owners will vary depending upon the type of organisation. For example, in a commercial business there may be shareholders whereas in a not-for-profit organisation there will be a board of trustees. For each group of beneficiaries, we need to know the outcomes that they would like the organisation to deliver. These outcomes are often in conflict with each other; where customers would like prices to be as low as possible, shareholders would like to have high dividends which they may see resulting from higher prices.
- The competitors operating within the same industry or business domain. Traditionally, this is interpreted to mean other organisations with whom we are competing in specific markets. In the organisational model, we extend the concept further by including those organisations that we are competing with for the supply of finance, services, skilled staff and ideas, as well as those who compete with us for customers.
- The generic factors that may affect the organisation such as changing regulation, economics or green issues. These are the type of factors covered by a PESTLE (political, economic, socio-cultural, technological, legal and environmental) analysis as explained in Chapter 3.
Analysing the external context on the organisation model encourages the business analyst to think carefully about the context for the organisation. For example:
- What resources does it require to operate? Are these plentiful or are they in short supply? Against whom are we competing for scarce resources?
- Who are the major competitors for the purchasing customers? What do their processes offer and can we improve on this?
- What are the factors in the external environment that condition or constrain how we can operate?
- Who are owners of the organisation that we need to satisfy? This is not always an easy question to answer, for example in the case of a state school: Is it the governors? The local education authority? Central government? We may need to consider all of them.
- Who exactly are our customers? What do they require from us? How demanding are they? What are their value expectations?
The organisation’s business processes need to operate within this external environment. If we are carrying out a business process improvement project, it is important to understand the business context as this will help us determine the changes that will deliver business success.
THE ORGANISATIONAL VIEW OF BUSINESS PROCESSES
Now that we have understood the circumstances in which the business operates, we can turn our attention to what the business does when reacting to the external environment. Bearing in mind that the organisation model is a high-level view of the processes that operate across the entire business, we need to show the end-to-end set of processes that convert the inputs from the suppliers to the outputs for the customers. It is possible to identify the high-level processes by discussing with the staff and managers of the organisation. However, it is helpful to think about an overview framework such as that shown in Figure 7.3 or Porter’s value chain (Figure 7.6).
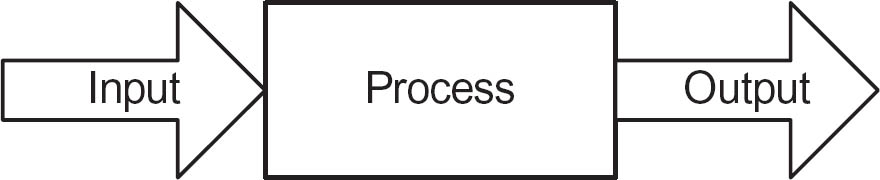
An organisational business process map is formed from a high-level set of activities carried out in order to deliver benefit or value to the customers. As shown in Figure 7.3, the process receives an input and produces an output.
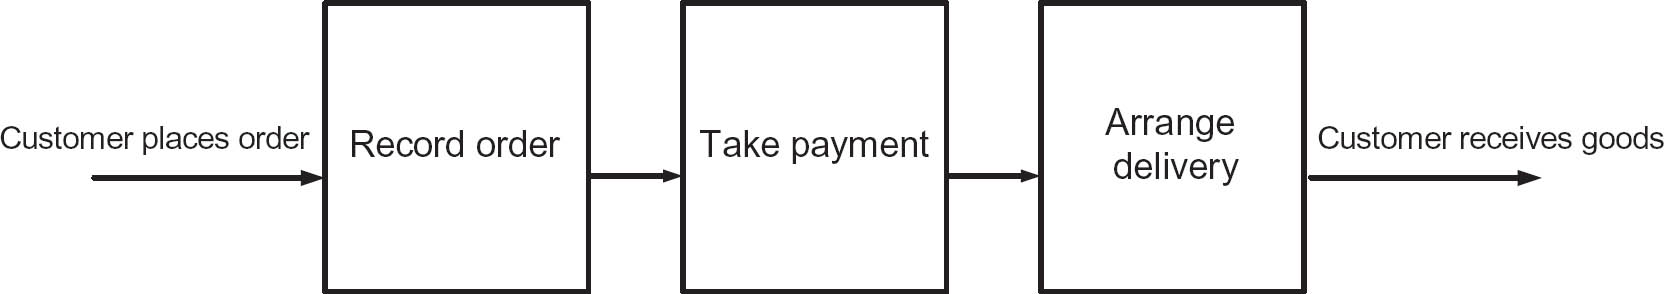
When building business process models, we can begin by producing a business process map that reflects the structure shown in Figure 7.3. Figure 7.4 shows an example of such a model.
Figure 7.3 A process receiving input and producing output
It is useful to distinguish between process maps and business process models. Process maps show sets of related processes, and their interactions, in a single diagram. Each process set is shown as a box and the arrows between them show their interdependencies. Business process models show a more detailed view of each of the processes within a higher level set.
Figure 7.4 Outline process map
It is useful to begin by considering:
- the core operation at the heart of the entire process, for example, taking bookings or selling goods;
- the processes that provide input to the core process, for example, scheduling events or making goods;
- the processes concerned with delivering products or services to the customer, for example, issuing event confirmation or delivering goods;
- any sales, marketing or customer service processes.
Figure 7.5 Overview process map for a lending library

The process map in Figure 7.5 shows the processes for the internal lending library of a consultancy company. The library provides a service to in-house staff (loan item). The loan process cannot take place unless the person requesting the loan is a registered borrower.
Although we will not have full details about each process at this point we can find out the events that trigger each process, the customer of that process and the results required. For example, if we consider ‘Register borrower’:
- The process will take place each week on receipt of information from HR detailing all the staff changes. This will allow the library to both add and delete borrowers.
- The customers will be the members of staff who are registered and the HR department who want new employees to be added and employees who have left to be deleted.
- The results required are the successful addition or removal of employees, possibly within a prescribed timeframe.
Once the loan has been made, the subsequent process would normally be ‘Accept returned item’ but failure to do this within the specified time period would result in the process ‘Issue reminder’.
The overview process map is extremely useful when the analyst starts to model a particular process. It helps to identify the boundaries of each process by showing where the process begins and where it ends. If we use the example of the lending library, the ‘Issue reminder’ process concludes with the sending of the reminder, it does not include the acceptance of the returned item. If we consider the ‘Loan item’ process, the customer here is the borrower and the process objective is achieved when the borrower has successfully completed the loan transaction. The measures applied to this process will be typically concerned with the speed and accuracy of the loan transaction.
An alternative approach to building a process map is to look at the products and services and consider what processes are required to deliver them. Michael Porter’s value chain is a useful technique here because it helps us to structure our thinking and possibly identify areas of process that we may have missed. The generic value chain is shown in Figure 7.6.
Figure 7.6 Porter’s value chain

The value chain provides a means of analysing the activities performed by an organisation. It identifies key areas of primary and support activity that will be required to deliver value to the organisation’s customers and potentially differentiate the organisation from its competitors. We can use the concept of a value chain to develop high-level process maps for the organisation. Figure 7.7 identifies the value chain activities for a manufacturing organisation using each of the primary activity sections of the value chain.
Figure 7.7 Example value chain activities for a manufacturing organisation (Reproduced by permission of Assist Knowledge Development Ltd)

When using the value chain, it is usually easiest to start with the operations – the core activity of this value chain – and then consider the other areas. In the example above, we have a manufacturing organisation and the operations primary activity is ‘Make products’. However, we can only do this if we ‘Obtain raw materials’ so this is the inbound logistics activity. The outbound logistics activity concerns delivery to the end customers. In the marketing and sales area, the organisation needs to ‘Promote products’ and ‘Take orders’. Finally, the service activity involves providing support to customers presumably by answering queries and dealing with complaints. While the value chain was originally applied in a manufacturing context, it is possible to apply it to service organisations although this usually involves combining the operations and outbound logistics areas.
VALUE PROPOSITIONS
The definition of the value chain assumes that we understand the customers who purchase our goods and know what products or services they want. A value proposition is a definition of an organisation’s product or service that will demonstrate to customers that we understand and can satisfy their needs. Moreover, it differentiates organisations from their competitors. Unfortunately, many organisations produce poor value propositions which are bland descriptions of their products rather than being closely aligned with the needs of their customers.
In order to overcome the problem of inappropriate value propositions, Kaplan and Norton (1992), the architects of the Balanced Scorecard, have identified the main attributes that make up successful value propositions. These are the drivers that lead to increased customer satisfaction, acquisition and retention. The proposition attributes cover three areas:
- product/service attributes that define the product itself;
- customer relationship aspects;
- image and reputation aspects.
The elements of a value proposition are illustrated in Figure 7.8.
Figure 7.8 Elements of a value proposition (Reproduced by permission of Assist Knowledge Development Ltd)

The product attributes are:
- Functionality – or what the product does.
- Price – what we charge for the product.
- Quality – or how well the product performs.
- Choice – do we simply provide a standard product or can it be tailored to the specific needs of the customer?
- Availability or timing – for example how quickly can we respond to customer requests and do we introduce new products at the most appropriate time?
The customer relationship aspects will influence how a customer feels about purchasing from the organisation. For example, a supermarket chain may want to emphasise convenient access to their stores as well as knowledgeable staff who have the interests of the customer as their first consideration.
The image may be that of the product, built up through extensive advertising and supported by the product attributes in order to generate customer loyalty. Thus a bottle of lager may be described as ‘reassuringly expensive’. Alternatively, a fashion retailer may develop an attractive image of the typical customer. Effectively, their message to their customers is ‘buy our clothes and be as attractive and successful as the image in the adverts’.
It is useful to understand value propositions because they define what the organisation believes it needs to deliver to its customers, the business processes being the delivery mechanisms of the organisations’ value propositions.
An organisation can differentiate itself in three ways:
- by being the most efficient;
- by having the best products;
- by providing the best customer service.
Efficiency here means high volumes, low costs (and hence, low prices), for example, as provided by budget airlines. Having the best products implies high quality but also innovation and the ability to introduce new products before the competition. Companies like Apple spring to mind here. High levels of customer service rely on flexibility which allows the product to be adaptable to the exact needs of the customer as well as staff that have the attitudes, training and freedom to understand and react to changing customer needs. The clearest examples are in the expensive end of the leisure industry which promises to exceed their customer’s needs.
When conducting a business process improvement project, an understanding of the value proposition adopted by the organisation helps the analysts to understand the focus and objectives of the business processes. For example, where an organisation prides itself on excellent customer service, the processes delivering the service need to be designed to ensure that this is what is delivered.
An alternative view of the value proposition is to consider the customer’s perspective. Customers usually know what they expect and will survey the industry to find the organisations that will meet their needs. An understanding of the customers’ value expectations helps us to consider whether, and if so how, they align with the organisational value proposition and can illuminate areas of the business processes that would benefit from improvement.
BUSINESS PROCESS MODELS
A business process is triggered by a business event and includes five key components: the tasks that make up the process, the process flow, the decision points, the actors that carry out the tasks and the outcome of the business process. Unfortunately, there is no universally agreed set of terms in business process modelling and the terms ‘process’, ‘activity’, ‘task’ and ‘step’ are often used interchangeably. For the sake of simplicity, we have adopted the following convention here:
- ‘Process’ refers to an entire set of activities that start with a triggering event and end with some output being delivered.
- ‘Task’ refers to an individual activity within the overall process; these are usually carried out by an actor at a single point in time.
- ‘Step’ refers to the activities carried out within an individual task. It is useful to show just the tasks on the process model rather than each individual step as this helps with the readability and clarity of the model. Task descriptions can then be produced where the steps within each task can be defined.
Business events
There are three types of business event:
- External – these business events originate from outside the organisation or the business system under consideration. For example, a customer makes a hotel booking or orders some goods.
- Internal – these business events originate within the business system and typically involve business managers making decisions. For example, the marketing manager makes a decision to reduce prices on a product line or the finance manager decides to review fees charged by suppliers.
- Time-based – these business events occur at a regular point in time. For example, a process to make salary payments to staff is initiated when it is the last working day of the month.
Developing the business process model
Business process models may be developed for many reasons, as we noted in the Introduction. During a process improvement project, it is common for the business analyst to produce an ‘as is’ model to show how the process works at the moment. Analysis of this ‘as is’ model will help to identify problems and weaknesses, leading to an improved version documented in the ‘to be’ process model. Both types of model are documented using the same technique.
There are many standards for modelling business processes. Two of the most popular are the UML activity diagram technique and the Business Process Model and Notation (BPMN). Business process models are often called ‘swimlane diagrams’ because the ‘swimlanes’ showing all of the tasks performed by a defined ‘actor’, form a key element of the models. Here, we will use the notation and structure from the UML activity diagramming technique to build swimlane diagrams.
The swimlane diagramming technique includes the following elements:
- the overall layout;
- the symbols used;
- the sequencing of the symbols.
To build a business process model, we first identify who takes part in the process. This enables us to identify the business ‘actors’ or ‘roles’. Actors may be individual people, a group of people or an organisation, or may be an IT system. The tasks carried out by each actor are shown in a separate band or ‘swimlane’ and arrows are used to show the flow of the work between the different swimlanes. Swimlanes usually appear on the diagram in the same sequence as the actors’ involvement in the process, although it is an informal convention that the customer swimlane is placed at the top. As a result, the action on the model goes from left to right on a horizontal layout, following the ‘time axis’ and top to bottom as the different actors get involved. These left to right and top to bottom flows mirror the way that many people read text, at least in the western world, and tends to be intuitive. To reinforce this representation of time, it is useful to show a process flow from Task A to Task B as follows:
- the process flow arrow originating from the right-hand edge of Task A;
- and ending at the left-hand edge of the Task B symbol.
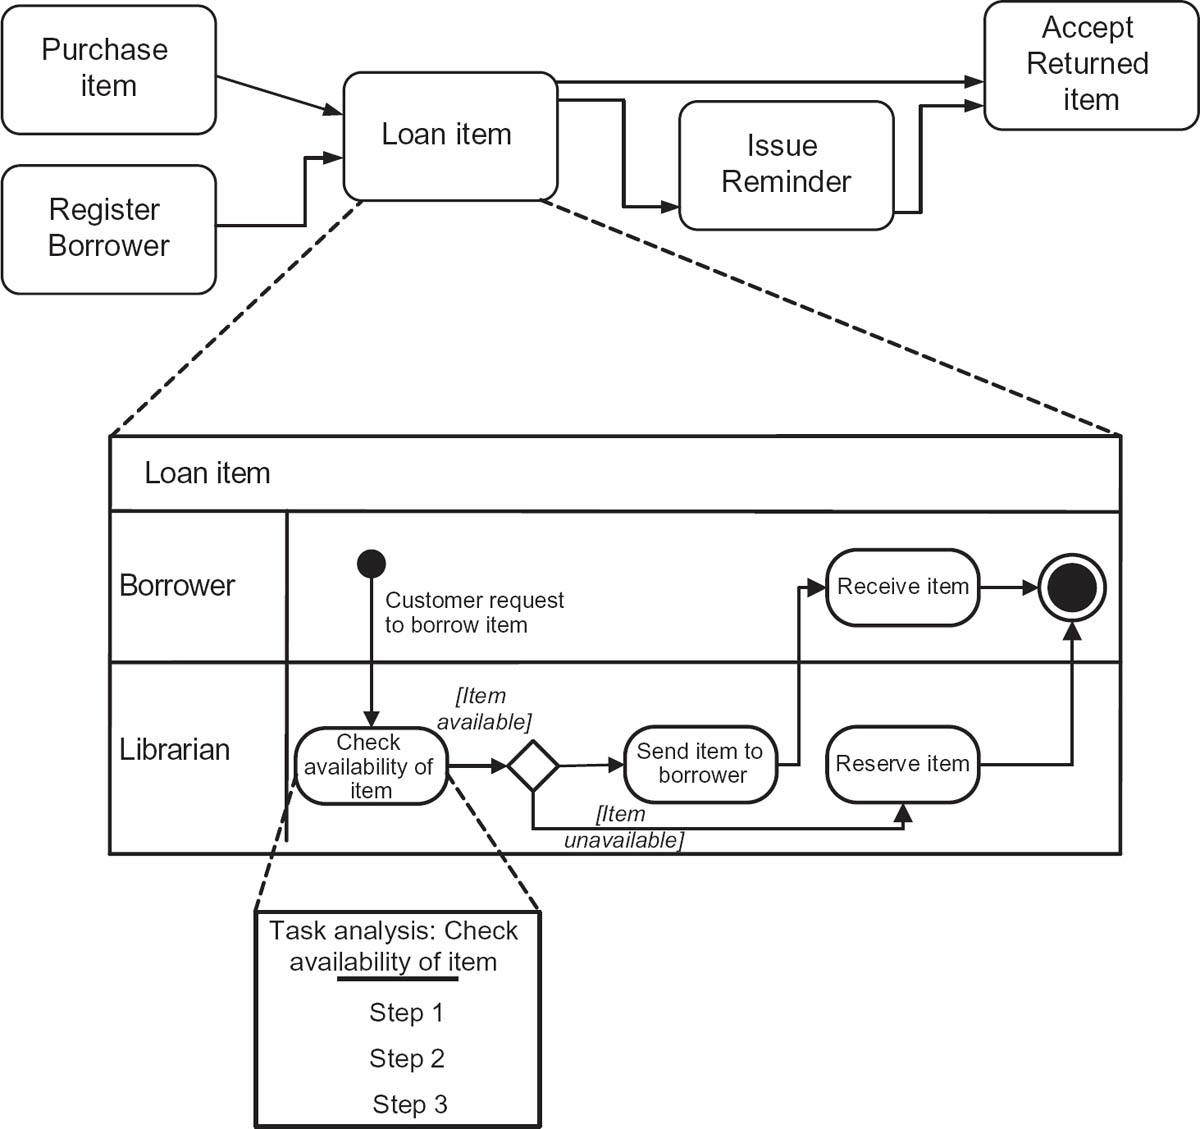
An example of this is shown in Figure 7.9 where there is a process flow from ‘Check availability of item’ (Task A) to ‘Send item to borrower’ (Task B). The implied left-to-right flow of time cannot always be shown on the model, however. If, for example, we want to show a task being carried out iteratively, we will have to include process flows going right-to-left or backwards; this does not mean they are going back in time but that the task is being repeated! This example of iteration is one situation where it may be convenient to show process flows going into and out of the upper and lower edges of the task symbol.
Figure 7.9 Business process model for ‘Loan item’ process

The diagram in Figure 7.9 shows the expanded process ‘Loan item’. This process involves two actors, the borrower and the librarian so we have two swimlanes. We place the borrower (or customer) at the top of the diagram as this is usually where the process begins or ends. The start and end points of the process are shown clearly – the former with the named event and the latter with the bullseye symbol. The first task takes place when the borrower contacts the librarian who checks if an item is available for loan. Once the librarian has carried out the check the process moves to the next task, ‘Send item to borrower’. The final task occurs when the borrower receives the item.
This diagram can be expanded further to show the tasks to deal with a request for an item that is unavailable. Figure 7.10 shows the decision point, the alternative flows with corresponding conditions, and the additional task required to handle this situation.
Figure 7.10 Business process ‘Loan item’ with alternative paths

The alternative paths that could be taken are controlled by a diamond symbol (the decision point). The conditions under which the process takes each alternate route are indicated by placing a ‘guard expression’ in square brackets next to the flow lines. For example [item available] is a guard expression used in Figure 7.10.
The action that follows ‘Reserve item’ will be carried out in the ‘Accept returned item’ process from the higher-level model. Within this process there is a check each time a borrower returns an item. The check is made to determine whether or not another borrower has reserved the item. The librarian will recognise that the item is on the reserved list and will trigger the ‘Send item to borrower’ task in the ‘Loan item’ process to issue it to the reserving borrower. This flow is added to the process model as shown in Figure 7.11.
Figure 7.11 Business process model with link from another process

It is always good practice to use a limited set of symbols on a business process model. This will help communication as the model will require minimal explanation when discussing with business stakeholders. An important convention concerns the naming of business processes and tasks. The readability of the model is enhanced if each process and task is named using a standard approach. It is best practice to construct the process or task name using the verb–noun format and the name should also describe what the process or task does. Where possible, use specific verbs, avoiding words such as ‘manage’ or ‘handle’. ‘Find book’ is a good example; it is specific, clearly describes what activity is carried out and indicates the situation after the task has been completed – the book has been found. ‘Handle payment’ is not specific enough; by the end of the task, the payment may have been handled but what does that mean?
Business analysts can fall into a common trap when modelling processes – that of going into too much detail too quickly. The actor who carries out a task often wants to tell you all about their work at the first opportunity. While this detail is important, trying to document it very early on can cause problems. The resulting process model can quickly get out of hand and become difficult for anybody to understand. Initially, it is more appropriate to show the overall structure of the process and leave the detailed description till later on. When we first talk to an actor, we are interested in:
- where they get their input information from;
- in general terms, what they do with it;
- where they forward it after they have completed their work.
Once we have documented the overall flow of the process, then we can go back and fill in the details for each task. This iterative approach means that after we have collected the details, we may then review the overall flow in light of what we have found out.
A major advantage of a business process model is that each actor can easily see their contribution to the overall process. As discussed earlier, we are trying to provide a summarised view of the business process at this stage of the analysis. As a result, the tasks reveal minimum detail. A rule of thumb is to show a separate task for a piece of work done by an actor at a particular point in time. Each task should be shown as a single action, receiving an input from the preceding actor and handing over to the succeeding actor; this flow of work from one actor to another is known as a ‘hand-off’. It is important to analyse where this occurs as hand-offs often cause problems. This is discussed later in this chapter.
Analysing tasks
The swimlane diagram shows the work carried out within the business process including actors and the flow of the work. This may be sufficient to identify problems with the ‘as is’ process but often we have to go into more detail in order to really understand how the process works and what is going wrong. A more detailed approach is to analyse each task (or box) shown on the business process model. We might consider the following aspects for each task:
- The trigger or business event that initiates the task.
- Inputs to the task. This may include the trigger but there is also likely to be additional information required to carry out the task.
- Outputs from the task.
- Costs relevant to this particular task.
- Measures and standards applicable to the task.
- Detailed breakdown of steps within the task.
- Business rules to be followed in performing the task.
Documenting these aspects will help in the analysis of the task and in the identification of any problem areas or opportunities for improvement. A textual description may suffice for many tasks but where the steps and business rules are more complex a diagram, such as a flowchart or UML activity diagram (without swimlanes), will be much more useful.
Hierarchy of process models
The set of process models – from organisation-level to swimlane diagram to task analysis – provides an organised, clear definition of the business processes and procedures. Figure 7.12 shows this hierarchy.
Figure 7.12 Process model hierarchy
This multileveled approach to business process modelling will necessitate an iterative approach to the analysis. As the lower level task analyses reveal more detail, it is inevitable that the higher level business process models will have to be updated.
Beginning and ending the process
The start of a process can be represented in various ways. It is usual for the swimlane of the process initiator, such as the customer, to be at the top of the model. The variations between the different approaches determine how much detail is shown in that particular swimlane.
The simplest way, as shown in Figures 7.10 and 7.11, shows the initiator, this time the borrower, providing the event or trigger that starts off the rest of the processing. The business that is receiving and processing the request is treating the borrower as an external stakeholder. It knows nothing about how the borrower creates that initiating request but simply reacts as soon as it receives the input.
In a different situation, the business may work more closely with the initiator. Imagine, for example, a customer ringing up a call centre to place an order. The customer and the call centre sales person are working together to record the order details. This could be represented as a single task involving both actors and thus shown on the boundary between the customer and sales person swimlanes. This situation is shown in Figure 7.13.
Figure 7.13 Task completed by two actors

A third approach may show the initiator, such as a customer, carrying out the task of creating the order on their own. In this situation, the entire task of ‘Create order’ is shown within a customer swimlane. It can be important to know that the customer completes part of the process without any intervention from the business staff. For example, if the customer is using the organisation’s website to place the order, the quality of the website is likely to affect the customer’s perception of the process. Therefore, this task needs to be considered as an integral part of the process.
The end of a process is represented by a bullseye symbol. Usually processes have multiple pathways and hence multiple ways in which they can end. A retailing organisation, for example, would normally expect its order process to end with the successful delivery of the order to the customer. The order could, however, be checked and rejected. It is important to know the state of the order when the process ends because that determines what can happen next. If an order has been successfully delivered to a credit customer, for example, the next thing is to invoice them for the order amount. For a rejected order on the other hand, the customer must resubmit it. As a guideline, there should be a separate end for each significant end state. Some modellers label the end symbol with the name of its state.
ANALYSING THE ‘AS IS’ PROCESS
Businesses evolve over time. The internal organisation and people within the business change. The customers and the products we sell them change. As a result, processes are constantly changing to reflect the different environment in which they operate. Unfortunately, many of these changes occur in an ad hoc and uncontrolled way. When we formally model a process, we start to see how messy and incoherent they have become. Many people are surprised when they first see the swimlane diagram of the process on which they work. Whilst they are familiar with their own part of the process, they may have little idea of what the whole process does, how it works and where their work fits within it.
Identifying problems
In order to identify problems with an, as is, process, we need to find out how well it supports the business. Are the customer-facing processes good enough to satisfy the customers and ensure that they come back and spend more money? The ordering process must be fast, accurate and efficient so that it does not cost too much. For analysis purposes, we need to know exactly what such terms actually mean. How quickly do we need to deliver the goods to the customer if we are to retain their loyalty? How much should it cost the business to handle an order? Once we have determined the required performance levels, the next step is to compare them with the actual performance of the existing process. Information about the required and actual performance levels may not be easily available which can suggest several problems. However, it is worth persevering in order to obtain this information. A gap between the actual and required performance levels indicates the need for improvements. We can use the ‘as is’ model as a basis for analysing why the performance targets are not being achieved. There are two key aspects of the model we need to examine, the hand-offs between the tasks and the tasks themselves.
Analysing the hand-offs
One of the frequent problems found with business processes involve ‘hand-offs’, where one actor passes the work to another actor. Figure 7.14 shows two hand-offs, one from the Manager to the Clerk, and the other from the Clerk to the Manager. The task ‘Calculate results’ has two hand-offs in this diagram, one preceding and one succeeding.
Figure 7.14 Hand-offs on the high-level process model
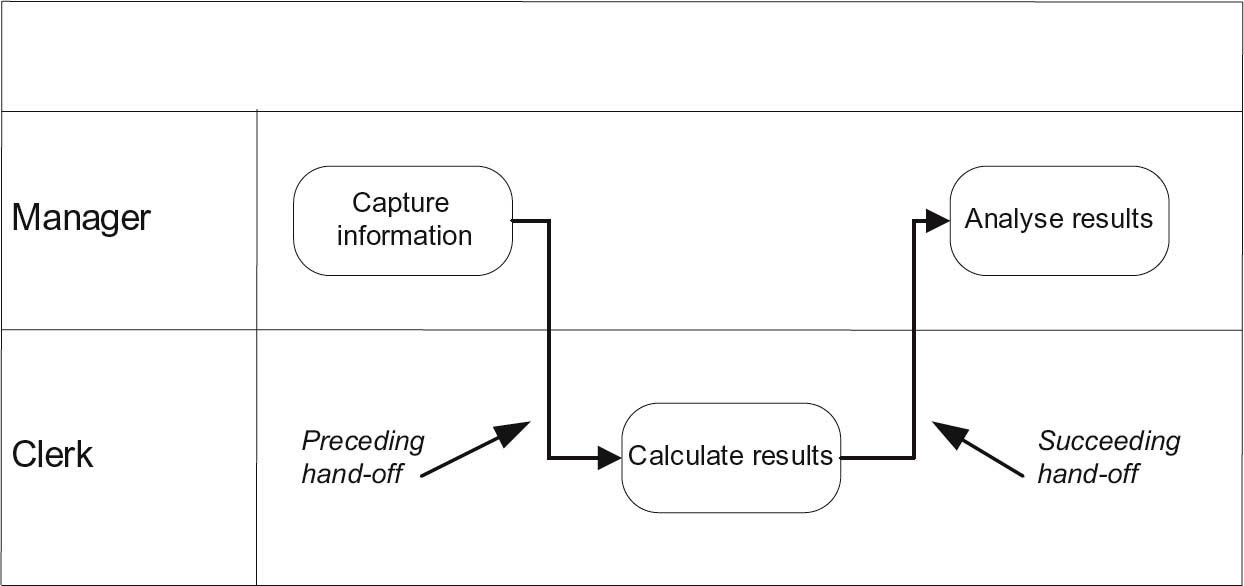
Clear representation of hand-offs is a major advantage of this diagramming technique and is particularly beneficial when we are trying to improve processes. Hand-offs account for many of the problems experienced by traditional processes as they can cause delays, communication errors and bottlenecks to occur. For example, once a piece of work arrives at its destination it may have to wait in a queue until an actor is free to deal with it. Too often it is assumed that the work is dealt with immediately when this is not the case. Analysis of the ‘as is’ processes commonly shows that transactions spend more than 70 per cent of the elapsed time simply waiting to be processed. It has even been estimated that, in some processes, the transactions are being actively processed for less than 10 per cent of the elapsed time, with more than 90 per cent of the time spent in transit or in queues. Queues form at hand-offs because the two actors have not synchronised their work. In some situations, attempts to optimise work in one task can actually make the performance of the whole process worse. For example, working on batches of transactions may help a particular task to be carried out more efficiently but the delay caused when waiting for each batch to build up may slow down the overall progress of the work.
A further cause of delays at hand-offs is where there is inadequate resource capacity to handle the throughput and queues develop. Queues can behave in an odd way, especially when the transactions arrive in a random fashion. Queuing theory tells us that attempts to increase the utilisation of the workers under these circumstances will cause the queues to build up dramatically. The production system on the shop floor of a factory is a specific example of a process in which the queues, in this case of physical components that are being produced, are very visible as they are handed over to the different machine operations, such as milling and turning.
There are other problems with hand-offs, often occurring because the transaction is going from one IT system to another. These systems could be large information systems or small spreadsheets developed by individuals. Problems occur where the data issued by the sending system needs to be reformatted to suit the needs of the receiving software. This not only takes time and effort but can also introduce errors. Also, subsequent correction of the errors will require additional time and resource.
Hand-offs cause problems in all organisations. Although a process in a bank, for example, may seem very different from one in a factory, they both face the same kinds of problems where hand-offs occur. Hand-offs, and the problems they can cause, are a major source of inefficiencies in processes, so addressing them can be key to business process improvement.
Analysing the processing
The ‘as is’ processes may have been in use for some considerable time and during this period they may have changed in a piecemeal fashion, reacting to changing business needs. As a result, they may contain significant inefficiencies and inconsistencies. When analysing business processes it is important to look for the following possibilities:
- Duplication of work. Some tasks may be carried out despite the fact that they duplicate other actors’ tasks or record the same information.
- Redundancy. Work and/or data that was necessary when the process was first designed may no longer be required.
- Lack of standardisation. Previously, organisations were less aware of the need for effective processes and hence there was less emphasis on carrying out processes in a standard way. Remote locations such as branch offices and depots were allowed flexibility in the way that they interpreted and implemented their processes. This may have worked in a decentralised business but now that there is greater control and centralisation, all the different parts of the business are expected to operate in an integrated fashion.
- Incompleteness. New requirements may have been identified of the process since its original design. These may have been ignored because they were too difficult or costly to incorporate in the existing process or they may have been handled by a work-around.
- Inconsistent measurement or control. The business process approach has increased the emphasis on measuring the standard of work and the service provided to customers. Where a process has developed over time the measures may not be relevant or may be inconsistent with other measures.
If any of these situations are encountered, the analyst needs to apply business process modelling and improvement approaches in order to rectify the situation.
Other factors causing inadequate performance of a process
This chapter describes the process modelling technique which helps us to analyse the design of an ‘as is’ process as a stepping stone to improving its performance. Even if a process is perfectly designed, however, this does not guarantee that the process will achieve its performance objectives. There are various reasons why this might be the case:
- The staff working on the process may not have the right skills, training and motivation to produce the desired results.
- The resources made available to run the process may be insufficient to handle the volume of transactions received. This could include both staff and equipment resources.
- The process may not be managed appropriately. This is a particular problem when a process crosses many organisational boundaries and there is no single owner to manage the whole process.
IMPROVING BUSINESS PROCESSES
Improving the business process is about removing the problems that have been identified in the ‘as is’ process. Before we accept the initial definition of a problem, it may be worthwhile stepping back and asking whether this is the real problem that we should be solving or possibly a symptom of a more fundamental problem. Our initial analysis, for example, might have identified that our invoice production is taking too long and we are missing deadlines for billing our customers. One solution to this could be to allocate more resources to the processing to speed it up. Further analysis, however, might reveal that the real cause of the delay is excessive rework. A more appropriate solution to this situation would be to implement tighter controls, reduce the rework and eliminate the delays without incurring the cost of increased resources.
Business rules
Business process improvement is also about challenging the assumptions and business rules upon which the current process is built and which, in some circumstances, may limit the process. Business rules are categorised in two ways:
- Constraints – these are the business rules that have to be applied and restrict how a process or task is performed. The constraints may be enforced upon the organisation, for example they may be legal or regulatory constraints. Alternatively, they may result from internal policies or strategies.
- Operational guidance – these are the business rules that determine how procedures are conducted within the organisation. For example, there may be rules governing cancellation fees for hotel bookings or postage charges for delivering orders.
Business rules are often simply accepted – ‘It’s the way we do business here’ – but sometimes it is useful to consider whether there is an alternative approach available. While some rules may have made sense when they were introduced, it can be useful to challenge them to see whether they still make sense now. If they do not, then they need to be changed. A good example is that of a well-known high street store which for many years sold certain soft drinks by the box – customers had to buy 12 bottles at a time. When the store reduced the unit of orders down to 6 bottles rather than 12, they found a significant increase in sales.
We describe some commonly used approaches to improving processes below.
Simplify the process
Simplifying a process can be achieved by eliminating unnecessary tasks or hand-offs. Certain tasks within a process may have been required when the process was first introduced but as a result of changes to the business have now become redundant. For example, reports may still be produced despite the fact that nobody uses them any longer. Eliminating these tasks not only reduces the running costs and resources used by the process, it also reduces the hand-offs and their delays. Another example of simplification is where a number of tasks, carried out by different actors, are combined into a single task for one actor only. As well as reducing the number of hand-offs, this can result in other improvements such as a reduction in errors and duplication. There is also greater scope for giving the actor an extended, more meaningful task to carry out.
The general principle that we are applying here is ensuring that all the processing adds value. This can involve delivering direct value to the customer or enabling another part of the process which does itself add customer value. If the task does neither, then eliminate it. We find non-value adding work when we have to correct errors we have made earlier in a process. Rigorous checking, appropriate levels of control and ensuring that errors are corrected as soon as they are discovered will reduce error handling costs and effort.
Extend the processing
Where business scenarios have developed that are not covered by the ‘as is’ process, the likelihood is that workarounds will have been invented. As a result, it is possible that different actors may handle such scenarios in different ways. The process may be improved by adding extra tasks to the process, or further steps to a task, in order to provide a standard way of dealing with these scenarios.
Remove bottlenecks
Bottlenecks result when there is a mismatch in the capacities of related tasks. For example, we have a mismatch if task A can handle 100 transactions per hour and these are passed onto task B that can only deal with 90 transactions per hour. In this example, it is easy to see that the bottleneck could be removed by increasing the resources undertaking task B. However, real life processes are often very complex and require detailed analysis to identify such capacity mismatches. In these cases, it can be useful to use sophisticated process modelling tools as they provide simulation facilities that help us examine the performance and resource requirements of proposed process designs.
Change the sequence of tasks
‘As is’ business processes often reveal their origins. For example, although a current process may be supported by an IT system it may not have been subject to considered process redesign when the system was introduced so is merely an updated version of the original clerical process. In such a situation, the updated process may have unwittingly and unnecessarily perpetuated the limitations of the original process. For example, a process where the tasks are performed in sequence even though this is unnecessary because there is no logical dependency between the tasks. Modern workflow technology can free us from this type of limitation. Even if a transaction begins on paper, it can be scanned and electronic copies sent to several actors simultaneously, so long as they can work independently. As a result, the elapsed time for the overall process can be reduced significantly. This is only one example of using technology to carry out tasks in different ways. Another example is the use of computer systems to automate the flow through a process, removing the need for human intervention.
Redefine process boundary
The boundary of an ‘as is’ process may be redefined in order to improve the process. This may involve extending or reducing the activities carried out by the organisation. This is a common approach adopted by many organisations where they outsource tasks or even entire processes to specialist organisations. A variant of this approach is to redefine the boundary of processes such that external stakeholders, such as customers, undertake tasks in place of the organisation’s employees. Facilities offered by internet access can enable such boundary redefinition by enabling customers to have online access to systems. For example, where order processing staff are replaced with an online booking system or access is provided to electronic documentation. A similar approach may be adopted with regard to suppliers. A distribution company supplying goods to retailers would traditionally require those retailers to submit their replenishment orders as and when their stocks got low. If the distributor were given access to retailers’ sales data, they could then maintain the retailers’ stock without any action on the retailers part. Not only would this make life easier for the retailer but the distributor would have better information for planning their own stock levels.
Automate the processing
Automation means using computer software to perform tasks rather than carrying them out manually. Automation usually leads to faster, cheaper and more reliable processes and helps with standardising the work practices; this is what many organisations are seeking when improving their processes. It also results in standardisation of the data that supports the processes, which is of great benefit to many businesses.
There is a range of automated solutions that are relevant to process improvement initiatives:
- Bespoke IT development. The definition of the business process provides an excellent basis on which to define the detailed requirements of a bespoke IT solution.
- Packaged applications. These provide best practice processes for specific areas such as Finance or HR. Examples are the ERP packages supplied by organisations such as SAP and Oracle.
- Workflow management systems. Essentially this is software that controls the flow of electronic documents/transactions through the various tasks of a process. It can ‘read’ the process model to determine exactly what should happen during a transaction, depending on particular circumstances.
- Straight through processing (STP). This as a concept from the finance industry that allows transactions to be passed from one ‘party’ to another without any manual intervention and is used to integrate the work of front, middle and back office functions.
Redesign the process
The approach we have covered so far in this chapter could be described as the incremental improvement of an existing process. Hence the sequential steps:
- develop the ‘as is’ model;
- analyse the ‘as is’ process and define its problems;
- identify potential improvements;
- document the ‘to be’ process model.
There are some situations, however, where we cannot adopt this approach. For example, there may be no existing process or it may be so radically different from what the business wants in the future that the ‘as is’ model is next to useless as a starting point. In this situation, we need to adopt an approach that enables the direct creation of a ‘to be’ business process model.
There may well be a lot of high-level information that defines the environment in which the new process will operate. The organisation model, the value chain and the value proposition will reveal the aims of the business and the environment within which the process needs to be implemented. Additional information may also be available from strategic plans, business objectives and relevant KPIs. The outline process map will indicate which other processes the new process is likely to interact with. From these sources we will be able to model the new ‘to be’ process as a black box, defining:
- the expected outcomes from the process;
- the events or triggers that the process will need to react to.
Once we understand the trigger and outcome for a process, we can begin to fill in the detailed tasks and steps. The best way to do this is to work backwards from the expected outcomes, determining the logical tasks required to achieve those outcomes. If we know the planned organisation structure and roles relevant to the new process, we will also be able to allocate the tasks to the appropriate swimlanes.
If there is an existing process, even if it is not relevant to the future business system, it may be worthwhile analysing it for two reasons. First, we may be able to identify the underlying business rules that need to be carried through into the new process. They may not be documented anywhere else. Second, at some time in the future, we will need to plan how we are going to transfer operations from the old to the new process. To do this smoothly, we need to know exactly where we are at the beginning of the changeover and where we want to be at the end. The modelling and analysis of the ‘as is’ process is essential for this planning activity.
PROCESS MEASUREMENT
When we are designing an improved business process, we must define not only what the process does but also how well that processing is to be carried out. The importance of measurement is illustrated by the oft-quoted statement ‘You can only manage what you can measure.’ If we want the actors carrying out tasks to achieve the required levels of performance, we need to define the performance measures and ensure the actors carrying out the work are advised of them. When defining performance measures, one of the fundamental points to recognise is that there are two perspectives on performance measurement: measurement for internal management purposes and measurement by our external customers. Organisations sometimes create difficulties when they concentrate on their internal measures at the expense of customer concerns.
Internal measures
Internal measures are often derived from organisational objectives, critical success factors and key performance indicators. These measures are usually defined at an organisational level, cascaded down to departmental level and then further to the operational level. The operational measures should support the higher-level measures, right up to the organisational level. The problem with internal measures is that they are often focused on what the organisation wants to achieve and not on what the customer values. For example, the organisation may set ‘low cost of operation’ as a critical success factor for the organisation, defining key performance indicators that specify which aspects of low cost should be measured. However, when related performance measures are defined for the business processes, it is possible that the focus on costs can create problems for the successful delivery of the services to the customer.
External measures
The other aspect to performance measurement is concerned with what the customer expects to have delivered. One way of thinking about this is to consider what it is that each customer group will value about the deliverables it receives from the organisation. Having identified this, we can then think about the performance measures that we need to apply internally in order to achieve what our customers require. There are three major areas to think about:
- the time it takes to complete a process or task;
- the financial measures such as costs or prices;
- the quality measures that are concerned with accuracy and effectiveness.
It is important to consider all three areas when improving a business process. If a task is likely to take too long, there will be consequential effects in other parts of the business process leading to poor customer service. If an organisation charges for a particular service but the cost of the process to deliver the service is greater than this charge, then the organisation is going to run into financial difficulties at some point. If the performance measures related to quality are not considered, customers may receive inaccurate information and poor customer service.
Process and task measures
One of the key issues for performance measures is to understand customers’ value expectations. The customer has an expectation of the organisation’s performance in delivering the product or service. Internally, the process may be made up of several individual tasks, each of which will need to be allocated performance measures. The task-level performance measures should be aggregated such that the product or service is delivered within the overall performance measures for the process. Figure 7.15 demonstrates this principle by showing our loan item example with a timeline added in. This timeline shows that the first task, ‘Check availability of item’, must take place within two working days of receiving the request from the customer. The second task, ‘Send item to borrower’, must take place within a further two working days. The customer must receive the item within a further one working day. Therefore, from item request to item receipt should take no longer than five days. These are the internal performance measures but they need to be aligned with the external expectation. If the external performance measure, the customer view, is that the item will be received within five working days then the internal measures are fine. However, if the customer is expecting the item within two working days then these internal measures are likely to ensure that the customer’s expectations will not be met.
Figure 7.15 Process model with timeline added

The performance targets set for a particular process have to align with the expectations of the customers. If we design a process that results in a service that does not meet customer expectations then the likelihood of losing customers is very high.
Estimating the timeline for a process is difficult. It will depend on a range of factors including:
- the length of time taken by each task within the process;
- the resources available to support the tasks;
- the number of transactions to be processed and how this varies over time;
- the variety and mix of different transaction types;
- the amount of rework caused by errors;
- the delays and queues at each of the hand-offs;
- the quality and productivity of the staff;
- other work that could interrupt the process.
Some process modelling software provides performance information by using data on the above factors to simulate the behaviour of the process. The value of the simulation results depend on the accuracy of the assumptions and the data fed into the model. However, the information gained can be very helpful when designing the process and defining appropriate performance targets.
Cost and time estimates are interrelated so similar issues apply when setting financial performance measures. The longer the tasks within the process take, the more resource is required and hence the higher the cost. There may also be trade-offs; in order to reduce time, we may be able to increase the expenditure on resources. However, it is important to consider how much the resource will cost and whether or not the reduced time/higher performance will justify that extra expenditure.
Performance issues
Measures and targets need to be chosen with care especially when managers are given incentives to achieve those targets. Targets will change the way that people behave – that is what they are designed to do. It is possible that the behaviour could be inappropriate if we have not thought through the implications of the targets. For example, sales staff are often set sales targets on the assumption that more sales are good for the business as a whole. However, this may not be true if the increased sales are achieved by lowering prices too much. This is an example of sub-optimisation where seemingly better performance in one part of the business can result in poorer performance for the business as a whole.
BUSINESS PROCESS MODEL AND NOTATION
Business Process Model and Notation (BPMN) provides a standardised way of drawing business process models that is comprehensive and unambiguous. It is based on work that first appeared in 2004 as the Business Process Modelling Language. The Object Management Group (OMG), who look after UML as well as other software standards, took over responsibility for BPMN, issuing Version 1.0 in 2006 and Version 2.0 in 2010.
There is a lot of interest in BPMN and many software organisations use and support it. There are two main reasons for this. First, BPMN allows users to represent process models in an industry-standard way so that they are portable across a range of modelling tools. Second, users of BPMN can specify very precise process logic that can be understood and executed by workflow or process engines that control many business processes. The notation used in BPMN is extensive and very powerful.
Process modelling using BPMN is useful in two different, but related, aspects. The first concerns business analysts when working with the business to understand the problems with the current processes and consider how they may be improved. However, once the new processes have been agreed, the second aspect concerns the technical details of how the processes will be implemented. BPMN covers both aspects in a seamless way and provides an extensive notation set. Some symbols are appropriate for process modelling as carried out by the business analyst, while others have more relevance for the technical staff.
The basics of BPMN look similar to UML activity diagrams with tasks shown in swimlanes, and connected by process flows that also link with initiating events and outcomes. There is a great deal of additional notation that could be used by the business analyst, including pools, gateways and messages.
A pool consists of lanes, the BPMN name for a swimlane. A process generally shows the sequence of tasks carried out by different actors, each in its own lane. The customer that initiates the process can be regarded as an external actor and shown as a ‘blackbox pool’, containing one lane only. No activities are shown in this pool (hence the blackbox title) as the work of the external actor is invisible to the process being analysed.
A gateway controls the flow through the tasks of a process. In BPMN, a gateway is represented as a diamond but it is more than a UML decision point. With a letter O inside the diamond, it can indicate an either/or decision (like the UML decision), whilst a + indicates a parallel process flow. Messages show how processes may communicate with each other and hence how they collaborate.
BPMN provides an extensive set of symbols and concepts. As business analysts we need to take care when using BPMN as it is important to recognise that the models we build are a means of communication with the business; too much technical detail would result in a model that was difficult for the business staff to understand. Some BPMN specialists recommend that business analysts only use a subset of the BPMN facilities; Bruce Silver’s (2009) BPMN Methods and Style provides details of his Level 1 palette of facilities.
SIX SIGMA
An alternative approach to process improvement is embodied in the Six Sigma approach developed by Motorola in the 1970s and based on ideas from statistical process control. First used in manufacturing industries in the reduction of product defects, it is now used in a range of organisations including those in the pharmaceutical industry, local authorities, food processing, hospitals, the military, logistics, NASA and financial services. Its purpose is to eradicate performance deficiencies in processes that are critical to achieving customer satisfaction. These processes might include complaint handling, order fulfilment or delivering a package to a customer’s house. To achieve process improvement, Six Sigma follows a five step approach known as DMAIC:
- Define the problem.
- Measure the data.
- Analyse the problem.
- Improve the process by removing the root causes of the problem.
- Control to prevent the original problem from reoccurring and to maintain the benefits of the changes made.
Let us assume that we are Global Deliveries PLC and we’re getting an increasing number of customer complaints about the non-delivery or late delivery of packages; about incomplete deliveries against acknowledged orders, packages delivered to wrong addresses, poor performance from the offices in Denver, Brisbane, Glasgow, Calgary and Swindon. Following the DMAIC approach, we would carry out the following activities:
- Define the problem. What is going wrong? Is it one problem or many? What is the visible evidence? Where is it and where does it come from? How serious is it? Is it organisation wide or localised? What will be done about it? What is the objective of this investigation?
- Measure the data. This means obtaining the data to identify the symptoms; do they occur all the time or from time to time? Produce a map of the process that is producing the problem. Concentrate on the symptoms doing the most damage.
- Analyse the results so far. Be creative and prepare theories about the causes of the problems. Document the theories and test them. Identify the root causes.
- Improve the process. Assess alternative improvement methods. Design and test the chosen method. Implement the chosen method.
- Control the new process and monitor its effectiveness.
Six Sigma can be seen as a very methodical and structured approach to process improvement that uses data and measurement to identify where the most business benefit can be obtained. The aim is to reduce errors so that all processes meet or exceed customers’ expectations and that there are no more than 3.4 defects per million occurrences. In the Global Deliveries PLC example this would translate into performance that delivers the right package to the right place at the right time 99.997 per cent of the time!
SUMMARY
An organised, structured approach to business process improvement will be beneficial for both the organisation and the business analysts carrying out the work. We have described an approach using an organisational view of processes that is then developed further into more detailed business process models. Business process models can be used for many purposes, including business improvement and staff training, but if they are to be useful it is important to produce clear, easily understood diagrams and well-structured supporting documentation.
REFERENCES
Harmon, P. (2007) Business Process Change, 2nd edn. Morgan Kaufmann, Upper Saddle River, NJ.
Kaplan, R. S. and Norton, D. P. (1992) ‘The balanced scorecard: measures that drive performance’, Harvard Business Review 70(1), 71–9.
Silver, B. (2009) BPMN Method and Style. Cody-Cassidy Press, Norwood, CA.
FURTHER READING
Burlton, R. (2001) Business Process Management: Profiting from Process. Sams Publishing, Indianapolis, IN.
Hammer, M. (1997) Beyond Re-engineering: How the Process-centred Organisation is Changing our Work and our Lives. HarperCollins, New York, NY.
Hammer, M. and Champy, J. (2001) Re-engineering the Corporation: A Manifesto for Business Revolution, 3rd edn. Michael and James. Nicholas Brealey Publishing Ltd, London.
Rummler, G. A. and Brache, A. P. (1995) Improving Performance: How to Manage the White Space on the Organisation Chart, 2nd edn. Jossey-Bass, San Francisco, CA.
Sharp, A. and McDermott, P. (2008) Workflow Modelling: Tools for Process Improvement and Application Development. Artech House Publishers, London.