
5 Developing a Dynamics Model for Epidermal Growth Factor (EGF)-Induced Cellular Signaling Events
Ning Xi, Ruiguo Yang, Bo Song, King Wai Chiu Lai, Hongzhi Chen, Jennifer Y. Chen, Lynn S. Penn and Jun Xi
CONTENTS
5.1.1 AFM Energy Dissipation and Hysteresivity Measurements
5.1.2 QCM-D Energy Dissipation Measurement
5.2.1 AFM Viscoelastic Characterization
5.2.2 QCM-D-Based Cell Membrane Peeling Model
5.1 Introduction
Epidermal growth factor (EGF) is a growth factor that binds a cell surface receptor [1] to an epidermal growth factor receptor (EGFR), to promote cell growth and proliferation. The ligand binding can trigger a series of downstream signaling events that regulate cell behaviors, resulting in cell proliferation, differentiation, or migration. These different cell biological behaviors result in different mechanical behaviors. The A431 human epidermoid carcinoma cell line has been widely used as a biochemical model for the investigation of signaling pathway-related cell responses triggered by EGF stimulation [2]. Researchers [3] have reported that EGF-treated A431 cells show significant rounding and swelling. It has long been postulated that signaling pathways could regulate the configuration of the cytoskeleton as a mechanism of facilitating the prospective cell behavior [4]. For instance, a cancer cell would display loose attachment, that is, poor adhesion, to make way for metastasis [5]; migration cells would have stronger cell adhesion in the filopodia in the leading edges of migration than in the trailing edges [6]. The configuration of the cytoskeleton thus will determine the overall structure of the cell body, and one can use the cytoskeleton configuration to reveal the biological behavior of living cells after certain biochemical cues. Since the cytoskeleton is deemed as the main force bearer of the whole cell [7,8], it can then be probed by mechanical force; the mechanical response of the cell, or cytoskeleton would provide abundant information about the mechanical status of the cell. We normally refer to these as biomechanical markers. Nanomechanical sensors are normally utilized to perform force loading and measurement; the measurement result is expected to yield unique insight into the cell behavior and cell signaling pathways.
Atomic force microscopy (AFM) is a high-resolution imaging technique. [9] The imaging modality is based on force interactions at the molecular level between a cantilever with a sharp tip attached at the free end and the sample beneath it. The force interaction is mainly determined by the distance between the two; thus by controlling the interaction force to a constant level, one can build a topography map of the sample by raster-scanning its entire surface. The nature of the measurement process and its ability to work in liquid environments make AFM an ideal tool for visualization of cellular and molecular structures in situ. Meanwhile, the probing interaction also provides the mechanical property of the cell samples [10]. We have observed ultra-structural changes in real time at the nanometer scale in cellular adhesions on keratinocyte cells [11]. Others have also reported results from AFM imaging for cellular structural observation, either on animal cell lines or bacterial cells [12]. Cellular elasticity can be measured by recording the force-displacement curves during AFM nanoindentation. Its effectiveness in providing biomarkers for physiological conditions has been validated previously [5,13]. Cellular viscoelasticity can be obtained by fitting AFM force-displacement curves to the Johnson-Kendall-Roberts (JKR) dynamic model [14].
The quartz crystal microbalance with dissipation (QCM-D) is another nanomechanical sensor that can measure interactions at the molecular level [15]. It has been used to investigate molecular processes, such as membrane formations [16], protein adsorptions [17], and cell spreading [18]. It operates in thickness-shear mode by oscillating a quartz crystal disk with high frequency (normally 5 MHz) and low amplitude (less than 1 nm in the lateral direction). It collects the frequency and amplitude changes of the quartz crystal and reveals the mechanical/structural status of the sample attached to the top of the sensor disk The shift in resonance frequency indicates the mass adsorption or loss, while the change in energy dissipation alteration can be used to derive the viscoelasticity properties of the adsorbed film on the disk [19].
The combination of AFM and QCM-D for biological investigations has been described in previous works [20-22]. Functionally, QCM-D measures viscoelastic property changes in biological matters at different physiological conditions. The mechanical information can be verified by probing the sample surface topography with AFM This combination was demonstrated in an earlier study [20] where the effect of different substrates on cell shape and cell mechanics was investigated. The topography and mechanical properties of the cells were obtained by AFM imaging and force measurement, and the QCM-D characterizes the adhesion between the cells and the substrates through frequency and dissipation monitoring. Instrumentation combining AFM with a QCM-D substrate has been developed and described [21]. The described system is equipped with an oscillating quartz crystal as the substrate for the AFM experiment, and the AFM imaging and QCM-D recording can be performed simultaneously on the same sample. However, attention to comparative characterization of cellular viscoelasticity by AFM and QCM-D has been lacking. It has been shown that AFM and QCM-D together have the capability for viscoelasticity measurement. While AFM scans and deforms cells from the top, QCM-D measures the sensor oscillation from the bottom where cell adhesion to the substrate dominates the acoustic wave decay. AFM performs cellular investigations as single cell analysis, and QCM-D studies the properties of a small population, a single cell layer spreading on the quartz crystal. In all these aspects, AFM and QCM-D can verify and complement each other.
5.1.1 AFM Energy Dissipation and Hysteresivity Measurements
The nanoindentation process by AFM consists of loading and unloading of the vertical force exerted by the cantilever as shown in Figure 5.1. The vertical piezo first drives the cantilever toward the cell sample and deforms it (P1 → P2 → P3); then it retracts back to the original height (P3 → P4 → P5). During the process, cantilever deflection will be picked up by a position sensitive device (PSD) to generate the applied forces at each location, and this recorded relationship is the force-displacement curve. For each cycle, forces in the approach curve at each displacement position are always larger than those in the retraction curve. This hysteresis in applied force over the displacement defines the energy loss for the loading/unloading process. The energy required to deform the cell surface at a nominal distance on loading is not entirely recovered from the cell in withdrawing the same distance during unloading. If we define the energy under the approaching curve as A, and the energy under the retraction curve as R, the area within the hysteresis loop (A − R) therefore represents the amount of energy dissipated during each cycle. Furthermore, we can define
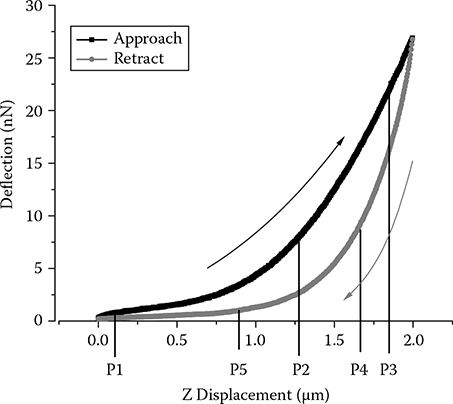
FIGURE 5.1
AFM energy dissipation.
as the hysteresivity, a characteristic measure of the viscosity property [23]. This viscoelastic index ζ indicates the viscoelastic property of a material, with ζ = 0(A = R) indicating pure elastic material and ζ = 1(R = 0) indicating pure plastic material. Most materials will have ζ values 0 < ζ < 1, showing both viscous and elastic character [24].
5.1.2 QCM-D Energy Dissipation Measurement
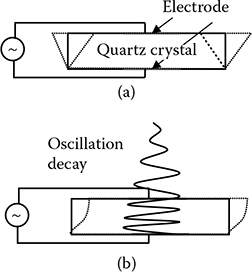
FIGURE 5.2
Schematic of QCM-D principle: (a) an alternating voltage will generate a relative movement between the upper and lower surfaces of the quartz crystal; (b) a decaying wave perpendicular to the sensor surface is the signature of QCM-D working in liquid.
Quartz crystal microbalance (QCM) uses a piezoelectric quartz crystal as an oscillator, and an alternating electrical field will generate a shear deformation of the surface [15], as shown in Figure 5.2a. The upper and lower surfaces will move in parallel but opposite directions laterally, generating an acoustic wave that will propagate in the direction perpendicular to the sensor disk surface. The acoustic wave has a frequency of f = nυ/(2tq), where f is the resonant frequency, n is the overtone number, and tq is the thickness of the crystal. When the QCM is operated in a gaseous environment, the oscillation decays negligibly. The Sauerbrey relationship describes a linear relationship between the mass change and the frequency shift [15]
where C = tqρq/f0, and ρq is the density of the crystal.
However, when the sensor is immersed in liquid as shown in Figure 5.2b, the acoustic wave will propagate through the liquid and the oscillation amplitude will decay exponentially over time. The measurement circuit periodically switches the power input on and off, so that the free decay of oscillation can be obtained by recording the output voltage [15]. The voltage decay can be fitted by
The obtained parameters τ and f can then be used to evaluate the energy dissipation factor:
which can also be considered as the energy loss ratio of lost energy over stored energy. It is related to the viscoelasticity of the material film attached to the top of the sensor disk [25]. Several mechanical models have been proposed to relate the viscosity and elasticity of the film to the measured D value. Voinova and coworkers have adapted a continuum mechanics model that considers the oscillation wave propagating through a viscoelastic material. The material is immersed in a Newtonian fluid with either known or unknown properties [19], and the model produces the relationship ofΔD and Δf with the material properties on the top.
In the present work, we apply AFM probing and QCM-D observations to the same set of cellular signaling processes induced by EGF stimulation. Both experiments monitor a monolayer of A431 cells that grow on a substrate (silicate glass substrate for AFM and a quartz crystal surface for QCM- D) and are stimulated by EGF. While QCM- D monitors the basal area of the cell layer close to the quartz crystal surface where cell adhesion dominates, AFM probes the apical surface of a single cell away from the measurements-supporting surface, thereby revealing cytoplasm behavior.
By analyzing and comparing the quantitative data using both techniques, a more complete profile of the viscoelastic behavior of the cell can be obtained.
Once the mechanical profile is obtained from both measurements, a model of the signaling pathway dynamics following the EGF simulation can be built by considering the cell mechanical structure as the plant, which makes the readings as the output of the system, and the signaling pathway as the controller. We can address the signaling events from the perspective of systematic control and identify the pathway- related dynamics model structures and parameters.
5.2 Model Development
5.2.1 AFM Viscoelastic Characterization
The following assumption was made for the force–displacement- based viscoelastic modeling; the cellular material is represented as a Voigt element, a parallel configuration of spring (k) and dashpot (η), and there is only a repulsive force between the AFM tip and the cell. Then we define the vertical displacement of the Z piezo as d and the deformation of the cell surface as x (Figure 5.3). The spring constant of the cantilever is defined as kc and its deflection is dc.
For the retraction process, based on the Voigt element configuration, the dynamic force balance can be defined as
where xm, a constant, is the maximum vertical deformation of the cellular body from the approach process and x, a function of t, is the vertical contact point elevation due to the release of the cantilever pressure in the withdrawal process. The force can also be calculated by cantilever deflection as where dcm is the maximum cantilever deflection resulting from the approach process andΔdc is the release of deflection and is defined as the difference between the distance of retraction from the piezo (d) and the cell deformation recovery (x)
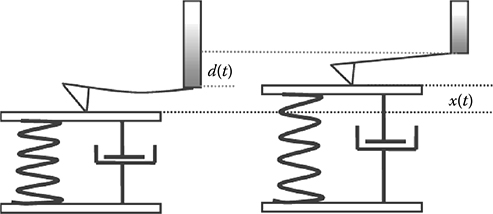
FIGURE 5.3
The modeling of viscoelastic material under AFM- based force- displacement measurement during the retraction process.
When Equations 5.5 and 5.6 are inserted into Equation 5.4, and one letsd = vt, where v is the velocity of the Z piezo motion, we have
where f0 = kcdcm − kxm is a constant during the approach process. The solution to the ordinary differential equation, Equation 5.7, can be used to evaluate deformation recovery x under the influence of values η.
5.2.2 QCM- D-Based Cell Membrane Peeling Model
The sensor disk causes the relative motion of the cell with regard to the fluid in the sensor chamber. The effect is similar to that of the cell under liquid shear flow. In the leading edge, the adhesion bonds between the integrin receptors and the substrate ligands will be ruptured due to the flow-caused cell strain; at the other edge, there will be bond formation activities attributed to the increased integrin and ligand affinity, as shown in Figure 5.4. The model in Figure 5.4b describes this peeling of focal adhesion between the cell and the substrate due to shear stress under liquid flow. In the 2D model, focal adhesion sites are characterized by the contact length, Lc, between the cell and the substrate. The substrate moves with speed vs, and the peeling speed is proportional to it according to vp = κvs, where κ is the coefficient. Focal adhesion is modeled as a spring with a coefficient of ka, whereas a single focal adhesion bond strength is fa = ka(l − λ), where l and λ are the lengths of the bond in the stretched and unstretched states, respectively. The total focal adhesion strength then becomes Fa = Naka(l − λ), where Na is the adhesion bond density. The adhesion kinetic equation specifies the balance for the formation and dissociation of adhesion bonds that determine the temporal- and spatial- dependent bond density Na(t,s) [26,27]:
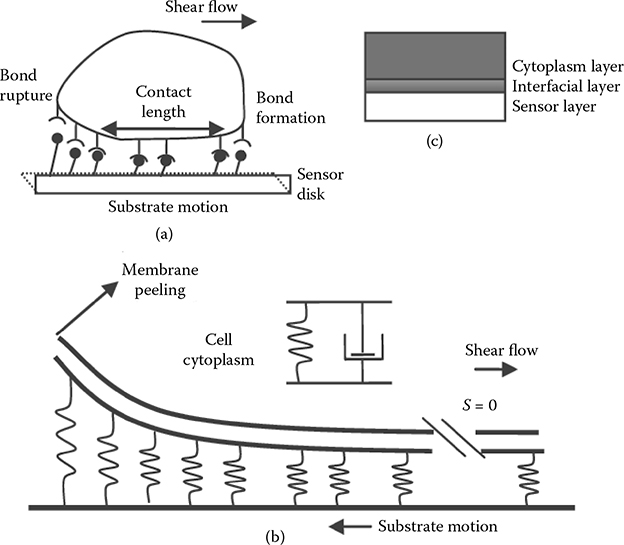
FIGURE 5.4
Cell membrane peeling model at the basal area (a, b); and the cell model as a whole (c) in which the cytoplasm is modeled as a Voigt element.
where is the ligand density on the substrate; is the cell surface receptor density; kf is the bond formation rate with an initial value of kf0; kr is the bond formation rate with an initial value kr0; and kts is the transient elastic constant of the adhesion bond. It is reasonable to assume that kts < ka for this model; kb is the Boltzmann constant; and T is the temperature. For the calculation of the energy dissipation rate, we have
and Equations 5.8–5.10 can be evaluated numerically by the fourth-order Runge–Kutta method with the initial value solved by
The total energy dissipation rate for the focal adhesion dissociation can be defined as
where wc is the effective width of the contact area.
5.3 Results and Discussion
The AFM measurement results before and after stimulation with EGF are shown in Figure 5.5a. The displacement was controlled below 2μm, and the resultant loading force was within 30 nM, with the corresponding maximum cell deformation less than 500 nM (<25% of cell height). These parameters were used throughout the force measurement process. The hysteresis area between the loading and unloading force curve (A − R), was increased from 3.2 to 6.9 femto- Joules (fJ) due to the stimulation, a 126% jump.
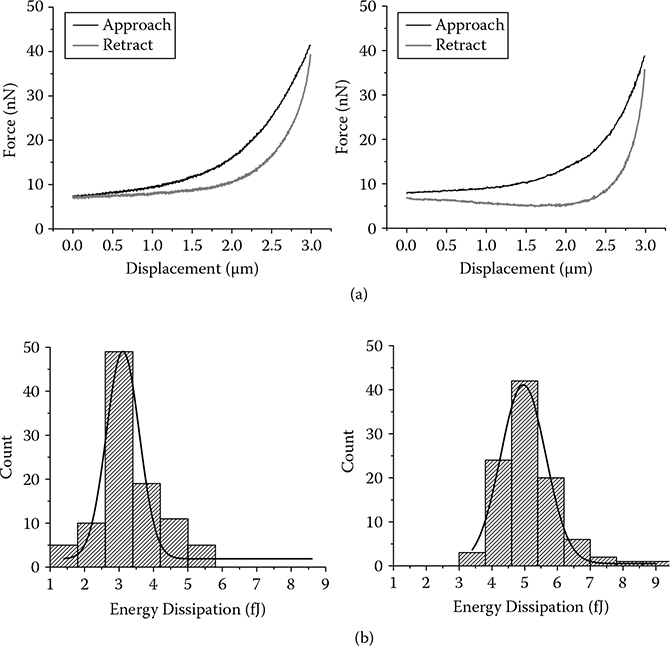
FIGURE 5.5
AFM energy dissipation measurement on 100 different cells with and without EGF treatment.
A statistical analysis was performed on a population of cells before and after EGF stimulation. The result is shown in Figure 5.5b. The cell sample was first measured under AFM on 100 randomly selected cells. EGF was then applied to the Petri dish where the cell sample sat in a final concentration of 40 nM. The sample was then incubated for 30 min until another AFM measurement was conducted on 100 randomly selected cells. The plotted results showed a normal distribution for energy dissipation before and after the EGF addition. It can be observed that energy dissipation increased from 3.26 ± 0.95 fJ to 5.16 ± 0.89 fJ (mean ± SD). This demonstrates that the cells displayed different mechanical properties after EGF stimulation than before.
Given this general trend shown by the cell population, we want to define how cells dynamically adjust their cytoskeleton structure throughout the stimulation process. We monitored the stimulation process dynamically in real time. After EGF stimulation, force– displacement curves were taken at a 1 Hz frequency. Figure 5.6 summarizes the dynamic response of the cells after EGF treatment. Three different EGF concentrations were tested: 10 nM, 20 nM, and 40 nM. The same volume of buffer solution was added in a separate control experiment. The baseline measurement was longer at 40 min before EGF or the control buffer was added. For all three dosages, a few minutes after the administration of EGF, there was an increase in energy dissipation, suggesting the effect of EGF is immediate; this increase continued until around 20 min when the response started to level off. At the end of the observation, the energy dissipation was twice the baseline value. The experimental result also showed that energy dissipation was dose-dependent, as revealed by a comparison of the three dosages. Larger energy dissipation was observed for the 20 nM and 40 nM EGF experiments than for 10 nM EGF experiments. The 40 nM dose had a slightly larger increase than the 20 nM dose, although the difference was small (Figure 5.6). Similar dynamics were observed for the hysteresivity measurement (Figure 5.6b).
The results of QCM-D continuous monitoring for 100 min after stimulation with EGF of dosages confirmed that the energy dissipation decreases over time. Stimulation with EGF of different concentrations showed that the dissipation decrease is clearly dosage dependent. Immediately after stimulation, the dissipation showed a sharp increase, then after about a half an hour it dropped down. The initial sharp increase in dissipation is caused by the liquid flush during the change of EGF- containing medium. Overall, energy dissipation decreased due to the stimulation. Figure 5.7 shows representative dose- dependent and time- dependent changes inΔD of the monolayer of A431 cells in response to EGF. Unlike the AFM results shown in Figure 5.6, whereζ increased with time and with dose, the QCM- D detected a decrease inΔD with time and with dose. As a mechanical property, the change in energy dissipation factorΔD measured directly by the QCM- D is analogous to hysteresivity,ζ, computed from the AFM measurements, where both quantities correspond to the mechanical energy loss relative to the energy input per measurement cycle.
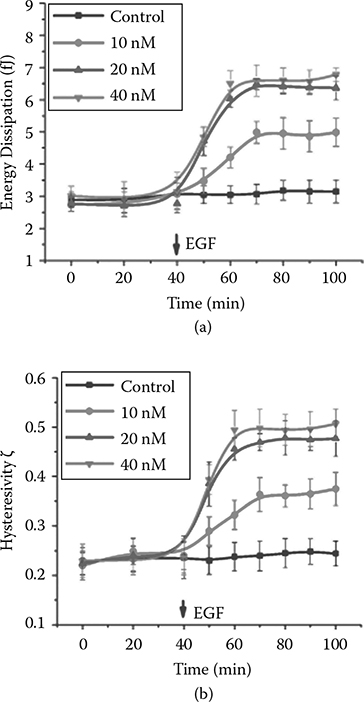
FIGURE 5.6
Dynamic mechanical responses. (a) Energy dissipation and (b) hysteresivity of A431 cells to stimulations with four different concentrations of EGF: 0, 10 nM, 20 nM, and 40 nM.
However, the two techniques probe different regions of the deposited cells; the AFM tip probes 500 nm into the cell from its top surface while the QCM-D senses approximately 100 nm up from the bottom surface of the sensor crystal.
Interestingly, responses for D and ζ reached their plateaus within a similar timeframe after the addition of the EGF (40–50 min for the decrease in ΔD and 50 min for the increase inζ). Both changes showed signs of saturation in a similar dose range (responses at 20 nM and 40 nM at very similar levels). These similarities indicate that both mechanical responses (D andζ) that were developed locally might be synchronously mediated by the same globe cell signaling pathway(s).
For pure elastic materials, there will be no energy dissipation. Accordingly, when an AFM force measurement is performed on a perfectly elastic material, the approach and retraction portions of the force– displacement curve overlap. However, for biological samples, viscosity is inherent, and research has shown that internal cellular components, such as the cytoplasm and even the cytoskeleton, are viscoelastic [28]. Therefore, typical force curves on biological samples in liquid display large hysteresis between the approach and the retraction curves.

FIGURE 5.7
QCM-D measurement of energy dissipation over time after EGF treatment with concentrations of 0 nM, 10 nM, 20 nM, and 40 nM.
The hysteresis between loading and unloading force curves indicates that the repulsive force at each displacement position in unloading is lower than in loading. The origin of the decreased repulsion on the unloading curve is that at any given nominal displacement the actual local separation is larger on retraction than on approach because it takes a finite time for the deformed cell surfaces to relax and to recover to their original shape. According to the modeling of the force– displacement process, as described in the previous section, the deformation– relaxation process can be plotted as shown in Figure 5.8. At the given deformation xm = 170 nm, an increase of the viscous factor η (from 0.35 to 0.45) will result in increased relaxation time. In other words, it takes longer for a cell with higher viscosity to recover from deformation, meaning at any given displacement, there will be a smaller repulsive force, resulting in a larger hysteresivity (ζ) and larger energy dissipation (A − R). This means that the cellular body will display increased viscous character when it has increased energy dissipation after EGF stimulation.
The energy dissipation from the QCM- D measurement is the sum of the energy dissipated in disruption of cellular adhesion Ea and the energy loss in the viscoelastic cytoplasm Ec: E = Ea + Ec. The EGF reduces the focal adhesion area and strength in A431 cells [3,29], which results in the decrease in Ea as shown by the adhesion peeling model described in previous section.

FIGURE 5.8
AFM energy dissipation simulation result shows that it takes longer time for the deformation to recover for a cell with higher viscosity η as indicated with η = 0.45 showing larger deformation overall.
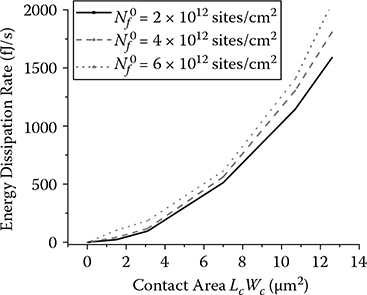
FIGURE 5.9
Cell peeling model simulation.
The simulation result in Figure 5.9 shows that the decrease in contact area A (x axis) as well as the reduced substrate adhesion ligand density (from 6 × 10¹² to 2 × 10¹² site/cm2) will reduce the energy dissipation rate (y axis). On the other hand, the loss of focal adhesion will cause cell rounding and swelling [3]. Our AFM nanoindentation measurements revealed that the cell body becomes more viscous after EGF stimulation. The increase in viscosity,η, in cell cytoplasm would induce relatively high damping and would increase the cytoplasm energy loss during the QCM-D measurement [15]. However, the QCM-D indicated a decrease in energy dissipation after EGF treatment, indicating that Ea dominates the energy dissipation process and Ec has minimal effect. The modeling of the wave propagation through the cellular material therefore should employ the multilayer configuration (Figure 5.4c). Cellular adhesion through focal adhesion complexes linking the cytoskeleton to the extracellular matrix (ECM) creates an interfacial layer between the cell membrane and the ECM, with a gap thickness ranging from 30 nm in the closest contact area to 100–250 nm in the remaining areas [30–32].
Evidence shows that the acoustic wave decays almost completely before reaching the cell cytoplasm [32], allowing energy dissipation in cellular adhesion to become the primary energy loss mechanism during the QCM-D measurement, which agrees with our experimental findings. Therefore, the characterization process benefits from the difference in measurement mechanisms of the two instruments. AFM performs nanoindentation on cell membranes with less than 500 nm deformation in a single-cell analysis fashion revealing cell cytoplasm properties, while QCM-D monitors the cell–ECM interfacial layer where focal adhesion dominates the energy dissipation. Therefore, AFM and QCM-D work in a complementary manner in the characterization of the changes in viscoelastic properties of the cell.
5.4 Conclusion
Cell signaling is one of the fundamental processes that control cell fate. It regulates the cell shape, and in turn, the cell mechanics. To identify the dynamic signaling pathway in situ, instruments and techniques that are capable of monitoring real-time mechanical property changes (such as viscoelasticity), as well as structural rearrangements, are crucial. AFM has been proven to be an effective instrument for visualizing cell membrane and cytoskeleton structures. It can also provide mechanical information with high temporal and spatial resolution. Meanwhile, the changes in the viscoelasticity can also be measured as the energy dissipation change of a cell monolayer by means of QCM-D. Our study pioneered a novel approach where AFM and QCM-D work in complementary fashion to characterize cellular viscoelastic properties during signaling-induced cell cytoskeleton remodeling. The use of these two techniques together facilitates the investigation of structural and mechanical biomarkers in cellular signaling processes. Knowledge of the changes in mechanical properties will provide us with more insight into the dynamics of cell signaling.
Acknowledgments
This research work was partially supported under NSF Grants IIS-0713346. The project described was also supported by Grant Number R43 GM084520 from the National Institute of General Medical Sciences of the NIH.
The authors would like to thank Dr. Chanmin Su of Veeco Instrument Inc. for his technical advice and help during the process of this research.
References
1. P. S. Grudinkin, V. V. Zenin, A. V. Kropotov, V. N. Dorosh, and N. N. Nikolsky, “Egf- induced apoptosis in a431 cells is dependent on stat1, but not on stat3,” European Journal of Cell Biology, vol. 86, no. 10, pp. 591–603, October 2007.
2. K. Oda, Y. Matsuoka, A. Funahashi, and H. Kitano, “A comprehensive pathway map of epidermal growth factor receptor signaling,” Molecular Systems Biology, vol. 1, 2005, doi: 10.1038/msb4100014384003.
3. M. Chinkers, J. Mckanna, and S. Cohen, “ Rapid rounding of human epidermoid carcinoma- cells A-431 induced by epidermal growth- factor,” Journal of Cell Biology, vol. 88, no. 2, pp. 422–429, 1981.
4. P. Janmey, “The cytoskeleton and cell signaling: Component localization and mechanical coupling,”Physiological Reviews, vol. 78, no. 3, pp. 763–781, July 1998.
5. S. E. Cross, Y.-S. Jin, J. Rao, and J. K. Gimzewski, “Nanomechanical analysis of cells from cancer patients,”Nature Nanotechnology, vol. 2, no. 12, pp. 780–783, December 2007.
6. A. Ridley, M. Schwartz, K. Burridge, R. Firtel, M. Ginsberg, G. Borisy, J. Parsons, and A. Horwitz, “Cell migration: Integrating signals from front to back,”Science, vol. 302, no. 5651, pp. 1704–1709, December 5, 2003.
7. D. Ingber, “Tensegrity I. Cell structure and hierarchical systems biology,”Journal of Cell Science, vol. 116, no. 7, pp. 1157–1173, April 1, 2003.
8. N. Wang, K. Naruse, D. Stamenovic, J. Fredberg, S. Mijailovich, I. Toric-Norrelykke, T. Polte, R. Mannix, and D. Ingber, “Mechanical behavior in living cells consistent with the tensegrity model,”Proceedings of the National Academy of Sciences of the United States of America, vol. 98, no. 14, pp. 7765–7770, July 3, 2001.
9. G. Binnig, C. Quate, and C. Gerber, “Atomic force microscope,”Physical Review Letters, vol. 56, no. 9, pp. 930–933, March 3, 1986.
10. E. Dimitriadis, F. Horkay, J. Maresca, B. Kachar, and R. Chadwick, “Determination of elastic moduli of thin layers of soft material using the atomic force microscope,”Biophysical Journal, vol. 82, no. 5, pp. 2798–2810, May 2002.
11. C. K. M. Fung, K. Seiffert-Sinha, K. W. C. Lai, R. Yang, D. Panyard, J. Zhang, N. Xi, and A. A. Sinha, “Investigation of human keratinocyte cell adhesion using atomic force microscopy,”Nanomedicine- Nanotechnology Biology and Medicine, vol. 6, no. 1, pp. 191–200, February 2010.
12. D. J. Mueller and Y. F. Dufrene, “Atomic force microscopy as a multifunctional molecular toolbox in nanobiotechnology,”Nature Nanotechnology, vol. 3, no. 5, pp. 261–269, May 2008.
13. S. E. Cross, Y.-S. Jin, J. Tondre, R. Wong, J. Rao, and J. K. Gimzewski, “AFM-based analysis of human metastatic cancer cells,”Nanotechnology, vol. 19, no. 38, September 24, 2008. doi: 10.1058/09574484/19/38/384003.
14. E. Barthel, “Adhesive elastic contacts: JKR and more,”Journal of Physics D- Applied Physics, vol. 41, no. 16, August 21, 2008.
15. F. Hook and B. Kasemo, “The QCM- D technique for probing biomacromolecular recognition reactions,” in Piezoelectric Sensors, Steinem, C. and Janshoff, A., Eds., 2007, vol. 5, Springer, New York, pp. 425–447.
16. M. Edvardsson, M. Rodahl, and F. Hook, “Investigation of binding event perturbations caused by elevated QCM- D oscillation amplitude,”Analyst, vol. 131, no. 7, pp. 822–828, 2006.
17. K. Glasmastar, C. Larsson, F. Hook, and B. Kasemo, “Protein adsorption on supported phospholipid bilayers,”Journal of Colloid And Interface Science, vol. 246, no. 1, pp. 40–47, February 1 2002.
18. C. Marxer, M. Coen, T. Greber, U. Greber, and L. Schlapbach, “Cell spreading on quartz crystal microbalance elicits positive frequency shifts indicative of viscosity changes,”Analytical and Bioanalytical Chemistry, vol. 377, no. 3, pp. 578–586, October 2003.
19. M. Voinova, M. Rodahl, M. Jonson, and B. Kasemo, “Viscoelastic acoustic response of layered polymer films at fluid- solid interfaces: Continuum mechanics approach,”Physica Scripta, vol. 59, no. 5, pp. 391–396, May 1999.
20. V. Saravia and J. L. Toca- Herrera, “Substrate influence on cell shape and cell mechanics: HepG2 cells spread on positively charged surfaces,”Microscopy Research and Technique, vol. 72, no. 12, pp. 957–964, December 2009.
21. O. Hayden, R. Bindeus, and F. Dickert, “Combining atomic force microscope and quartz crystal microbalance studies for cell detection,”Measurement Science and Technology, vol. 14, no. 11, pp. 1876–1881, November 2003.
22. S. Notley, M. Eriksson, and L. Wagberg, “Viscoelastic and adhesive properties of adsorbed polyelectrolyte multilayers determined in situ with QCM- D and AFM measurements,”Journal of Colloid and Interface Science, vol. 292, no. 1, pp. 29–37, December 1, 2005.
23. P. Hansma, H. Yu, D. Schultz, A. Rodriguez, E. A. Yurtsev, J. Orr, S. Tang, J. Miller, J. Wallace, F. Zok, C. Li, R. Souza, A. Proctor, D. Brimer, X. Nogues-Solan, L. Mellbovsky, M. J. Pena, O. Diez- Ferrer, P. Mathews, C. Randall, A. Kuo, C. Chen, M. Peters, D. Kohn, J. Buckley, X. Li, L. Pruitt, A. Diez- Perez, T. Alliston, V. Weaver, and J. Lotz, “The tissue diagnostic instrument,”Review of Scientific Instruments, vol. 80, no. 5, May 2009.
24. O. Klymenko, J. Wiltowska- Zuber, M. Lekka, and W. M. Kwiatek, “Energy Dissipation in the AFM Elasticity Measurements,”Acta Physica Polonica A, vol. 115, no. 2, pp. 548–551, February 2009, 42nd Zakopane School of Physics International Symposium Breaking Frontiers, Zakopane, Poland, May 19–25, 2008.
25. D. Johannsmann, “Viscoelastic, mechanical, and dielectric measurements on complex samples with the quartz crystal microbalance,”Physical Chemistry Chemical Physics, vol. 10, no. 31, pp. 4516–4534, 2008.
26. C. Dong and X. Lei, “Biomechanics of cell rolling: Shear flow, cell- surface adhesion, and cell deformability,”Journal of Biomechanics, vol. 33, no. 1, pp. 35–43, January 2000.
27. M. Dembo, D. Torney, K. Saxman, and D. Hammer, “The reaction-limited kinetics of membrane-to-surface adhesion and detachment,”Proceedings of the Royal Society B- Biological Sciences, vol. 234, no. 1274, pp. 55–83, June 22, 1988.
28. M. Puig-De-Morales-Marinkovic, K. T. Turner, J. P. Butler, J. J. Fredberg, and S. Suresh, “Viscoelasticity of the human red blood cell,”American Journal of Physiology-Cell Physiology, vol. 293, no. 2, pp. C597–C605, August 2007.
29. H. Xie, M. Pallero, K. Gupta, P. Chang, M. Ware, W. Witke, D. Kwiatkowski, D. Lauffenburger, J. Murphy- Ullrich, and A. Wells, “EGF receptor regulation of cell motility: EGF induces disassembly of focal adhesions independently of the motility- associated PLC gamma signaling pathway,”Journal of Cell Science, vol. 111, no. Part 5, pp. 615–624, March 1998.
30. K. Giebel, C. Bechinger, S. Herminghaus, M. Riedel, P. Leiderer, U. Weiland, and M. Bastmeyer, “Imaging of cell/substrate contacts of living cells with surface plasmon resonance microscopy,”Biophysical Journal, vol. 76, no. 1, Part 1, pp. 509–516, January 1999.
31. F. Li, J. H. C. Wang, and Q.-M. Wang, “Thickness shear mode acoustic wave sensors for characterizing the viscoelastic properties of cell monolayer,”Sensors and Actuators B- Chemical, vol. 128, no. 2, pp. 399–406, January 15, 2008.
32. J. Wegener, J. Seebach, A. Janshoff, and H. Galla, “Analysis of the composite response of shear wave resonators to the attachment of mammalian cells,” Biophysical Journal, vol. 78, no. 6, pp. 2821–2833, June 2000.