
6 Modeling and Experimental Verifications of Cell Tensegrity
Ning Xi, Ruiguo Yang, Carmen Kar Man Fung, King Wai Chiu Lai, Bo Song, Kristina Seiffert-Sinha and Animesh A. Sinha
CONTENTS
6.2 Decrease in Cell Stiffness Resulting from Desmosome Disruption
6.2.1 Decrease in Stiffness Resulting from Desmosome Disassembly
6.2.2 Decrease in Stiffness Resulting from AFM-Based Nanosurgery
6.3 Quantitative Modeling Based on Six Struts Tensegrity Structure
6.3.1 Without Intermediate Filaments
6.3.2 With Intermediate Filaments
6.4 Conclusion and Perspectives
6.1 Introduction
The tensegrity cell model is a qualitative modeling technique for adherent cells [1,2]. It has been proven to be consistent with the mechanical behavior of living cells [3]. The main concept in delineating the mechanical properties of cells is that the cell body is a tensional integrity structure, thus the name tensegrity [4]. The cytoskeleton behaves as a discrete mechanical network composed of three elements: microtubule, actin filament, and intermediate filament [5]. The three elements have different mechanical properties. The microtubule is the stiffest of the three and thus bears the compressional force when the cytoskeleton is compressed, while the actin filament and intermediate filament assume more tension when the cell is stretched [4]. Through the interconnected cytoskeletal network, cells maintain the structure integrity under different force interactions.
It is generally accepted that a cell can establish tensegrity force balance with its cytoskeletal network and the extracellular matrix (ECM) [1]. The ECM provides the external support for the force balance, in which the integrin of cells binds to ECM in the formation of the so- called focal adhesion complex [6]. The focal adhesion sites are discrete, nonuniform protrusion regions of the cell periphery [7]. They provide the linkage between the cell and ECM, and at the same time serve as the signaling transduction hub. They also host a cluster of proteins that behave as force sensors [7].
In tensegrity force balance, prestress in the filaments is a major factor governing cell mechanics. Under a certain force balance or structural configuration, a cell will have a corresponding prestress, and ultimately a certain level of elasticity that can generally be revealed by AFM probing. Thus, by measuring the elasticity of the cell either locally or globally [8], the prestress of the cell can be determined and its physical configuration can be predicted. Therefore, to determine whether cells can be modeled as tensegrity structures, one would need to tune the cell prestress by biochemically modifying its living conditions and monitoring whether the elasticity changes accordingly.
Metastatic adenocarcinoma cells show anchorage- independent growth patterns, and they become round in shape, whereas normal mesothelial cells show a large and more stretched morphology. Experiments have verified that the cancerous type is 70% less stiff [9]. From the force- balancing perspective, cells with weak focal adhesions should be less prestressed than cells with stronger and denser focal adhesions. An analogy can be drawn for the cells with focal adhesion of different strengths and a tent set up with a varied number of anchors to the ground. Another piece of evidence that signifies the difference in prestress lies in the cytoskeleton structure itself; when cells are less prestressed, they tend to have a disorganized actin filament network [10], a sign of less tensional forces in individual actin filaments.
The tensegrity modeling of adherent cells is normally about single cells, and only cell– ECM interaction is considered in most cases. Cell– cell interactions, although often ignored when considering cell anchorage, can also be a source of external support in terms of force balancing. As a special type of cell– cell adhesion structure, desmosome is one of the main cell– cell adhesion complexes in epithelial cells that provides mechanical strength to maintain the tissue integrity. Desmosome links the intermediate filaments of neighboring cells through a cadherin type of adhesion. From the development point of view, desmosomes from different layers of epidermis vary in size and appearance: the basal layer epidermis has less- organized desmosomes with smaller dimensions compared with desmosomes in the suprabasal layers [11]. Apparently, cells at the suprabasal layers are tougher and stronger. We speculate that when the desmosome becomes denser, cellular tension becomes stronger and the prestress becomes larger. All this evidence points to the idea that cell– cell adhesions, especially desmosomes, play an important role in providing external support just as focal adhesions do. In this study, we put this hypothesis to the test by modulating the cell– cell adhesions between neighboring cells using biochemical and mechanical methods, and were able to obtain quantitative stiffness data validating the change of cellular stiffness.
6.2 Decrease in Cell Stiffness Resulting from Desmosome Disruption
Keratinocyte is a major constituent of the epidermis and is abundant in desmosome- based cell– cell adhesions. As mentioned earlier, desmosomes provide the strength to maintain the mechanical integrity of the tissue by “spot- welding” the intermediate filaments from neighboring cells. Desmosomes are composed of a cluster of proteins to form a molecular structure. The desmosome complex employs cytoplasmic protein plaque to tether to the intermediate filament as illustrated in Figure 6.1. To disrupt the connection between neighboring cells would require the disassembly of the desmosome, which would release the intermediate filament linkage, which normally plays the role of anchor points. The disassembly of the desmosome would therefore remove the anchor points from the tensegrity structure and ultimately reduce the amount of stress in the system. This hypothesis was verified by two biochemical experiments.
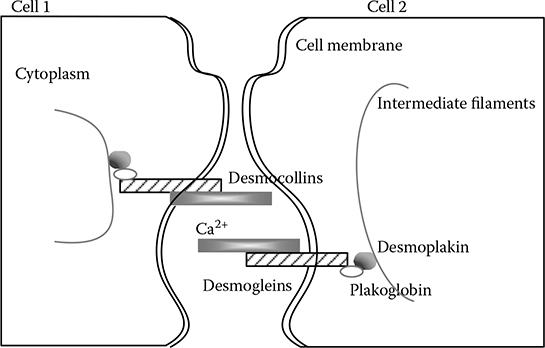
FIGURE 6.1
Desmosome structure with different desmosomal proteins connecting each other all the way to the intermediate filaments.
6.2.1 Decrease in Stiffness Resulting from Desmosome Disassembly
Desmosomes sometimes can be damaged in certain diseases, one of which is pemphigus vulgaris (PV), a potentially fatal autoimmune disease that targets one of the proteins in the complex, Dsg3 [12]. The binding of the autoimmune antibody causes the release of the protein from the complex and eventually leads to the disassembly of the desmosome structure. The damaged desmosome leads to the loss of cellular adhesion between neighboring keratinocyte cells and eventually causes blistering of the skin from the body fluid underneath the cells.
We tested the effect of the autoimmune antibody in vitro on keratinocytes. The administration of anti- Dsg3 antibody induced the loss of cellular adhesion structures. This was confirmed by comparing images obtained before and after the administration of the antibody. The AFM images show the enlarged spacing between neighboring cells, clear evidence of cell adhesion loss, as well as retracted filament structures from the cell periphery [13]. The topographical change is accompanied by a decrease in the cell stiffness as measured by AFM- based nanoindentation. The Young’s modulus value of normal cells dropped from 29.8 ± 4.9 to 18.6 ± 4.6 kPa for anti-Dsg3 antibody-treated cells.
In the AFM nanoindentation experiment, a silicon nitride cantilever (Bruker-nano, Santa Barbara, CA) was used, the spring constant of which is 0.06 N/m calibrated by the thermal tune method. The applied force can be calculated by Hooke’s law as F = kd, where d is the deflection of the cantilever and k is the spring constant of the cantilever. According to the Hertzian model, for a cone-shaped tip, the relation between indentation and deformation is defined as [14]
where α is the half angle of the cone- shaped tip, υ is the Poisson ratio, F is the applied force, δ is the indentation depth, and E is the Young’s modulus value. Young’s moduli can be generated by fitting the force– displacement curve. The half-open angle of the tip is 17.5° and we used 0.5 as the Poisson ratio. The force– displacement curves were processed with a MATLAB® routine to obtain Young’s modulus.
Since the formation of desmosomes requires the presence in the growth medium of Ca2+, which would form a covalent bond with the desmosomal protein Dsg [15] as shown in Figure 6.1, depletion of the Ca2+ in the growth medium hinders the formation of desmosomes between cells. AFM imaging shows a significant difference in terms of dimensions for cells cultured in normal growth medium and those from media with Ca2+ depleted. Normal cells are stretched with a diameter around 25 μm and a height around 1 μm, while calcium- depleted cells are rounded up with a diameter around 12 μm and a cell height around 3 μm. The stiffness of both types of cells was also measured and compared. The Young’s modulus values agree well with previous measurements for normal cells and antibody- treated cells. The stiffness decreases from 35.6 ± 3.5 kPa to around 22.3 ± 2.9 kPa for normal and calcium-depleted cells in Figure 6.2. These biochemical methods indeed verified that disruption of the desmosome would lead to a decrease in cellular stiffness, an indication of reduced prestress in the tensegrity- based cytoskeletal structure. The release of the intermediate filament connection was induced by desmosome disassembly or nonformation. We then demonstrated that by severing the intermediate filament mechanically and directly we could also achieve a similar effect.
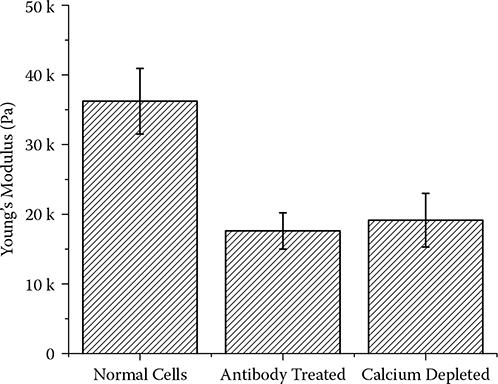
FIGURE 6.2
Young’s modulus comparison for normal and calcium- depleted cells.
6.2.2 Decrease in Stiffness Resulting from AFM- Based Nanosurgery
Imaging of AFM is the direct result of the scanning motion driven by the XY direction piezo actuation unit. From the motion control perspective, the zigzag- shaped driving voltage is applied to the XY piezo scanner, causing a linear motion back and forth with a predefined frequency. However, this is not the case for a nanomanipulation operation, where the position of the tip is not linearly related to an applied signal/voltage and the applied voltage should be an arbitrary shape rather than a zigzag. In addition, most nano-manipulation operations on biological samples are performed in liquid. Thus, the viscoelasticity of the sample requires a higher response frequency, and the control system should be upgraded to meet this demand. The upgraded hardware and software configurations convert a commercial AFM to a nanobiomanipulation-oriented AFM. The technical details of the development of motion controllers can be found in [16]. In brief, we used a signal access module to provide all the signals needed for the external control of the manipulation operation by the Linux controller with data acquisition cards as the interface. The joystick is the command input where all the motions start, enabling the precision manipulation of nanoscale objects with force feedback (diagram shown in Figure 6.3). By utilizing the AFM tip as a robotic arm, the capability of AFM can be extended greatly.
By human-controlled AFM nanorobotic operation, the intermediate filaments can be dissected bundle by bundle to isolated neighboring cells. Bundles of intermediate filaments can be cut off precisely with less than 100 nm resolution in height by controlling the AFM tip position over the intercellular junction area, and maintaining a constant normal force that is large enough to penetrate the cell membrane; the resulting lateral force would therefore sever the filament structures underlying the cell membrane. The intermediate filament bundles on the top were removed and replaced with a trench. The height difference is around 100 nm as magnified in the cross section with the circles. Intermediate filaments from individual cells, therefore, can be dissected entirely or partially by repeating the nanosurgery operation.
Stiffness data was also collected before and after the dissection operation from AFM- based nanoindenation. The obtained Young’s modulus value decreases from 32.1 ± 2.8 kPa to 18.8 ± 2.0 kPa (Figure 6.4). The well- connected cells with intact cell– cell adhesion are around 1.5 times stiffer than the cells whose intermediate filaments are cut loose. When cells are modeled as tensegrity, prestress determines the mechanical response of the whole cytoskeleton structure to external load such as the nanoindentation force from the probe. With less external support from intermediate filaments of their neighbors, cells would have to establish a new force balance, one which presumably receives no contribution from tension in the intermediate filaments. Theoretical calculation was then performed to verify the stiffness change with and without intermediate filament tensions in the structural model.
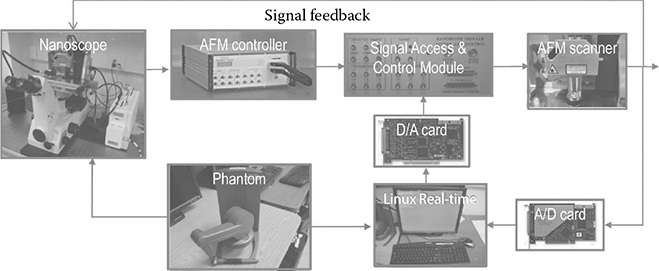
FIGURE 6.3
AFM-based nanorobotic system used for the nanodissection.
6.3 Quantitative Modeling Based on Six Struts Tensegrity Structure
The structure model shown in Figure 6.5 with 6 struts (thick lines) and 24 cables (thin lines) was originally developed by Ingber [17] as a conceptual model for cellular tensegrity (Figure 6.5a). It is constructed by connecting the ends of compressional struts with the tensional cables. The struts mimic the role of the microtubule in the cytoskeleton, while the cables denote the actin filaments. Considering that actin filaments normally lie beneath the cell membrane and are abundant at the cell peripheral [5], the design ensures that all the tensional cables for microfilaments are at the boundary of the structure. Since in each direction we have a symmetric structure of two struts, the same notation is used for both struts in each direction, as AA, BB, and CC. The length of each strut is L, and the distance between them is s = L/2. The distance between each pair of notes (the cable length of AB, BC, or AC) is l.
To quantify the relationship between the stress and the strain, a signature characteristic of mechanical behavior, parallel loads are applied to both ends of the structure in one direction. A force of T/2 is applied to each node of C along the x direction to stretch the structure. At this configuration and with the applied load, we want to find out the relationship between the strain and the stress, or in other words, the modulus in the load direction.
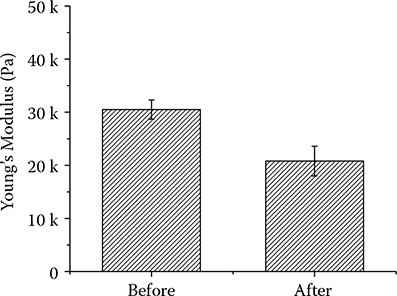
FIGURE 6.4
The stiffness response before and after AFM- based nanodissection.
By the virtual work method, we define that the work of T on an incremental extensionδsX per unit reference volume V of the model equals the work of uniaxial stress on the incremental change in uniaxial strainδeX, a relationship captured in Equation 6.2.
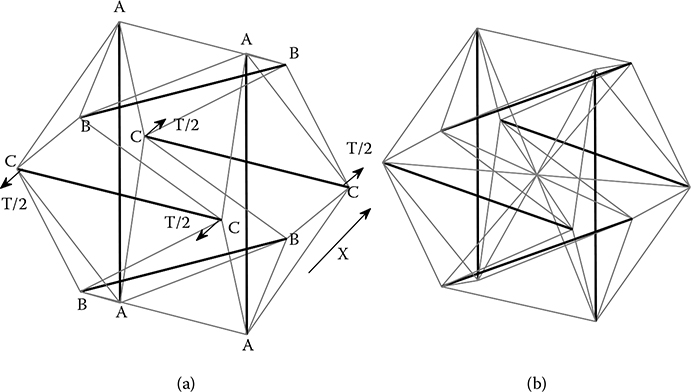
FIGURE 6.5
(a) The configuration of the tensegrity structure without intermediate filaments, the thick lines indicate the microtubule as the compressive elements and the thin lines indicate the actin filament as the tensional elements; (b) the structure with intermediate filament (originated from the center).
where eX and sX denote the strain and extension in the X direction, and σX denotes stress in the same direction. Since we know the dimensions of the structure, we can calculate the volume (V) enclosed by it as in Equation 6.3:
Strain is defined as the unit extension, so we have
From Equation 6.4 and considering the distance between the parallel struts, it follows that
Through substitution, Equation 6.3 becomes
Thus,
By definition of the modulus as the ratio between strain and stress in the X direction:
Taking the derivative of Equation 6.6, we obtain the relationship between strain and stress:
Substituting Equation 6.8 into Equation 6.7, we arrive at the expression of the modulus as
The E* in Equation 6.9 is the Young’s modulus obtained from the structural derivation, and it will be applied to the structure both with and without intermediate filaments by plugging in the dT/dsX from the two structures.
6.3.1 Without Intermediate Filaments
From Equation 6.9, we found the expression of E* that is written in terms of dT/dsX. We only need to find the relation between the force T and the distance between the struts sX. For the configuration without the intermediate filaments, the calculation is as follows. The relationship between the force T and the extension is
where FAB and FAC are the forces in the corresponding cable. The kinematics of the configuration in Figure 6.5a is
If we assume that the cables are linearly elastic of stiffness k and resting length lr, the force then in each cable is given as
By plugging the kinematics of the structure in Equation 6.11 and the force expression in Equation 6.12, we have the relationship between T and sX. Taking the derivation of that, we can obtain dT/dsX. This derivation will be evaluated in the initial state (the reference state) where the parameters are
After plugging in these parameters, we obtain
Plugging into Equation 6.9 we have the definition of E* in the configuration without the intermediate filament
where ε0 is the initial cable strain, defined as
6.3.2 With Intermediate Filaments
The structures with intermediate filaments are shown in Figure 6.5b. The lines connecting the nodes in the middle are intermediate filaments. This structure is introduced by considering the fact in biology that the intermediate filaments are projecting from the nucleus to the periphery of the cell [5]. Thus, the designed structure has a tensional cable connecting each pair of struts and the cable all crossing the center O. With these additional structural components, the kinematics for the actin filament remains, while the kinematics for the intermediate filament can be characterized as
With the addition of intermediate filament structures, some force balance establishment has to take into consideration the tension in the intermediate filament forces in NOA, NOB, and NOC. The force balance now has been reconfigured and can be expressed as
The force in each of the tensional elements including the actin filaments and the intermediate filaments can then be expressed by Hooke’s law. For actin filaments, it remains the same as the previous configuration in Equation 6.12. For intermediate filaments, a second-order elastic element was added with elastic constant k2 on the basis of a first-order elastic element:
where rr is the reference length (zero tensional force) for the intermediate filaments.
To find the relationship between the applied load T and the displacement sX, we can plug the kinematics into the force balance in Equation 6.16 and replace the force with the expressions in Equation 6.17. We then have the static balance condition with the intrinsic parameter of the components and the kinematic. Using the same procedure as in the previous configuration, we can take the spatial derivative of T with respect to sX to obtain dT/dsX. This derivative will be evaluated at the initial state with the following parameters:
After evaluation under the initial conditions, the derivative
can be plugged into Equation 6.9, so that we have E*with:
where
defines the contribution from the stress in the actin filament;
defines the contribution from the linear portion (F1, k1) of the intermediate filament; and
defines the contribution from the quadratic portion (F2, k2) of the intermediate filament. Compared with EF0 and EF1, EF2 is much smaller and therefore can be neglected. We can assume that the intermediate filament can also be modeled as a first-order Hooke relation. However, EF1 and EF0 are comparable, and thus EF1 will make a difference for the modulus with an intermediate filament structure.
TABLE 6.1 Parameter List for the Numerical Evaluation
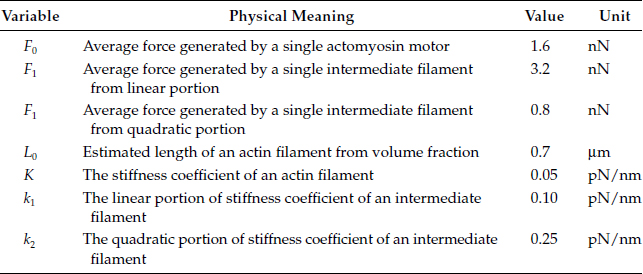
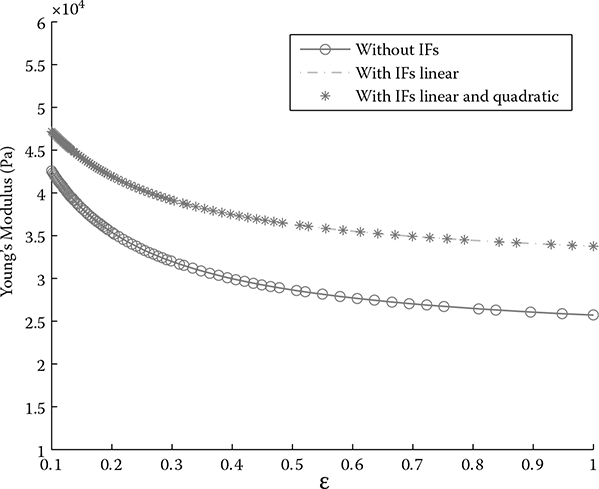
FIGURE 6.6
Young’s modulus comparison with and without intermediate filaments from simulation based on the structure model.
With the intrinsic parameters of individual filaments obtained from [17], we can calculate the Young’s modulus values numerically. The parameters used in the calculation are shown in Table 6.1. The plotting in Figure 6.6 shows the comparison of Young’s modulus values with respect to the strain for three different situations, without intermediate filaments, with intermediate filaments in only the linear portion, and with intermediate filaments containing both linear and quadratic terms. The curve for the linear portion of the intermediate filaments overlaps with the one containing both linear and quadratic portions. This also confirms that EF2 is negligible. The Young’s modulus with intermediate filaments in the configuration increased by 18% at the upper boundary when ε0→ 1. The trend is also indicative of the contribution from the intermediate filaments; that is, when the strain increases, the stiffness difference also increases. This agrees well with the functional contribution of intermediate filaments in the cytoskeleton system. They are responsible for maintaining the shape when there is large strain or deformation [5].
6.4 Conclusion and Perspectives
In this study, we validated that intercellular adhesion is part of the mechanism employed by epithelial cells to achieve force balance in a cytoskeleton-based tensegrity structure. We used AFM-based nanorobotics to dissect the cell– cell adhesion between kerationcyte cells, primarily the intermediate filament structures. The mechanical behavior data were subsequently obtained and a significant decrease in cellular stiffness was observed. A linkage between the integrity of cell– cell adhesion and the stiffness of the cell structure can be built. The cell adhesion loss was also induced biochemically by antibody treatment and calcium depletion, which resulted in a disrupted desmosome structure. Both methods yield cell samples that behave similarly to when cell– cell adhesion was cut loose mechanically, and a decrease in stiffness was observed as expected. The findings were then tested by a tensegrity structural model with and without intermediate filaments; the simulation result verifies the reduction in Young’s modulus values when there is no extra tensional element provided by the intermediate filament. Thus far, the hypothesis was validated that epithelial cells employ cell– cell adhesion as a complementary mechanism to cell– ECM adhesion to sustain their mechanical integrity during cell remodeling. This research may provide some insights into the development of new cell growth environments by taking into consideration cell– cell adhesion beyond cell– ECM interactions.
Acknowledgments
This research work was partially supported under NSF Grants IIS-0713346. The project described was also supported by Grant Number R43 GM084520 from the National Institute of General Medical Sciences of the NIH.
The authors would like to thank Dr. Chanmin Su of Veeco Instrument, Inc., for his technical advice and help during the course of this research.
References
1. D. Ingber, “Tensegrity I. Cell structure and hierarchical systems biology,”Journal of Cell Science, vol. 116, no. 7, pp. 1157–1173, April 1, 2003.
2. N. Wang, K. Naruse, D. Stamenovic, J. Fredberg, S. Mijailovich, I. Toric-Norrelykke, T. Polte, R. Mannix, and D. Ingber, “Mechanical behavior in living cells consistent with the tensegrity model,”Proceedings of the National Academy of Sciences of the United States of America, vol. 98, no. 14, pp. 7765–7770, July 3, 2001.
3. D. Ingber, “Tensegrity II. How structural networks influence cellular information processing networks,”Journal of Cell Science, vol. 116, no. 8, pp. 1397–1408, April 15, 2003.
4. D. Ingber, “Tensegrity: The architectural basis of cellular mechanotransduction,” Annual Review of Physiology, vol. 59, pp. 575–599, 1997.
5. B. Alberts, A. Johnson, J. Lewis, M. Raff, K. Roberts, and P. Walter, Molecular Biology of the Cell, Fifth Ed. New York: Garland Science, 2007.
6. G. Plopper, H. Mcnamee, L. Dike, K. Bojanowski, and D. Ingber, “Convergence of integrin and growth-factor receptor signaling pathways within the focal adhesion complex,”Molecular Biology of the Cell, vol. 6, no. 10, pp. 1349–1365, October 1995.
7. M. Wozniak, K. Modzelewska, L. Kwong, and P. Keely, “Focal adhesion regulation of cell behavior,”Biochimica et Biophysica Acta- Molecular Cell Research, vol. 1692, no. 2–3, SI, pp. 103–119, July 5, 2004.
8. P. Carl and H. Schillers, “Elasticity measurement of living cells with an atomic force microscope: Data acquisition and processing,”Pflugers Archiv- European Journal of Physiology, vol. 457, no. 2, pp. 551–559, November 2008.
9. S. E. Cross, Y.-S. Jin, J. Rao, and J. K. Gimzewski, “Nanomechanical analysis of cells from cancer patients,”Nature Nanotechnology, vol. 2, no. 12, pp. 780–783, December 2007.
10. F. Li, J. H. C. Wang, and Q.-M. Wang, “Thickness shear mode acoustic wave sensors for characterizing the viscoelastic properties of cell monolayer,”Sensors and Actuators B- Chemical, vol. 128, no. 2, pp. 399–406, January 15, 2008.
11. K. Green and C. Gaudry, “Are desmosomes more than tethers for intermediate filaments?”Nature Reviews Molecular Cell Biology, vol. 1, no. 3, pp. 208–216, December 2000.
12. C. Pincelli, “Apoptosis in pemphigus,”Journal of Investigative Dermatology, vol. 126, no. 10, p. 2351, Oct. 2006.
13. C. K. M. Fung, K. Seiffert- Sinha, K. W. C. Lai, R. Yang, D. Panyard, J. Zhang, N. Xi, and A. A. Sinha, “Investigation of human keratinocyte cell adhesion using atomic force microscopy,”Nanomedicine- Nanotechnology Biology and Medicine, vol. 6, no. 1, pp. 191–200, February 2010.
14. A. Touhami, B. Nysten, and Y. Dufrene, “Nanoscale mapping of the elasticity of microbial cells by atomic force microscopy,”Langmuir, vol. 19, no. 11, pp. 4539– 4543, May 27, 2003.
15. R. Windoffer, M. Borchert-Stuhltrager, and R. Leube, “Desmosomes: Interconnected calcium- dependent structures of remarkable stability with significant integral membrane protein turnover, ”Journal of Cell Science, vol. 115, no. 8, pp. 1717– 1732, April 15, 2002.
16. R. Yang, N. Xi, K. Lai, B. Gao, H. Chen, C. Su, and J. Shi, “Motion controller for the Atomic Force Microscopy based nanomanipulation system,” IEEE International Conference on Intelligent Robots and Systems, pp. 1339–1344, September 2009.
17. D. Stamenovic and M. Coughlin, “The role of prestress and architecture of the cytoskeleton and deformability of cytoskeletal filaments in mechanics of adherent cells: A quantitative analysis,”Journal of Theoretical Biology, vol. 201, no. 1, pp. 63–74, November 7, 1999.