
2 Modeling and Simulation of Silicon Nanowire-Based Biosensors
Guangyong Li, Yucai Wang and Quan Tao
CONTENTS
2.2 The Basics of SiNW-Based FET Biosensors
2.4 Simulation Results and Discussions
2.4.1 Surface Potential on SiNW
2.4.2 I-V Characteristics of SiNW FET Biosensors
2.5 Conclusions and Perspectives
2.1 Introduction
Quasi-one-dimensional semiconducting nanowires are considered the best candidates among transducer elements for biosensing because of their appealing characteristics such as high sensitivity due to the quantum confinement and the large surface-to-volume ratio, high stability due to the crystal structure, and potential to be configured as field-effect transistors (FETs). Several pioneering studies have demonstrated the success of direct electrical detection of biological macromolecules using carbon nanotubes [1-3], semiconducting nanowires [4-9], and conducting polymer nanofilaments [10,11]. Among these biosensors, silicon nanowire (SiNW)-based biosensors (Figure 2.1) are considered promising label-free biomolecule detectors because of their compatibility with microelectronics and their great stability in liquid condition. Label-free SiNW-based biosensors configured as FETs can detect the target/receptor binding events that affect the local chemical potential on the surface of nanowires. The local potential on the surface of nanowires effectively works as a "gating" voltage that modulates the source (S) to drain (D) current.
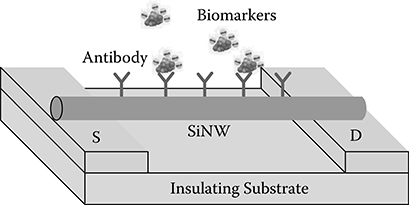
FIGURE 2.1
SiNW biosensor configured as an FET, where the gating voltage comes from the biomarkers.
Despite advances in experimental study, the underlying detection mechanism of SiNW-based FET biosensing is not well understood, and the path for future optimization in sensitivity needs to be elaborated. Simulation studies will not only help us understand the physics of biosensing using SiNW-based FETs but also provide guidance for optimized design of the devices such as the size of the nanowires, the dimension of the devices, the packing density of antibodies, and the concentration of the electrolyte.
In this chapter, we presents a comprehensive simulation study on single SiNW-based FET biosensors for detecting biotin/streptavidin binding [12,13]. The biotin/streptavidin system exhibits the strongest non-covalent biological interaction known and is widely demonstrated as a model system to study bio-recognition between proteins and other biomolecules [14]. Thus, understanding the detection mechanism of biotin/streptavidin binding using SiNW-based FET biosensors is of special interest since this can serve as a stepping stone to improving the sensitivity of SiNW-based FET biosensors.
2.2 The Basics of SiNW-Based FET Biosensors
The general schematic of a SiNW FET biosensor is shown in Figure 2.2a. A SiNW core is placed on a silicon dioxide substrate with its two ends connected to two electrodes (source and drain). The SiNW core is enveloped by a silicon oxide layer whose surface is functionalized with specific receptor molecules (Y), which can recognize and bind only to the target molecules (flower). The SiNW is immersed in the electrolyte, which contains target molecules as well as positively charged (e.g., Na+) and negatively charged (e.g., Cl−) ions. A back gate electrode (UBG) and a reference electrode (UG) are connected to the system to adjust the bulk electrolyte potential. The electrolyte is used as a buffer solution that resists pH change upon the addition of a small amount of acid or base, or upon dilution. The target molecules diffuse through the solution and reach the SiNW, are captured by the receptor molecules, and finally bind the receptor molecules on the silicon oxide surface. Many biomolecules carry charges under normal physiological conditions. For example, DNA carries negative charges, whereas the net charges of protein depend on the pH value of the electrolyte. The charges of the bound target molecules interact with the charge in the SiNW and modulate the conductance of the SiNW. The changes of the SiNW conductance can be used to measure the concentration of the target molecules in the buffer solution, and thus derive the original concentration of the target molecules in the source sample.
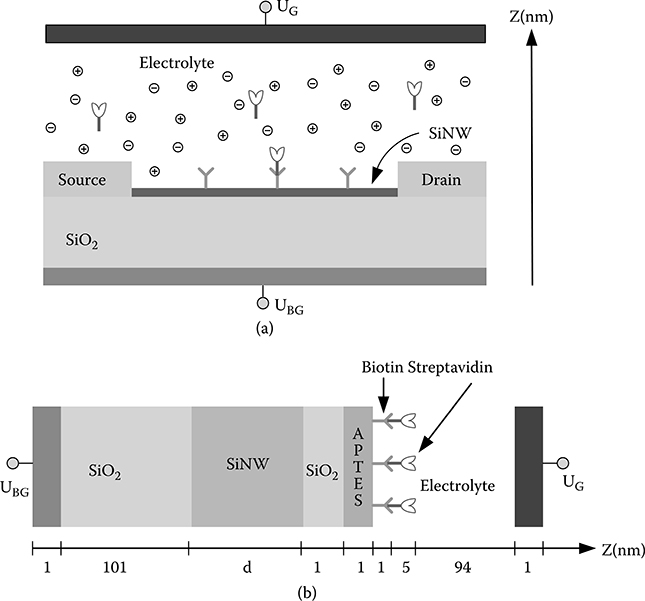
FIGURE 2.2
(a) General schematic of SiNW FET biosensor for detection of biotin/streptavidin binding. The surface of SiNW is functionalized with receptors (Y) for target biomolecules (flower). (b) Cross-section of SiNW FET biosensor for detection of biotin/streptavidin binding between the source and drain region along the z axis. On the surface of SiNWs there is a native oxide that is covalently bound to a layer of APTES molecules, and biotin molecules are chemically attached to the APTES surface. The biosensor is immersed in aqueous solution to detect streptavidin in the solution. The numbers denote the dimensions of various layers along the z axis.
Biotin molecules cannot be directly immobilized on the silicon oxide surface. A layer of aminopropyltriethoxysilane (APTES) molecules is covalently bound to the silicon oxide surface, and biotin molecules (receptor molecules) are chemically attached to the APTES surface. Streptavidin molecules in aqueous solution can be specifically bound to biotin molecules. Figure 2.2b shows the cross-section view of the SiNW FET biosensor along the z axis. Here, we assume the thickness of the silicon oxide substrate is about 100 nm, the thickness of the silicon oxide layer enveloping the SiNW core is 1 nm, and the thickness of the APTES molecule layer is 1 nm. The dimensions of the biotin molecule and the streptavidin molecule are 0.52 nm × l.00 nm × 2.10 nm and 4.5 nm × 4.5 nm × 5.0 nm, respectively. So we model the biotin and streptavidin molecules as spheres and assume the thickness of biotin layer is 1 nm and the thickness of streptavidin is 5 nm. The electrolyte (NaCl solution with various concentrations; pH value is assumed as 7) region is 100 nm, and the thickness of metal electrode is 1 nm. The length, diameter (denoted as d) and the doping density (assuming a p-type doping) of the SiNW are variable.
2.3 Theoretical Approaches
To detect the biotin/streptavidin binding in the electrolyte, generally two states of the SiNW FET biosensor should be simulated. In the first state, only the receptor molecules (biotin) are attached to the APTES layer surface. In the second state, the target biomolecules (streptavidin) are attached to the biotin surface due to specific binding. The change of charge distribution arising from the biotin/streptavidin binding modulates the electrostatic potential on the silicon oxide surface of the SiNW, and hence modulates charge distribution inside the SiNW core. As a consequence, the current flows in the SiNW will be changed accordingly. The I-V characteristics of the SiNW can be examined to determine the sensitivity of the biosensor.
Using the drift-diffusion charge transport model, the carrier transport in the SiNW core can be written as [15]
where q is elementary charge, J is the current density, μ is the mobility of the carriers, n is the carrier density, Φ is the electric potential, and D is the diffusion coefficient. The subscripts e and h denote electron and hole, respectively. The relationship between the electrostatic potential and the carrier concentrations can be described using Poisson's equation,
where ɛSi is the dielectric constant of silicon, r is the spatial coordinate, and ND and NA are the donor and acceptor concentrations within the SiNW, respectively. Here we assume the dopants are completely ionized.
In the silicon oxide layer, we assume that there is no defect in the native oxide and neglect any interface traps and fixed oxide charges. The electrostatic potential in the silicon oxide is given by Poisson's equation,
where ɛox is the dielectric constant of silicon oxide.
The APTES molecule layer serves as a passivation layer, and no charge carriers are assumed to be present within this layer. Similarly, the electrostatic potential in the APTES molecule layer is given by Poisson's equation,
where ɛAPTES is the dielectric constant of APTES molecule layer.
In SiNW FETs, the gate voltage is externally applied via a gate electrode enveloping the silicon oxide layer. In SiNW FET biosensors, no gate electrode is present, and the gate voltage is determined by solving the nonlinear Poisson-Boltzman equation (NPBE) [16],
where ρfixed is the charge density in the biotin layer and the bounded streptavidin molecules, and ρmobile is the charge density of mobile ions in the electrolyte, which accounts for the Debye screening effect. The dielectric constant of electrolyte is shown as ɛr. The fixed charge density ρfixed can be modeled using the delta function,
where N is the number of fixed charges present, zi and r. are their charges and positions, and δ(r) is the Dirac delta function. The distribution of mobile charge density ρmobile can be described using the Boltzmann distribution,
where Nions is the number of the mobile ions, zj is the charge of the ion, n∞ is the concentration of the ions at a distance of infinity from the solute, and Φ is the electrical potential. KB is Boltzmann's constant, and T is the absolute temperature.
For the special case of a 1-1 electrolyte (e.g., Na+-Cl-) with bulk concentration n, ρmobile can be written as [17]
where
is the Debye-Hückel screening parameter. κ−1 is called the Debye screening length, an important parameter to characterize the thickness of the electrical double layer. For the special case of a 1-1 electrolyte (e.g., Na+−Cl−), Debye length versus electrolyte concentration is illustrated in Figure 2.3 and listed in Table 2.1. The SiNW can sense only charged molecules within the Debye screening length. The charged molecules beyond the Debye screening length will be screened by the ions in the electrolyte. As can be seen, NaCl concentrations larger than 10 mM are not suitable for detection of the biotin/streptavidin binding because part of the charge on the biomolecules will be screened (Figure 2.4). The lines in Figure 2.4 show the different Debye screening lengths (from SiNW to the lines, not scaled here) according to different NaCl concentrations. Apparently, higher NaCl concentrations result in shorter Debye screening lengths.
Physically, the electrostatic potential function Φ(r) should be continuous at the interface of the various layers. Also, for the infinite domain, the electrostatic potential at infinity should be zero, i.e., Φ(∞) = 0. As long as we find the solution for the NPBE of Equation 2.5, the electrostatic potential in other layers can be solved by applying the continuous condition. And finally we can get the current density inside the SiNW using Equation 2.1.
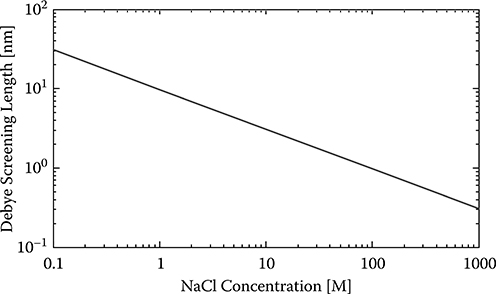
FIGURE 2.3
Debye screening lengths versus different NaCl concentrations.
TABLE 2.1
Debye Screening Lengths versus Different NaCl Concentrations
NaCl Concentration |
Debye Screening Length (nm) |
0. 1 mM |
30.79 |
1 mM |
9.74 |
10 mM |
3.08 |
100 mM |
0.97 |
1 M |
0.31 |
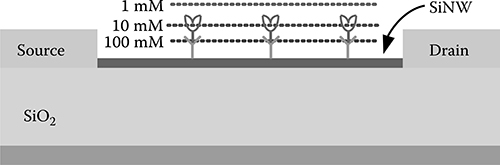
FIGURE 2.4
Debye screening scheme (the distance is not to scale).
The protein carries a net charge if the pH value of the electrolyte is not equal to the isoelectric point (pI) value of the protein. The protein net charge at a given pH value can be estimated using the Henderson-Hasselbalch equation [18].
where a is the fractional dissociation of any ionizable group [18] and pKa is the acid dissociation constant. In the charge determination procedure [19], the pKa for each type of ionizable group is assigned a magnitude. Knowledge of the amino acid sequence (or composition) of a protein is then used to calculate the net charge. The protein net charge arising from n ionizable groups of type i, (Zp)i, is given by [18]
if the ionizable group, i, is anionic (zi is negative), or
if the ionizable group, i, is cationic (zi is positive). The pKa value of biotin is 4.66 [20], so at pH = 7, each biotin molecule carries a net charge of α = 1/(1+104.66−7) ≈ -1q. This result coincides with the experimental result in Reference 21.
The net charge of streptavidin is contributed by terminal amino acids and charged amino acid side-chains within the protein sequence [22]. It can be determined by computer programs given the protein sequence data and a set of pKa values for proton dissociation from ionizable groups [19]. A web-based server H++ [23,24] can be used to calculate the net charge of streptavidin. Given atomic resolution Protein Data Bank (PDB) structures, H++ can perform a quick estimate of pKa values as well as the protein net charge at a specific pH value. At a pH value of 7, the calculated net charge for a streptavidin molecule is +9q (9 positive elementary charges) and −q (1 negative elementary charge) for a biotin molecule. Based on the net charge of biotin and streptavidin molecules, along with the dimension information of the SiNW, we can estimate the interface charge density ρ within the biotin layer before and after the binding of streptavidin molecules.
2.4 Simulation Results and Discussions
2.4.1 Surface Potential on SiNW
In general, the NPBE of Equation 2.5 can be solved using only computational methods due to the rapid exponential nonlinearities, discontinuous coefficients, delta functions, and infinite domain. And the accuracy and stability of the solution to the NPBE are quite sensitive to the boundary layer between the electrolyte and the biomolecules, which defines the solvent-accessible surface. In this work, we employ a nanodevice simulator nextnano3 [25] to solve the NPBE and to find the electrostatic potential values in the electrolyte, APTES molecule layer, and silicon oxide layer. The nextnano3 uses the Gouy-Chapman theory [17] to solve the NPBE for a one-dimension planar ion-selective field-effect transistor (ISFET) biosensor [26].
There are several key assumptions in the Gouy-Chapman theory. One is that the surface of the ISFET biosensor is infinite and planar, so that the interface between the biomolecules and the electrolyte can be described as an infinite plane that separates two regions, each with a different dielectric constant. Another one is that the surface of the ISFET biosensor is assumed to contain a constant fixed charge density ρ, with unit of charge per area. Under these assumptions, the electrostatic potential in the electrolyte is dependent on only the distance z from the membrane surface. For our SiNW FET biosensor, the electrostatic potential is dependent on only the distance r from the APTES molecules layer along the radius direction of the SiNW. Thus, it is feasible to use nextnano3 to solve the NPBE for our SiNW FET biosensor. And the critical step is to calculate the interface charge density ρ, that is, the charge density in the biotin layer before and after the binding of streptavidin molecules.
Nextnano3 needs the following parameters to calculate the electrostatic potential in the electrolyte, APTES molecules layer, and silicon oxide layer: the dimension information of various layers and the electrolyte, the doping density of the SiNW, the ion (NaCl) concentration of the electrolyte, the interface charge density ρ, and the voltages applied on electrodes UBG and UG. The dimension information on various layers and electrolyte is shown in Figure 2.2b. The interface charge density ρ can be calculated using the dimension information and the net charge of biotin/streptavidin. The voltages applied on electrodes UBG and UG are set to zero. Now we are ready to calculate the electrostatic potential corresponding to different SiNW diameters, doping densities, and ions concentrations of the electrolyte.
The APTES surface potential change ΔΦs is defined as
where n denotes the number of streptavidin molecules bound to the avidin molecules, and is the reference voltage when no streptavidin molecules are bound to the avidin molecules. For a SiNW with diameter d = 10 nm, doping density p = 1015cm−3, length L = 50 nm, and in the electrolyte with NaCl concentration 10 mM, is about 0.4V.
Assuming the number of streptavidin molecules bound to the SiNW surface varies from 0 to 10, the calculated surface potential change AOs is shown in Figure 2.5. As can be seen, the surface potential at the silicon oxide layer increases as the number of the bound streptavidin molecules increases. The curve is nonlinear due to the Debye screening effect of the electrolyte where the ions (Na+, Cl−) in the electrolyte screen the charges on the biotin and streptavidin molecules.
2.4.2 I-V Characteristics of SiNW FET Biosensors
The I-V characteristics of the SiNW FET biosensor can be obtained by solving the Poisson equation and the drift-diffusion equation using a MuGFET simulator [27]. MuGFET is a simulation tool for nanoscale multigate FET structures and SiNW FETs. It provides self-consistent solutions to the Poisson and drift-diffusion equation via a user-friendly graphical user interface.
We assume the source and drain extension of the SiNW is 10 nm, and the source and drain are n-type doped with doping concentration 1018 cm−3. The source electrode is grounded. In our simulation for the silicon oxide surface voltage change, the reference voltage on the silicon oxide surface (the initial gate voltage for the SiNW FET) is around 0.4V. Binding of the streptavidin molecules leads to the gate voltage change of several millivolts.
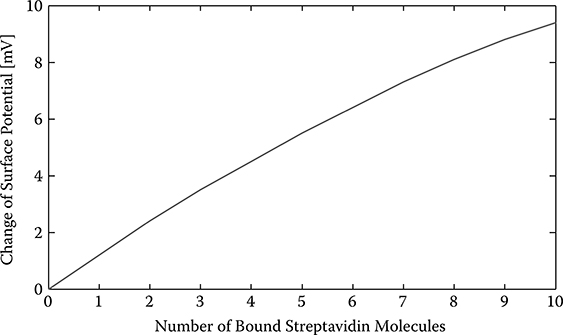
FIGURE 2.5
Change of silicon oxide surface potential versus number of streptavidin molecules bound.
It is important to find a proper drain voltage to make the SiNW FET work at a point that is very sensitive to the gate voltage change, that is, a small change in the gate voltage will lead to a big change in the drain current so that the drain current change is appreciable.
We calculate the I-V characteristics for three different gate voltages (Vg = 0.40V, 0.41V, 0.42V; these values are chosen because the reference voltage is about 0.4 V) while keeping the following parameters constant: SiNW diameter d = 10 nm, channel doping density p = 1015 cm−3. The calculated I-V characteristic is shown in Figure 2.6. As can be seen, when the drain voltage is small, the SiNW FET works in the linear region and the drain current change for different gate voltages is very small. When the drain voltage is large enough, the SiNW FET works in the saturation region and the drain current change for the different gate voltage is distinct. Thus, the SiNW FET should work in the saturation region to have a good sensitivity for the gate voltage change. In the remaining simulations, we will fix the drain voltage as 1 V to make sure the SiNW FET work in the saturation region.
2.4.3 Sensitivity Analysis
We define the drain current change for different silicon oxide surface potentials (gate voltages) as
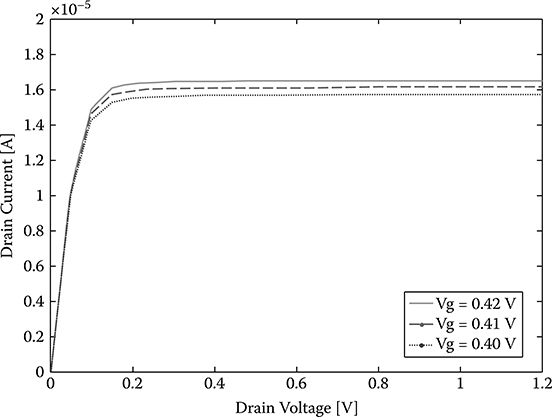
FIGURE 2.6
The I-V characteristics for different gate voltages.
where n denotes the number of streptavidin molecules bound to the avidin molecules and is the reference drain current when no streptavidin molecules are bound to the avidin molecules. The drain current change can be regarded as the sensitivity of the SiNW FET biosensor.
The changes of the drain current according to the number of bound strep-tavidin molecules in different NaCl concentrations are shown in Figure 2.7a. As can be seen, a lower concentration of NaCl will lead to a large change of silicon oxide surface potential and consequently a larger drain current change. Thus, we can conclude that lower NaCl concentrations will result in higher sensitivity of the SiNW FET biosensor.
Using a similar procedure, we investigate the influence of SiNW length to the sensitivity of the SiNW FET biosensor while keeping the following parameters constant: SiNW diameter d = 10 nm, doping density p = 1015 crrr3, and the NaCl concentration in the electrolyte is 10 mM. Three different SiNW lengths (L = 50 nm, 70 nm, and 90 nm) are investigated, and the results are shown in Figure 2.7b. As can be seen, SiNW with a shorter length has higher sensitivity. This is reasonable since for a shorter SiNW the traveling speed of carriers is faster, and there will be less carrier recombination.
The influence of SiNW diameter on the sensitivity of the SiNW FET biosensor is investigated while keeping the following parameters constant: SiNW length L = 50 nm, doping density p = 1015 cm−3, and the NaCl concentration in the electrolyte is 10 mM. Three different SiNW diameters (d = 10 nm, 12 nm, and 14 nm) are investigated, and the results are shown in Figure 2.7c. As can be seen, SiNW with a smaller diameter shows higher sensitivity. This is justifiable since for thinner SiNW, the gate voltage has better control over the conducting channel inside the SiNW.
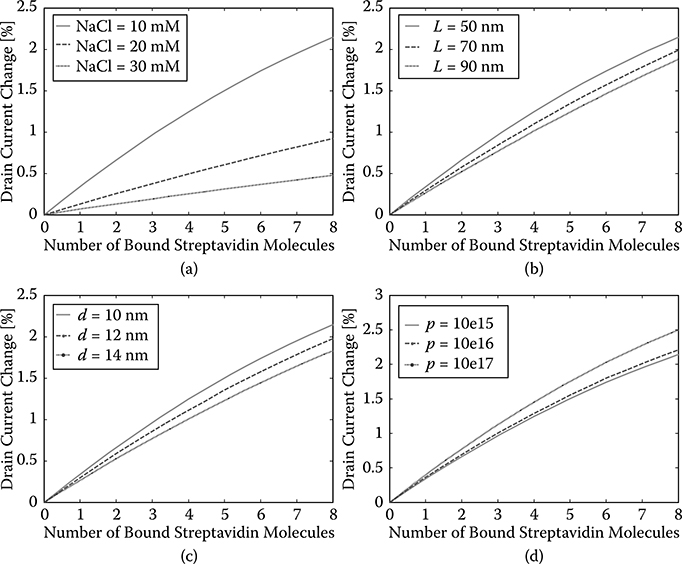
FIGURE 2.7
Drain current change versus number of streptavidin molecules bound for different NaCl concentrations: (a), nanowire length, (b), nanowire diameter, (c), and doping level (d).
The influence of doping levels on the sensitivity of the SiNW FET biosensor is investigated while keeping the following parameters constant: SiNW diameter d = 10 nm, length L = 50 nm, and the NaCl concentration in the electrolyte is 10 mM. Three different doping levels (p = 1015 cm−3, 1016 cm3, and 1017 cm−3) are investigated, and the results are shown in Figure 2.7d. As can be seen, SiNW with higher doping levels shows higher sensitivity.
2.4.4 Discussion
From the above analysis, we can conclude that SiNW with a shorter length, smaller diameter, higher doping level, and with lower NaCl concentration in the electrolyte has higher sensitivity. When these parameters are properly chosen, it is possible to achieve single streptavidin molecule detection. The following parameters are chosen for a SiNW FET biosensor: SiNW diameter d = 10 nm, length L = 50 nm, doping level p = 1015 cm−3, and the NaCl concentration in the electrolyte is 1 mM. With current technology, SiNW FET biosensors with these parameters can be readily fabricated. The drain current according to the number of bound streptavidin molecules is shown in Figure 2.8. When the number of the bound streptavidin molecules changes from 0 to 1, the drain current changes by 2.59% and since this change is in measurable range, recognition of single streptavidin molecules is feasible. Actually, the sensitivity can be even higher when a higher doping level is chosen.
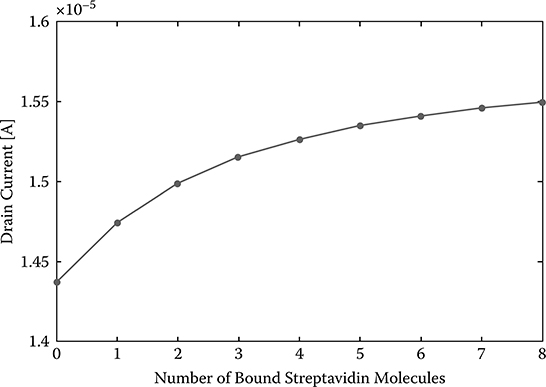
FIGURE 2.8
Drain current versus number of streptavidin molecules bound.
2.5 Conclusions and Perspectives
In this chapter, using the biotin/streptavidin system as a model system, comprehensive modeling and simulation studies are presented to reveal the underlying detection mechanism of biotin/streptavidin binding using the SiNW FET biosensor. The detailed structures, modeling procedure, and simulation methods of the SiNW FET biosensor are presented. The simulation results are analyzed and the influence of parameters such as the dimension of the SiNW (diameter and length), the doping level of the SiNW, and surrounding environment (the ion concentration in the solvent) are investigated for the sensitivity of the SiNW FET biosensor. The detection limit of biotin/streptavidin binding using the SiNW FET biosensor, that is, the detection of single streptavidin molecule binding, is also investigated. The preliminary simulation results indicate that optimal sensor performance can be ensured by careful optimization of its parameters, and it is feasible to detect binding of single streptavidin molecules when optimal parameters are chosen. However, there is room for the sensitivity to be further improved. The modeling procedure and simulation methods shown in this work can be readily modified and adopted for detection of other receptor-target biomolecules pairs, such as ssDNA-dsDNA, antibody-protein, and antibody-virus, using SiNW FET biosensors. The simulation results can serve as a guideline for the design and optimization of SiNW FET biosensors in future studies.
Several problems need to be addressed in future studies. First, the Gouy-Chapman theory is suitable for solving the NPBE for a one-dimension planar ISFET biosensor. For this particular application, accuracy is good. However, it is an approximation to solve the NPBE for a SiNW FET biosensor using the Gouy-Chapman theory, but the accuracy cannot be guaranteed. Second, biotin and streptavidin molecules are modeled as spheres in this study, differing from their original structures and affecting simulation accuracy. In future studies, biotin and streptavidin should be modeled using their exact structure. A 3D NPBE solver must be used to solve the surface potential for the SiNW FET biosensor.
References
1. K. Besteman, J.-O. Lee, F. G. M. Wiertz, H. A. Heering, and C. Dekker, "Enzyme-coated carbon nanotubes as single-molecule biosensors," Nano Letters, vol. 3, no. 6, pp. 727-730, 2003.
2. A. Star, E. Tu, J. Niemann, J.-C. P. Gabriel, C. S. Joiner, and C. Valcke, "Label-free detection of DNA hybridization using carbon nanotube network field-effect transistors," Proceedings of the National Academy of Sciences of the United States of America, vol. 103, no. 4, pp. 921-926, 2006.
3. K. Maehashi, T. Katsura, K. Kerman, Y. Takamura, K. Matsumoto, and E. Tamiya, "Label-free protein biosensor based on aptamer-modified carbon nanotube field-effect transistors," Analytical Chemistry, vol. 79, no. 2, pp. 782-787, 2006.
4. Y. Cui, Q. Wei, H. Park, and C. M. Lieber, "Nanowire nanosensors for highly sensitive and selective detection of biological and chemical species," Science, vol. 293, no. 5533, pp. 1289-1292, 2001.
5. J.-i. Hahm, and C. M. Lieber, "Direct ultrasensitive electrical detection of DNA and DNA sequence variations using nanowire nanosensors," Nano Letters, vol. 4, no. 1, pp. 51-54, 2004.
6. F. Patolsky, G. Zheng, O. Hayden, M. Lakadamyali, X. Zhuang, and C. M. Lieber, "Electrical detection of single viruses," Proceedings of the National Academy of Sciences of the United States of America, vol. 101, no. 39, pp. 14017-14022, 2004.
7. Z. Li, Y. Chen, X. Li, T. I. Kamins, K. Nauka, and R. S. Williams, "Sequence-specific label-free DNA sensors based on silicon nanowires," Nano Letters, vol. 4, no. 2, pp. 245-247, 2004.
8. J.-i. Hahm, and C. M. Lieber, "Direct ultrasensitive electrical detection of DNA and DNA sequence variations using nanowire nanosensors," Nano Letters, vol. 4, no. 1, pp. 51-54, 2003.
9. T. Cohen-Karni, B. P. Timko, L. E. Weiss, and C. M. Lieber, "Flexible electrical recording from cells using nanowire transistor arrays," Proceedings of the National Academy of Sciences, vol. 106, no. 18, pp. 7309-7313, 2009.
10. K. Ramanathan, M. A. Bangar, M. Yun, W. Chen, N. V. Myung, and A. Mulchandani, "Bioaffinity sensing using biologically functionalized conducting-polymer nanowire," Journal of the American Chemical Society, vol. 127, no. 2, pp. 496-497, 2004.
11. N. Chartuprayoon, C. M. Hangarter, Y. Rheem, H. Jung, and N. V. Myung, "Wafer-scale fabrication of single polypyrrole nanoribbon-based ammonia sensor," Journal of Physical Chemistry C, vol. 114, no. 25, pp. 11103-11108, 2010.
12. Y. Wang, and G. Li, "Simulation of a silicon nanowire FET biosensor for detecting biotin/streptavidin binding," in Proceedings of the IEEE 10th International Conference on Nanotechnology, Seoul, Korea, 2010.
13. Y. Wang, and G. Li, "Performance investigation for a silicon nanowire FET biosensor using numerical simulation," in IEEE Nanotechnology Materials and Devices Conference, Monterey, California, 2010.
14. N. A. Lapin, and Y. J. Chabal, "Infrared characterization of biotinylated silicon oxide surfaces, surface stability, and specific attachment of streptavidin," Journal of Physical Chemistry B, vol. 113, no. 25, pp. 8776-8783, 2009.
15. S. M. Sze, Physics of Semiconductor Devices, New York: Wiley, 1981.
16. D. A. McQuarrie, Statistical Mechanics, Sausalito: University Science Books, 2000.
17. K. E. Forsten, R. E. Kozack, D. A. Lauffenburger, and S. Subramaniam, "Numerical solution of the nonlinear Poisson-Boltzmann equation for a membrane-electrolyte system," Journal of Physical Chemistry, vol. 98, no. 21, pp. 5580-5586, 1994.
18. D. J. Winzor, "Protein charge determination," Current Protocols in Protein Science, 2001, DOI: 10.1002/0471140864.ps0210s41.
19. H.-D. Jakubke, and H. Jeschkeit, Amino Acids, Peptides and Proteins: An Introduction, New York: Wiley, 1977.
20. R. Barbucci, A. Magnani, C. Roncolini, and S. Silvestri, "Antigen-antibody recognition by Fourier transform IR spectroscopy/attenuated total reflection studies: Biotin-avidin complex as an example," Biopolymers, vol. 31, no. 7, pp. 827-834, 1991.
21. J. Schiewe, Y. Mrestani, and R. Neubert, "Application and optimization of capillary zone electrophoresis in vitamin analysis," Journal of Chromatography A, vol. 717, no. 1-2, pp. 255-259, 1995.
22. B. Skoog, and A. Wichman, "Calculation of the isoelectric points of polypeptides from the amino acid composition," TrAC Trends in Analytical Chemistry, vol. 5, no. 4, pp. 82-83, 1986.
23. J. C. Gordon, J. B. Myers, T. Folta, V. Shoja, L. S. Heath, and A. Onufriev, "H++: A server for estimating pKas and adding missing hydrogens to macromolecules," Nucleic Acids Research, vol. 33, Suppl. 2, pp. W368-W371, 2005.
24. http://biophysics.cs.vt.edu/H++.
26. S. Birner, C. Uhl, M. Bayer, and P. Vogl, "Theoretical model for the detection of charged proteins with a silicon-on-insulator sensor," Journal of Physics: Conference Series, vol. 107, no. 1, p. 012002, 2008.