
Creating Charts
A chart or graph is not only a good way, but often the only way, to reasonably interpret a pile of data; it’s difficult to see trends, and often impossible to make useful comparisons, just by looking at rows and columns of numbers. Numbers provides enough chart choices to both represent most of the data you’ll be wrangling and potentially confuse you as to which type to use. And you could practically suffocate in its giant cloud of chart-building and formatting options, unless you stick with straight-vanilla presentations—and who wants that?
We’ll begin at the beginning—learning chart terminology—and then move on to learning about Choosing the Right Chart for your data. Once you have that under your belt, I’ll describe Creating a Chart and Editing a Chart, and then move on to Numbers’ specialities: 3D Charts and Interactive Charts.
Chart Parts and Terminology
Working with charts requires a somewhat specialized vocabulary, as you can see in Figure 116.

Here’s a brief description of the labels in the figure, as well as some related terms:
-
Axes: The vertical axis of a chart is the Y axis (fifth-grade mnemonic: Y goes to the skY); when there are two, they’re referred to as Y1 and Y2. The horizontal axis is the X axis.
A value axis is one that has numeric values; a category axis is one that has groups or categories as its data.
- Scale: The scale defines components of a value axis: its lowest and highest values, and the major and minor intervals, or steps, between them. The intervals can be visually indicated with tick marks along the axis line, as well as by background gridlines.
- Value labels: These are optional elements that identify the exact value for each data point. The labels can be within or outside the bar, column, or pie wedge, and be vertical, horizontal, or diagonal.
- Legend: An optional, but almost always necessary, element, the legend identifies the data series (or the pie slices) in the chart. It’s sometimes referred to as the key.
- Series names: For times when a legend just doesn’t cut it, series elements can be identified in the chart, either instead of, or in addition to, the category label.
- Data series: This is series of numbers that make a line, or bars of the same color, in a chart; in a scatter chart, it’s the values that define either the x-coordinate or the y-coordinate data. Pie charts don’t have any series; they have only wedges.
- Category labels: These typically identify the X axis items, which are usually categories rather than numbers; they often identify groups of data, as they do in the figure above.
- Background and border: The background is only the area behind the lines or bars (or pie), not the entire chart with its axes and labels; the border is simply the edge of the category axis—the bottom edge in the figure above.
- Gridlines: Major and minor gridlines can span a chart background whether or not you’ve applied a color to the background; they coordinate with the tick marks on the axis line.
Choosing the Right Chart
Apple has provided a nice primer regarding Numbers’ charts in its Charting Basics template, but it’s not enough to really help you with the crucial decision regarding what type of chart to use for which kind of data. Here’s a roundup of your choices, with advice as to when each should be used. I’ve divided the list into common Standard Charts, and the slightly-less-common Advanced Charts.
Standard Charts
The familiar line, bar, stacked bar, and pie charts are easy to identify—and just as easily misused.
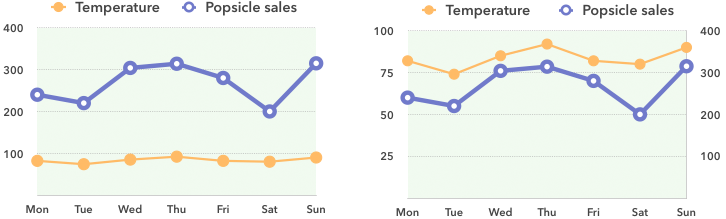
Line Chart
You know what a line chart is; you likely even know that its main use is to show how a value changes over time, for a either a single item or for multiple items to compare them. The important thing is to know when to use a bar or column chart instead, which I discuss next.
Bar/Column Chart
Use a bar chart (called a column chart when the bars are vertical) to compare data between groups, or categories: the output of Widget Factories I, II, and III; the starting salaries of MBAs versus other post-grad degree holders; the average rainfall in Your City for each month of 2001. There can be a single bar, or multiple bars, for each group, as you can see in Figure 117.

You’ll find that you can often plot certain data as either a bar/column chart or a line chart, and may wonder how you choose between the two. Here are some guidelines:
- If you are dealing with small changes over time, line charts are better than bar/column charts.
- If the point of your chart is to show how overall amounts differ from one point to another on the x-axis, go with a bar or column chart.
- If you’re more interested in highlighting how much change there is over time, use a line graph (Figure 118).

Stacked Bar/Stacked Column Charts
I like stacked bar and column charts—they’re like little (albeit misshapen) pie charts that are easy to compare. Use a stacked bar or column chart when you want to compare overall totals of data sets as well as their component parts (Figure 119).

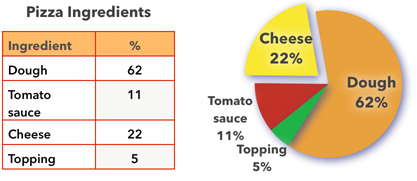
Pie Chart
Pie charts are simple and elegant, but frequently misused and abused. We call them pie charts instead of “circular graphs” for a reason: it’s a reminder that the data set that makes up the slices are parts of a whole (Figure 120). So, make a pie chart when you want to show how a total something is divvied up, not when you’re looking at sales over time.
Area Chart
An area chart seems to be simply a line chart that’s filled in with color—and, well, it is. But there are problems when more than one line is being graphed, so approach area charts gingerly:
- Unless one data set is, at all points, smaller than the other, some data points will be hidden. You can change a color’s transparency level in the Colors Window (Figure 121), but if you need to see through more than one layer at several spots, the information can be quite murky—literally and figuratively.

- The data is represented in a way that can skew the sense of how the data sets relate. The data area in the front (at the bottom) is often the biggest block of color—which is what you notice—but it represents the lower values; the highest values (in the “back,” at the top) may show as only a small band of color.
- Even if each data set politely stays within others in the chart, the chart might be interpreted as a stacked area chart—which is a whole ’nother problem, described n.
For an expanded explanation of line versus area charts, with lots of examples, see this wonderful explanation at blog.visual.ly.
Advanced Charts
These charts may not be totally unfamiliar to you, but they’re more prone to being misunderstood—by both the creator and the viewer.
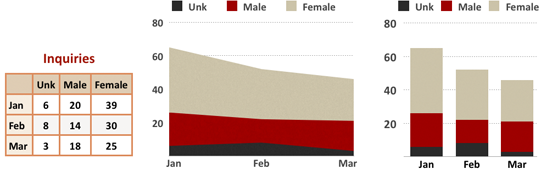
Stacked Area Chart
A stacked area chart is not what you might think: it’s not an area chart whose values, due to luck or careful planning, all show because the lower ones are “in front” of the higher ones. Not at all.
A stacked area chart is like a stacked bar chart (which is like a pie chart): it shows what part of the whole each x-axis data value is. But it has all the problems inherent to a standard area chart, along with bigger problems of its own in terms of interpretation.
Read about the problems at vizwiz blogspot and leancrew, and avoid this chart style unless you’re an expert. Or even if you are an expert, because it’s unlikely your viewers are all experts, too. Consider a stacked column chart instead.
Figure 122 demonstrates one of the more minor interpretation problems with this chart type. Non-member attendance dipped significantly in February, but since your eye follows the top of the red band in the stacked area chart, you don’t see that. The stacked column chart, however, clearly shows how narrow the red band is compared to the months before and after.
Mixed Chart
A mixed, or combination, chart lets you combine two types of charts into one presentation. This can be useful instead of, say, a line chart with two lines, when two data series use the same scale but the data or their categories are so disparate that you want to highlight the difference, or when you want to emphasize a comparison. Numbers lets you mix line, bar, and area series (Figure 123).

2-Axis Chart
A 2-axis, or dual, chart is tailor-made for when you have two things you’re comparing that have entirely different scales on the y-axis, either because they’re different units of measure (height and weight, for instance) or occupy very different ranges on a numeric scale. A dual chart has two y-axes, one on each side of the chart, as in Figure 124. You can even make a 2-axis mixed chart, which can be a very effective presentation of data.
Scatter Chart
A scatter chart (also known as an x-y plot) is used to plot pairs of coordinates in order to look for relationships between the things being measured: rain and fungus growth rate, or height and weight. Instead of two series of numbers being plotted along a line, the first numbers from each series are plotted together, then the second number pair, and so on. When the numbers increase together, they have a positive relation; if they go in opposite directions, there’s a negative relationship; when there’s no pattern, there’s no relationship.
It’s common to plot a “best-fit” line through the points on a scatter chart to illustrate a trend; Numbers provides six different ways to calculate this trendline (Figure 125).

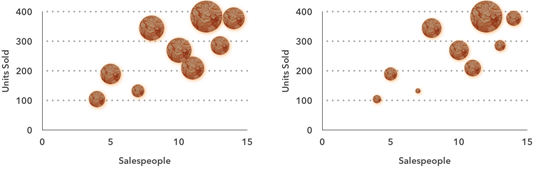
Bubble Chart
A bubble chart is basically a scatter plot with a third data series embedded: data from the first two data series are used to plot the x,y points on the graph, and the third (the z value) is used to create a bubble whose size represents the last piece of data.
Use a bubble chart as you would the Project Runway accessory wall—very thoughtfully. It’s easy to see which bubbles are larger than others, but very difficult to compare their relative sizes—is it the diameter of the circle that counts, or its area? And if it’s the area… well, that’s an interpretive issue by itself; you can choose either approach, but you don’t know how the viewer will construe it. And sometimes the bubbles will overlap, as they do slightly in Figure 126, further interfering with the visual interpretation. Search for bubble chart at the junkcharts.typepad site and read all about the issues.
Creating a Chart
You can create a chart by starting with the data selected in a table, or by choosing a chart type and then hooking it up to a table.
You could try out each of these approaches on your own data, but Numbers gives you the perfect practice sheet: the Data Comparison tab on the Charting Basics template. Open it and select and then delete the three charts on it so you have room for your own.
Start with the Data
To start with data, select a table (or the part you want charted), including header labels that will serve as legends. In this example, we’ll start with the entire table:
- Select the table. Make sure the table itself is selected, and not one or more of its cells; you should see its white resize handles. If a cell is already selected, either click the Table
 handle or press Command-Return to select the table.
 - On the toolbar, click the Chart
 button and choose a chart. (For Figure 127, I chose the column chart (the first one in the 2D tab).
Numbers creates the chart with labels from the table’s headers.

Start with the Chart
When you start with a chart, you choose the chart first, and then tell it where to find its data.
To choose a chart, click the Chart ![]() button in the toolbar. The popover seems to supply a bewildering number of unidentified chart types: there are three tabs in the popover, and each has multiple pages. But the twelve charts in the 2D tab cover all the available charts, and some are simple variants of others. The second tab shows the eight that have 3D versions, and the third tab shows the four that can be made interactive (Figure 128).
button in the toolbar. The popover seems to supply a bewildering number of unidentified chart types: there are three tabs in the popover, and each has multiple pages. But the twelve charts in the 2D tab cover all the available charts, and some are simple variants of others. The second tab shows the eight that have 3D versions, and the third tab shows the four that can be made interactive (Figure 128).

And those pages in each tab? They are mere repeats, showing different styles for the starting color scheme, based on the styles stored in the document’s template. If you check the Insert > Chart submenu, you’ll see the list of available charts grouped by 2D, 3D, and Interactive availability—and that’s where you’ll find the names of these charts, too.
To choose a chart and hook it up to an existing table:
- Make sure the table is neither active nor selected (click on a bare spot on the sheet).
- Click the Chart button and pick a chart type. (For the figure after these steps, I used the column chart from the 2D tab, working in the Data Comparison tab of the Numbers template Charting Basics).
The chart appears, selected, in a faded style to show it that it’s not hooked up to any data yet.
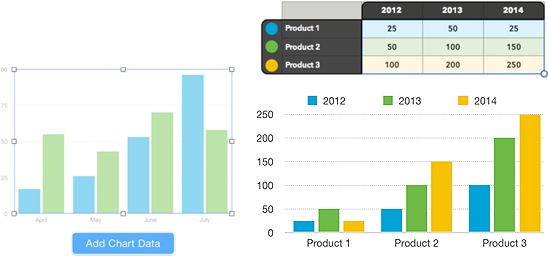
- Click the Add Chart Data button beneath the chart (the button’s position changes if the chart is close to the edge of your window).
Your pointer changes to a special Add Data
 cursor.
 - In the table, drag across the headers of the data you want represented by the bars in the chart. (For the figure below, I made the chart the opposite of the one in Figure 127, where the columns showed the years and the products were the axis labels: I dragged across the row headers—Product 1 and so on.)
Numbers is smart enough to figure out what else the chart needs from the table. It assumes the selected rows hold the values, the column headers are category names, and the header row contains the series names for the legend. The legend labels are flagged in the table with their chart colors, and their data cells are highlighted with a coordinating pastel (Figure 129).
Editing a Chart
There are two ways of “editing” what a chart represents:
- Change the data: This is a cinch: alter cell contents in the table—including header labels—and the chart is immediately updated.
- Change what’s included in the chart: This means redefining which rows and columns, and what parts of them, are used.
To change what’s included in a chart, select the chart and then click the Edit Data References button that appears. Numbers transforms the source table, highlighting the data used in the chart (Figure 130), and changes the pointer to the Add Data ![]() cursor.
cursor.

Once you’ve clicked the Edit Data References button, follow any procedure listed below, and then click the Done button (at the right of the bar at the bottom of the window) or press Return:
- Add a full data series: Whether the chart doesn’t include all the table’s data, or you deleted a series from the chart, or you added rows or columns to the table after you made the chart, you can put more data in the chart. Just click on the header cell for the row or column you want added. (No header? Drag across the cells instead.)
- Remove a full data series: Click the dot for any row or column and press Delete; this removes it from the chart, not the table. Alternatively, you can remove the last row or column of data from the chart by dragging the round selection handle in the lower-right corner of the selection. (Whether the rows or the columns get the “dots” for easy selection depends on what type of chart is being used, and whether the row or the column data represents the data series.)
- Add or remove partial rows or columns: Drag the selection handle in the table so the selection encompasses only the items you want in the chart.
-
Include data from more than one table: Long ago, <blink> was all the rage, and outrage, as an attention-getting element on a Web page. If I could in this book, I’d turn on blinking for the bold phrase introducing this bullet item just to grab your attention.
This editing feature is that good, and easy to overlook. When you add data to a chart, you don’t have to work just with the original table: you can add cells from other tables the same way you use additional information from the original chart (Figure 131). The table(s) can even be on another sheet, in which case their tabs are marked with a chart symbol
 when you click the chart’s Edit References button.

-
Swap the chart axes: Wish you could force either the rows or the columns to be treated as the series for a chart without altering the table data? Granted! Select the chart, and click its Edit Data References button. In the bar at the bottom of the window, at the far left, a pop-up menu appears; choose Plot Rows as Series or Plot Columns as Series—whichever one is not already checked (Figure 132).
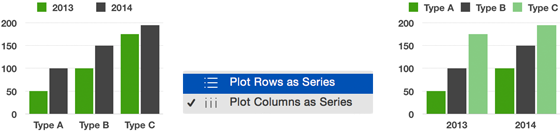
Figure 132: Swap the chart axes by using the pop-up menu in the lower left of the window. -
Change the chart type: Talk about edits! You can change the type of the chart you’ve selected by using the Chart Type menu at the bottom of the Format Inspector’s Chart pane: change a column chart to a bar chart, or vice versa; or, opt for the more circumspect 2D approach instead of your original 3D version.
Not all your chart formatting can survive the change from one chart type to another, even if the charts share those attributes. Colors are a particular problem: each chart type has different default colors, so that changes—and any color-tweaking you did for certain series won’t carry over either. Some shared attributes, such as gridlines, number formats, and borders can carry over to the new chart type.
3D Charts
If there’s anywhere that even the most staid user is likely to get carried away, it’s with 3D charts. Columns and bars turn into slabs, or even cylinders; lines turn into flat ribbons; area charts are mountain ranges, and pies are… hockey pucks? The built-in styles include classy or brassy (depending on your take) metallics. And as if that weren’t enough, you can spin and tilt the chart every which way.
To make a 3D version of any of the eight basic chart types, click the Chart ![]() button and choose from the 3D tab (Figure 133).
button and choose from the 3D tab (Figure 133).

When a 3D chart is selected, a special 3D Scene segment appears in the Format Inspector’s Chart pane (Figure 134).
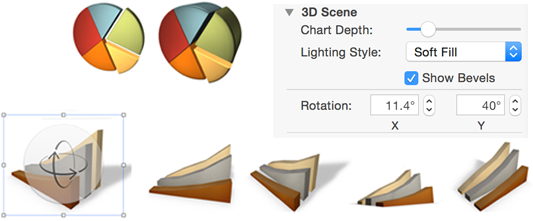
The Chart Depth slider in the 3D segment changes the “thickness” of graphical chart elements, and the Lighting Style pop-up menu provides six choices beyond the default. The Show Bevels checkbox is for any chart whose parts touch—such as a pie or stacked bar, for instance; if you show the bevels, there’s a more definite delineation between adjacent segments. Rotation numbers can be used in lieu of, or in addition to, the rotation control (which, I’ve found, doesn’t always show up on a selected 3D chart).
Interactive Charts
In a decades-long career of writing about Mac stuff, I have scrupulously avoided the adjective “cool.” But when it comes to interactive charts, well, they’re very… nifty. (I just couldn’t say it.)
An interactive chart gives you a third dimension for representing data. If you have data sets for multiple years, for instance, you can click through a series of charts, one for each year, and watch bars or columns grow or shrink, or scatter-plot points scurry around, or bubbles expand and contract, as the data changes (Figure 135). (There’s an interactive chart you can play with in the Charting Basics template.)

To make an interactive chart:
- Create a chart as usual, starting with either the data selected in the table and then using the Chart button, or by first choosing from the Chart button’s popover. Select one of the four chart types in the Interactive tab of the popover: column, bar, scatter, or bubble.
- With the chart selected, go to the Format Inspector’s Chart pane.
- In the Interactive Chart section, choose Slider and Buttons, or Buttons Only, from the first menu.
I find this terminology less than crystal clear. The slider is the white button-ish control in the bar that moves along the dots beneath the chart; the buttons are the arrows on either end of the control.
- From the Data Set Name pop-up menu (in the same section of the pane), choose where you want the data set name to display in the chart. In a standard chart, this information would be the categories along the x axis; in an interactive chart, you’ll see one category (a data set for a year, for instance) at a time. As you flip through the data sets, you’ll see the name so you know what you’re looking at.
You can put the Data Set Name above or below the chart (the previous figure shows it below the chart). I prefer it above the chart so that the interactive control is tighter against the chart’s bottom.
To flip through an interactive chart, don’t select it first, or you’ll get the Edit Data References button; the slider/buttons will still work, but why muddy the waters? Just work with the control without selecting the chart:
- Drag the slider (the white circle) in either direction.
- Click on any of the dots in the slider control to jump to the related data set.
- Click the button (arrow) on either end to move one data set in that direction.
- Click-and-hold either button to keep the data sets coming with an animation effect.