In this section, we evaluate the performance of OppCast. The compared protocols are as follows.
- Slotted p-persistence broadcast (Wisitpongphan et al. December 2007b) (Slotted-p). Upon receiving a packet from j, a node i rebroadcasts the packet with a fixed probability q after the backoff delay Tij, if it receives the WM packet for the first time and has not received any duplicates during the delay. Otherwise, it drops the packet. The delay-distance function is slotted and linear. Slotted-p is shown to be the best among the probability-based protocols (Wisitpongphan et al. 2007b). We set τ = 5ms, NS = 5, q = 0.5 (the settings used in Wisitpongphan et al. 2007b) and the forwarding range R = CR = 250 m in the simulations.
- Contention-based dissemination (CBD) (T-Moreno 2007), a typical broadcast protocol also based on opportunistic forwarding. It does not differentiate between relay nodes, and uses WM as implicit ACKs. A node in the forwarding range will set a backoff timer upon receiving a WM for the first time; it cancels the timer only if it receives duplicate WMs during the backoff process, otherwise it rebroadcasts. The delay-distance function is continuous and linear. We set the maximum backoff delay to be 10 ms, which is below the value (50 ms) adopted by (T-Moreno 2007) (since our CR = 250 which is smaller than the one used in (T-Moreno 2007), and the channel tends to be less congested). Also, we set R = CR = 250 m.
Meanwhile, the IDEAL protocol is also compared, which can be regarded as a lower-bound to the transmission overhead as it has no collisions and redundant transmissions. The proposed protocols are named by appending the threshold PRR to the protocol type, e.g., for OppCast95, Pth = 95%.
10.7.1 Simulation Setup
OppCast and its extension (OppCast-Ext) is implemented in NS-2.33 (http://www.isi.edu/nsnam/ns), which supports probabilistic propagation models. The parameters are summarized in Table 10.2. The other PHY and MAC layer parameters follow the default settings of IEEE 802.11p. The Rayleigh fading model is used, which is a special case of the Nakagami model.
Table 10.2 Parameter settings
| Maximum time slot length, guard time | 80 μs, 20 μs |
| CR for WM and BACK | 250 m, 628 m |
| Transmission rates for WM and BACK | 12 mbps, 3 mbps |
| Tx power, CSThresh, Noise floor | 10, −96, −98 dBm |
| WM, Beacon and BACK length | 292, 72, 14 bytes |
| MAX_RETX | 3 |
| Vehicle distribution | Uniformly random |
| Range of global vehicle density | 5–200 cars/km |
| Vehicle speed | Randomly sampled from 72–108 km/h |
| Road length, IR length | 6 km, 4–5 km (two lanes/direction) |
| Maximum makeup level | 2 |
For the data traffic model, every vehicle periodically generates ten beacon messages every second for routine safety applications. The beacons have the same CR and transmission rates as WMs. Also, each (west bound) vehicle located between 1 km and 2 km randomly generates urgent event-driven WMs at an average messaging rate of r packets/s, according to the Poisson arrival model.
Each WM's IR is chosen to be the road segment between its source and the east end of the highway. Three sets of experiments are conducted. In the first one, the traffic density ρ ranges from 20–200 vehicles/km while the messaging rate r is fixed to 0.1 packets/s. For the second, ρ is fixed to 80 while r is varied from 0.01 to 10 packets/s, and for the third, ρ changes from 5 to 60. In the third case, some vehicles in the opposite driving direction will definitely not receive the WM due to disconnection, so we set the IR to include only the two co-directional lanes. Each simulation run lasts for 10–200 s, and a random scenario is generated where vehicles are uniformly distributed. Figures 10.13–10.15 show the results where each point is averaged from five repetitive runs with different topologies generated using different seeds, and the error bars indicate a 95% confidence interval.
Figure 10.13 Simulation results: WM reception ratio (OppCast without extension). (a): fix r = 0.1, change ρ. (b): fix ρ = 80, change r. © 2011 IEEE. Reprinted, with permission, from Z. Yang, M. Li and W. Lou, “CodePlay: Live Multimedia Streaming in VANETs using Symbol-Level Network Coding”, IEEE Transactions on Mobile Computing (TMC), 2011.

Figure 10.14 Simulation results: dissemination rate (OppCast without extension). (a): fix r = 0.1, change ρ. (b): fix ρ = 80, change r. © 2011 IEEE. Reprinted, with permission, from Z. Yang, M. Li and W. Lou, “CodePlay: Live Multimedia Streaming in VANETs using Symbol-Level Network Coding”, IEEE Transactions on Mobile Computing (TMC), 2011.

Figure 10.15 Simulation results: transmission count (OppCast without extension). (a): fix r = 0.1, change ρ. (b): fix ρ = 80, change r. © 2011 IEEE. Reprinted, with permission, from Z. Yang, M. Li and W. Lou, “CodePlay: Live Multimedia Streaming in VANETs using Symbol-Level Network Coding”, IEEE Transactions on Mobile Computing (TMC), 2011.

10.7.2 Results for OppCast without Extension
10.7.2.1 WM Reception Ratio
We first fix r = 0.1, and change ρ. In Figure 10.13(a), when ρ = 60 ∼ 200, OppCast99 maintains an average PRR of above 99%, and that of OppCast95 is higher than 98%. This shows that OppCast indeed satisfies the PRR requirement when the network is well connected. The average PRR turns out to be higher than the thresholds because the PRR requirement is taken as a minimum requirement in each MFR phase. When the network is sparse, i.e., ρ = 20 ∼ 50, the PRR of OppCast protocols is still higher than 90%, which is much higher than Slotted-p and CBD. The advantage is primarily because of the FFD phase trying to guarantee that the forwarders span the whole network. The PRR in this case is lower than required because there may not be enough relay nodes due to network partition.
Figure 10.13(b) shows the PRR results of the second experiment. It can be seen that the PRR requirement in OppCast is always satisfied when r is small to moderate. The decrease of PRR only happens when message generation is very dense, i.e., r > 1. However, the PRR of OppCast is still much higher than Slotted-p and CBD in this case, while OppCast introduces much lower overheads. Similar results can be observed for the dissemination rate. This shows OppCast is more scalable, i.e., more capable of handling saturated message traffic situations than other protocols.
10.7.2.2 Dissemination Rate and Delay
From Figure 10.14(a), it can be seen that the dissemination rate of OppCast95 is the highest except for IDEAL95, for all the vehicle densities shown. Similar results are shown in Figure 10.14(b), where OppCast95's dissemination rate is still among the highest for all the messaging rates. This can be attributed mainly to the opportunistic forwarding concept adopted in OBCF, which always utilizes the most distant forwarder candidate so that the one-hop delay is minimized. On the other hand, for OppCast99, although the achieved reliability is a little higher than OppCast95, the dissemination rate is smaller. It turns out that the reduced dissemination rate is a cost to enhance the WM reception ratio in OppCast.
To further investigate the dynamics of WM dissemination in OppCast and see why it performs better, we show in Figure 10.16 the end-to-end delay results of each vehicle in the IR correlated with its distance to the source, for a typical WM disseminated in VANET with traffic density equal to 80 vehicles/km (well connected). Remarkably, the last vehicle in the IR receives the WM within about 12 ms, which is much less than that of the CBD and slotted-p. The delay-distance curve also increases smoothly, showing that there is little gap between reception times of successive rebroadcasts (read from the y-axis). This shows the effectiveness of the carefully designed coordination mechanism for relay selection (OBCF), where average hop-delays in the order of 10–100 μs can indeed be achieved. Moreover, although we used makeup nodes so that nodes that missed the WM in the FFD phase can receive it later, the introduced delay variance is negligible.
Figure 10.16 The end-to-end delay of each vehicle in the IR versus distance to the source, ρ = 80, r = 0.1. © 2011 IEEE. Reprinted, with permission, from Z. Yang, M. Li and W. Lou, “CodePlay: Live Multimedia Streaming in VANETs using Symbol-Level Network Coding”, IEEE Transactions on Mobile Computing (TMC), 2011.

In contrast, other protocols do not enjoy the same level of fast propagation. For CBD, there are obvious time gaps between consecutive rebroadcasts, which are partially due to its large backoff delay in relay contention processes. However, the maximum backoff delay (10 ms) is already much less than the adopted value in (T-Moreno 2007). By studying Figure 10.16 in more detail, one can observe that some time gaps are relatively long, and many next-hop relays are located near their previous hops. This suggests that during relay contention process in CBD, due to channel fading and poor coordination, packet collisions happen more frequently, resulting in sub optimal relays being selected, while in OppCast, the FFD phase is employed to propagate the WM towards the end of IR in the first place. To guarantee this we use the BACK, by which the channel is cleared before each rebroadcast, and candidate relays in each newly traversed one-hop zone suspend their counting down timers during BACK to give priority to the forwarding WM. Slotted-p is somewhat different, in that the continuous propagation periods are longer than that of CBD, however the gaps are even larger. The former is naturally due to zero delay for relays outside of the contention region; but the latter indicates that packet collisions are even worse. This is mainly because Slotted-p is still controlled flooding; although using a coarse-grained slotted timer function, it cannot completely eliminate the broadcast storm. The above results show that redundant transmissions indeed undermine broadcast performance to a large extent and the explicit BACK mechanism in OBCF is effective and necessary.
10.7.2.3 Transmission Overhead
The transmission overhead is evaluated by the total number of WM packet rebroadcasts incurred per WM sent by the source. As the length of a BACK is quite small compared with a WM packet, we neglect the overhead caused by BACKs. In Figure 10.15(a), as vehicle density increases to 200, the total number of transmissions incurred by OppCast95 and OppCast99 is about 40% of that of CBD. More importantly, the overhead increases more slowly with respect to vehicle density than in Slotted-p and CBD, because the relay selection mechanisms are optimized, and the OBCF is effective in reducing redundant transmissions and packet collisions in the presence of lossy links. In CBD, because of channel fading, the rebroadcast of relays cannot be heard by many other relay candidates, which leads to a large number of redundant transmissions. On the other hand, in OppCast, using BACK, we can exert more fine-control over the selection of makeups, which turns out to be less than three per one-hop zone. The above indicates that the high reliability and fast dissemination are achieved in a resource-efficient way in OppCast.
10.7.2.4 The Tradeoffs
The OppCast95 achieves competitively high PRR and the highest dissemination rate using the smallest number of transmissions. The OppCast99 achieves higher PRR than OppCast95 in most scenarios, but uses more transmissions and leads to slower dissemination. As we aim to achieve multiple goals at the same time in the design of OppCast, this reflects the fundamental tradeoff between them: to achieve higher reliability, more transmissions are needed, which in turn causes greater broadcast latency. When the PRR is already close to 1, a marginal gain in PRR would also demand noticeably more transmissions, and would result in a big reduction in the dissemination rate, as in the case of OppCast99. Thus, using a lower PRR goal, such as 95%, is better than 99% in this sense.
On the other hand, the Slotted-p exploits a different tradeoff: it uses aggressive rebroadcasts to achieve high reliability and a relatively high dissemination rate. However, this is not very resource efficient because it consumes a much larger portion of the VANET bandwidth. Moreover, too many transmissions adversely affect the dissemination rate, as one can see from Figures 10.13–10.15 and Figure 10.16.
Note that, in our comparisons, we have not extended the Slotted-p and CBD to allow a forwarder to perform multiple retransmissions as is the case in OppCast. This could be done to enhance their PRRs under the disconnected case; however, the gain is very small when the network is well connected and it results in even more transmission overheads.
10.7.2.5 How Reliable is the BACK?
Next, we investigate deeper about the reliability of BACK in OppCast, and discuss how the broadcast performance will be affected by BACK. Ideally, BACK should achieve three goals: 1. acknowledge the transfer of relaying opportunity and suppress all redundant relay candidates; 2. inform the previous forwarder to cancel retransmission; 3. suppress hidden terminals to reserve the channel for WM broadcast. In IDEAL protocol, all these goals are achieved perfectly. But in reality, BACK is still subject to losses. This comes from either fading, or collisions between BACK and its hidden terminals. Consequently, there may exist redundant relay nodes, redundant rebroadcasts or WM collisions.
In Figures 10.13–10.15, the performance degradation of OppCast w.r.t. IDEAL is also shown. When message traffic is dense (r > 1), the PRR in OppCast is smaller than that of IDEAL. As PRR is the primary goal in OppCast, when a BACK is not heard by a relay node, it tends to use more rebroadcasts to guarantee PRR. We then show the reliability of BACK by showing the total number of (re)broadcasts for each WM, which is broken down into number of relays and retransmissions by forwarders in Table 10.3.
Table 10.3 Average number of relays and retransmissions

For both OppCast95 and OppCast99, when ρ = 120 the number of relays is one-third more than their IDEAL counterparts (optimal), which make up the major part of the redundant (re)broadcasts, but this is acceptable. The number of retransmissions in OppCast95 increases faster with ρ, because OppCast99 uses more makeups that send BACKs to cancel forwarders' retransmissions. The redundant transmissions lead to PRR over-provisioning in OppCast.
In order to reduce the redundant (re)broadcasts, the BACK has to be reliably received by more nodes in the network. However, using a longer communication range for BACK is not necessarily better, which will cause the exposed terminal problem. This can be seen from the lower dissemination rate of IDEAL when the channel load (ρr) is low to moderate (Figures 10.14(a),(b)). We believe that, to balance the goals of suppressing hidden terminals and avoiding exposed terminals, it is a good choice to set BACK's range to be around twice of WM's CR. The intuitive explanation is that if the BACK's range is smaller than twice of WM's CR there will be hidden terminals that cannot be suppressed; on the other hand, if the BACK's range is more than twice WM's CR, the nodes within the area from twice of WM's CR to the BACK's range will become exposed terminals.
10.7.3 Results for OppCast with Extension
In Figures 10.17–10.19 we show the results of OppCast extension under sparse VANETs. The effects of using different threshold densities ρth are clear from the figures. When the ρth increases from 0 to 30, the achieved PRR tends to increase for all the densities, the dissemination rate decreases and the transmission overheads increase. These results are in line with intuition because the higher the ρth, the more often data mules are used and more redundant transmissions are incurred, which makes the channel more saturated and thus increases the channel access delay. The redundant transmissions increase dramatically with the ρth as we do not allow a data mule to cancel its carrying status for WMs, in order to ensure the PRR.
Figure 10.17 Simulation results of PRR for OppCast95-Ext under sparse VANET, Pth = 0.95, r = 0.1. The case ρth = 0 corresponds to OppCast without extension. (Each point is averaged from 10 repetitive runs with different topologies.) © 2011 IEEE. Reprinted, with permission, from Z. Yang, M. Li and W. Lou, “CodePlay: Live Multimedia Streaming in VANETs using Symbol-Level Network Coding”, IEEE Transactions on Mobile Computing (TMC), 2011.

Figure 10.18 Simulation results of dissemination rate for OppCast95-Ext under sparse VANET, Pth = 0.95, r = 0.1. © 2011 IEEE. Reprinted, with permission, from Z. Yang, M. Li and W. Lou, “CodePlay: Live Multimedia Streaming in VANETs using Symbol-Level Network Coding”, IEEE Transactions on Mobile Computing (TMC), 2011.

Figure 10.19 Simulation results of transmission count for OppCast95-Ext under sparse VANET, Pth = 0.95, r = 0.1. © 2011 IEEE. Reprinted, with permission, from Z. Yang, M. Li and W. Lou, “CodePlay: Live Multimedia Streaming in VANETs using Symbol-Level Network Coding”, IEEE Transactions on Mobile Computing (TMC), 2011.

Moreover, jointly considering the PRR requirements (PRR ≥ Pth = 0.95) and the transmission overhead, one can find that the optimal threshold density equals 20 from Figures 10.17–10.19. This matches well with our theoretical result derived in the last section, where the optimal ρth is between 15 and 20.
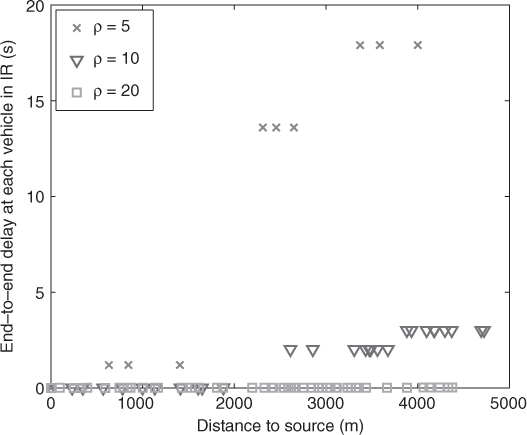
To reveal the WM dissemination dynamics under sparse VANET, we show the delay-distance graph in Figure 10.20. The plateaux indicate the connected parts in the network. We can see that OppCast still allows a WM to propagate very fast within connected platoons, while always relaying the WM to the next platoon successfully. This is ensured by the retransmission mechanism by the forwarders.
Figure 10.20 The end-to-end delay of vehicles under sparse VANET, OppCast95-Ext, ρth = 20. © 2011 IEEE. Reprinted, with permission, from Z. Yang, M. Li and W. Lou, “CodePlay: Live Multimedia Streaming in VANETs using Symbol-Level Network Coding”, IEEE Transactions on Mobile Computing (TMC), 2011.