
8
Reliability of Mechanical Components and Systems
8.1 Introduction
Mechanical components can fail if they break as a result of applied mechanical stresses. Such failures occur primarily due to two causes:
- Overstress leading to fracture. Stresses may be tension, compression or shear. Bending stresses cause tensile and compressive forces, but fracture usually occurs in tension.
- Degradation of strength, so that working stresses cause fracture after a period of time.
For example, a pressure vessel will burst if the pressure exceeds its design burst strength, or if a crack or other defect has developed to weaken it sufficiently.
Mechanical components and systems can also fail for many other reasons, such as (though this list is by no means exhaustive):
- Backlash in controls, linkages and gears, due to wear, excessive tolerances, or incorrect assembly or maintenance.
- Incorrect adjustments on valves, metering devices, and so on.
- Seizing of moving parts in contact, such as bearings or slides, due to contamination, corrosion, or surface damage.
- Leaking of seals, due to wear or damage.
- Loose fasteners, due to incorrect tightening, wear, or incorrect locking.
- Excessive vibration or noise, due to wear, out-of-balance rotating components, or resonance.
Designers must be aware of these and other potential causes of failure, and must design to prevent or minimize their occurrence. Appreciation of ‘Murphy's Law’ (‘if a thing can go wrong, it will’) is essential, particularly in relation to systems which are maintained and which include other than simple operator involvement. This chapter will describe overload and strength deterioration, and relevant aspects of component and material selection and manufacturing processes.

Figure 8.1 Material behaviour in tensile stress.
8.2 Mechanical Stress, Strength and Fracture
Mechanical stress can be either tensile, compressive or shear. Tensile stress is caused when the material is pulled, so that the stress attempts to overcome the internal forces holding the material together. Typical material behaviour in tension is shown in Figure 8.1. This shows that, as stress increases, the material stretches proportionally to the stress (the elastic region), then begins to stretch more rapidly (the plastic region), and finally fractures. In the elastic region the material will return to the original unstressed length if the stress is removed. The amount of deformation is called the strain. In the plastic region the material will retain some or all of the deformation if the stress is removed. Fracture occurs when sufficient energy has been applied to overcome the internal forces.
Stress is the load per unit cross-sectional area, conventionally expressed as σ, and is measured in kg/m2, lbs/in2 (psi), or pascals (Pa) (N/m2). The strain (![]() ) is the ratio of the change in length to the original length. The relationship between stress and strain is described by Hooke's Law:
) is the ratio of the change in length to the original length. The relationship between stress and strain is described by Hooke's Law:
![]()
where E is Young's Modulus, or the modulus of elasticity for the material. A high value of E indicates that the material is stiff. A low value means that the material is soft or ductile.
The strength of a material in tension is measured by its Yield Strength (the stress at which irreversible plastic deformation begins) or Ultimate Tensile Strength (UTS), the stress at which fracture occurs. Note that the UTS might be lower than the yield strength.
When a specimen is subjected to tensile stress narrowing or ‘necking’ occurs, so that the cross-sectional area is reduced. This causes the ‘true’ stress level to increase compared with the ‘engineering’ stress calculated on the basis of the original unstressed cross-section. However, engineering design practice generally limits stress to not more than about 0.2% strain, so the engineering stress–strain relationships are mostly used.
The elastic/plastic/fracture behaviour of a material is determined by its atomic or molecular structure. Atoms in solids are bound together by the interatomic or intermolecular attractive forces. E is proportional to the interatomic spacing, and it is reduced if temperature is increased. Elastic deformation extends the interatomic distances. Plastic deformation occurs when the energy applied is sufficient to cause the atomic planes, for example in a crystal, to slip along the lattice structure and take up new stable conditions. Material surfaces contain energy, in the same way as the surface of a liquid possesses surface tension, due to the fact that the interatomic attractive forces between atoms at the surface can act in only two dimensions and so do not cancel as they do within the bulk material. In solids this energy is much higher than in liquids. When fracture occurs, two new surfaces are created. This extra energy is imparted by the applied stress which causes the fracture. Knowing the surface energy of a material enables us to determine the theoretical strength. This far exceeds what we actually measure, by factors of 1000 to over 10 000. The reason for the difference is that some plastic deformation occurs at stresses much lower than the theoretical elastic limit, as actual materials contain defects that create stress concentrations, for example dislocations within crystal planes of crystalline materials (metals, metal alloys, silicon, carbon, etc.), and between molecular boundaries in amorphous materials like plastics. Very pure single crystals, such as carbon fibres, can be produced with strengths that approach the theoretical values. The practical strength of a material can be determined only by tests to failure, though theoretical knowledge of aspects such as crystal structure, uniformity, and so on, enable materials scientists to make approximate forecasts of strength.
Another important material property is toughness. Toughness is the opposite of brittleness. It is the resistance to fracture, measured as the energy input per unit volume required to cause fracture. This is a combination of strength and ductility, which is represented by the area under the stress–strain curve. Figure 8.2 shows this schematically (and very generally) for different material types.
The different patterns of behaviour represent the properties of ductility, brittleness and toughness. A ductile, weak material like pure copper will exhibit considerable strain for a given stress, and will fracture at low stress. A tough material like kevlar or titanium will have little strain and a high UTS. A brittle material like cast iron, glass or ceramic will show very little strain, but lower resistance to rapid stress application such as impact loads. Material properties, especially of metals, vary widely as a result of processes such as heat treatment and machining. In practice materials are applied so that the maximum stress is always well below the yield strength, by a factor of at least 2.

Figure 8.2 Stress–strain for different materials (generalized).
A crack will grow if the energy at the crack tip is sufficient to overcome the interatomic forces, and thus open it further. Griffith's Law expresses this:
![]()
where: σ = maximum stress at crack tip (note: not the average stress in the material).
E = modulus of elasticity.
γ = surface energy.
a = half crack length.
The maximum stress at the tip of a crack (or at any other defect or stress raiser) is proportional to the applied total stress, the size of the crack or defect, and the sharpness of the tip around which the stress is applied. The ratio of maximum stress to applied stress is the stress concentration factor. Whilst the total or average stress can usually be determined quite accurately, using methods such as finite element analysis, the maximum stress around a stress raiser, and thus the strength, is often much less certain. Stress concentrations can be reduced by designing to provide adequate radii of curvature on corners of stressed components, ensuring that material surfaces are smooth, and, in the case of cracks in sheet material, by drilling a hole at the tip of the crack to increase the radius.
Compressive strength is much more difficult to analyse and predict. It depends upon the mode of failure (usually buckling for most engineering materials and components such as steel or aluminium alloy vehicle panels, struts, and electrical connector pins) and the shape of the component. Compressive fracture can also occur, particularly in brittle materials.
Structures that have bending loads applied are subjected to both tensile and compressive stress. The upper part of a loaded cantilevered beam will be in tension, whilst the lower part will be in compression.
Stress can also be applied in shear. A common practical example is solder joints that connect surface-mounted electronic components (integrated circuit packages) to circuit boards: during operation the temperature rise in the component causes thermal expansion relative to the circuit board, thus applying shear stresses to the solder joints.
The discussion above has presented a very brief overview of the topic. In most cases of applied stress the material behaviour is more complex, since combined effects occur. For example, a component in tensile stress will be caused to be compressed in the directions perpendicular to the tensile stress, so there will be a compressive stress also. Bending loads cause varying tensile and compressive stress from top to bottom of the beam, and therefore shear stress within the beam. Fracture in compression might be caused by shear stresses generated in the material. Finite element analysis (FEA), using modern software, can be used to analyse complex loading situations. However, it is nearly always necessary to test structural components to determine their true strength, especially if the designs are not simple.
8.3 Fatigue
Fatigue damage within engineering materials is caused when a repeated mechanical stress is applied, the stress being above a limiting value called the fatigue limit. Fatigue damage is cumulative, so that repeated or fatigue limit above the fatigue limit will eventually result in failure. For example, a spring subjected to cyclic extension beyond the fatigue limit will ultimately fail in tension.
Fatigue is a very important aspect of reliability of structures subject to repetitive stress, for example from repeated load application, aerodynamic loading, and vibration, since the critical stress can be less than a quarter of the static fracture strength, and fracture can occur after 107 to 108 cycles when the applied stress is less than half the static strength.
The fatigue damage mechanism is the formation of microcracks resulting from the energy imparted to crystal boundaries by the cyclic stresses. The cracks then continue to extend along these lines of weakness, which act as stress concentrators. Like static fracture mechanics, quantification and prediction is largely empirical and based on experiment, but the degree of uncertainty is much higher.
Initiation and growth rate of the cracks varies depending upon the material properties and on surface and internal conditions. The material property that imparts resistance to fatigue damage is the toughness. As described above, the stresses around the tip of a crack or other defect (such as a machining scratch on a component or a void or inclusion in a casting or forging) are much higher than those in the bulk of the material, so concentrating the energy at these locations. We can demonstrate this easily by repeatedly bending a straightened paperclip through 180 °. Being of ductile material, the clip will not fracture on the first bending. However, the alternating tensile and compressive stresses will generate cumulative fatigue damage, leading to fracture after typically about 20 cycles. If we now repeat the experiment, but now test paperclips which have been lightly cut with a sharp modelling knife, they will fracture in typically five cycles or fewer.
Figure 8.3 shows the general, empirical relationship between stress and cycles to fracture. This is a log-log plot of the stress σ and the number of cycles N to failure, which is called the S–N curve. Below the fatigue limit the life is indefinite, but higher stress levels induce cumulative damage, leading ultimately to failure. The S–N curve indicates the cycles to failure at any cyclic stress value between the ultimate stress and the fatigue limit σ' and analytically expressed by Eq. (8.3).
![]()
where: N = Number of cycles to failure.
σ = cyclic stress value.
b = fatigue exponent.
A = empirical constant.
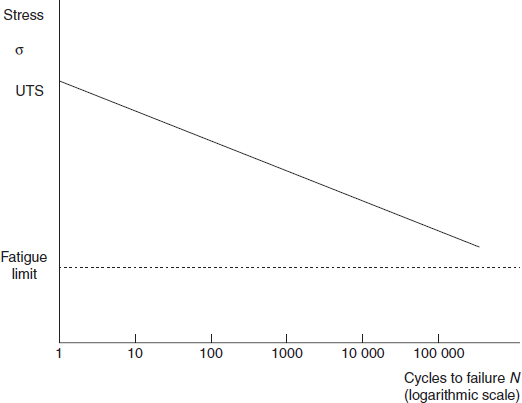

The curve indicates the mean value of cyclic load for a given number of cycles to failure (or vice versa). The population cycles to failure would in fact be distributed.
The basic S–N curve shows the simplest situation, in which a uniform cyclic load is applied. In the more general practical case, with randomly distributed stresses as shown in Figure 8.4, the population distribution of cycles to failure will have an additional variability and we will not know how much damage has been inflicted.
The fatigue life of an item subject to varying stress can be estimated using Palmgren-Miner's Law (more often referred as Miner's Rule). This is expressed as
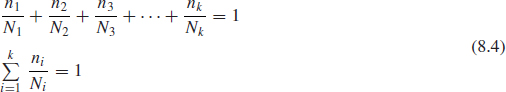
where ni is the number of cycles at a specific stress level, above the fatigue limit, and ni is the median number of cycles to failure at that level, as shown on the S–N curve.
The fatigue life of an item subject to an alternating stress with a mean value of zero is
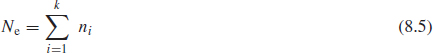
Ne is called the equivalent life, and when used with the S–N diagram gives an equivalent steadily alternating stress, at which damage will occur at the same rate as under the varying stress conditions.
Example 8.1
Load data on a part indicate that there are three values which exceed the fatigue limit stress of 4.5 × 10⁸ Nm−2. These values occur during operation in the following proportions:
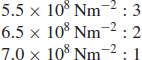

Figure 8.5 S–N diagram for the part in Example 8.1.
Evaluate the equivalent constant dynamic stress.
The S–N diagram for the material is shown in Figure 8.5. The cycles to failure at each overstress level are:

Therefore, from (8.4) where C is an arbitrary constant,

From (8.5)
![]()
From the S–N diagram, the equivalent constant dynamic stress is 6.3 × 10⁸ ![]() .
.
Figure 8.6 shows an S–N diagram for a population of items, with the strength and applied stress distributions also shown. The stress distribution tail extends beyond S′, thus generating fatigue damage, and the mean of the strength distribution is therefore reduced. The strength distribution variance increases as items incur different amounts of fatigue damage. At N′, the tails of the load and strength distribution interfere, and we enter the increasing hazard rate period.
Population times to failure in fatigue are typically log normal or Weibull distributed, as shown by the pdf. The variance is large, typically an order of magnitude even under controlled test conditions, and much larger under random service environments, particularly when other factors such as temperature stress, corrosion, damage, or production variation extend the left-hand tail of the life distribution. Therefore fatigue lives are predicted conservatively, particularly for critical components and structures. However, reliability values calculated in this way are subject to considerable uncertainty. The usual practice in designing for a safe life is to estimate the equivalent cycles to failure and to assign a safe life based upon the expected variation in Ne. However, the predicted safe life should always be confirmed by carrying out life tests, using simulated or actual environments, and actual production items.

Figure 8.6 Strength deterioration with cyclic stress.
Analyses of time to failure in test and service situations can be performed using Weibull probability plots. Weibull distributions of times to failure show a positive failure-free life (γ) and slope (β) values greater than 1 (typically 2–3.5), that is, an increasing hazard rate with failures starting after the safe life interval. This life is sometimes referred as the ‘B-life’ (see Chapter 3, Section 3.4.5 for more details). B-lives are also used to define the lives of components subject to wear, e.g. bearings.
Generally for metals the fatigue life is not affected by the rate at which stress cycling is applied. This is due to the fact that, since they are good thermal conductors, any energy converted to heat is readily conducted away so there is little or no temperature rise. However, plastics generally are more likely to be locally heated by high rates of stress reversals, and this, coupled with their lower melting points and other properties, such as the glass transition temperature, can result in reduced fatigue lives at high cycle rates.
Composite materials, such as fibre-reinforced structural components, can be designed and manufactured to have tailored mechanical properties, since the stresses are transmitted primarily through the fibres rather than through the bulk material. Failure of composite components can be due to delamination or separation of the fibres, or fracture of the whole component.
Fatigue life is affected by other factors, mainly temperature and corrosion. High temperature accelerates crack growth rates, by maintaining the critical energy levels at the crack tips. Corrosion can greatly accelerate crack propagation. Complex loading situations, for example vibration superimposed on a static load, can also reduce fatigue life.
The fracture surfaces of fatigue failures typically show characteristic ‘rings’ spreading out from the initial fatigue crack as it progressively grows, and a granular area where the final fracture occurs (Figure 8.7).
The fatigue behaviour of designs can be analysed using software that combines FEA and material property data. However, the software assumes (unless otherwise instructed) that material surfaces are smooth and not damaged, and that no other effects such as corrosion are present. Software for fatigue life prediction evaluates expected (average) lifetimes and variations around these, not the possible time to the first failure. The correctness of the outputs depends on the correctness of the input descriptions such as surface conditions, the adequacy of the mesh being used, and understanding of the underlying mechanics and physics. Small errors or omissions in the mesh or other inputs can diverge and result in large errors in the predicted behaviour. The references under fracture mechanics in the bibliography provide good introductions to the material properties described above.

Figure 8.7 Typical fatigue failure (schematic).
8.3.1 Design against Fatigue
Design for reliability under potential fatigue conditions means either ensuring that the distributed load does not exceed the critical load or designing for a limited ‘safe life’, beyond which the item is not likely to be used or will be replaced in accordance with a maintenance schedule. If we can ensure these conditions, then failure should not occur.
However, in view of the wide variation of fatigue lives and the sensitivity to stress and other environmental and material conditions, this is not easy. The following list gives the most important aspects that must be taken into account:
- Knowledge must be obtained on the material fatigue properties, from the appropriate data sources, and, where necessary, by test. This knowledge must be related to the final state of the item, after all processes (machining, etc.) which might affect fatigue.
- Stress distributions must be controlled, by careful attention to design of stress concentration areas such as holes, fixings and corners and fillets. The location of resonant anti-nodes in items subject to vibration must be identified. Finite element and nodal analysis methods are used for this work. (See later section on vibration.)
- Design for ‘fail safe’, that is, the load can be taken by other members or the effect of fatigue failure otherwise mitigated, until the failed component can be detected and repaired or replaced. This approach is common in aircraft structural design.
- Design for ease of inspection to detect fatigue damage (cracks), and for ease of repair.
- Use of protective techniques, such as surface treatment to relieve surface stresses (shot peening, heat treatment), increasing surface toughness (nitriding of steels, heat treatment), or provision of ‘crack stoppers’, fillets added to reduce the stress at crack tips.
- Care in manufacture and maintenance to ensure that surfaces are not damaged by scratches, nicks, or impact.
8.3.2 Maintenance of Fatigue-Prone Components
It is very important that critical components subject to fatigue loading can be inspected to check for crack initiation and growth. Maintenance techniques for such components include:
- Visual inspection.
- Non-destructive test (NDT) methods, such as dye penetrants, X-ray and acoustic emission tests.
- Where appropriate, monitoring of vibration spectra.
- Scheduled replacement before the end of the fatigue life.
The scheduling and planning of these maintenance techniques must be based upon knowledge of the material properties (fatigue life, crack propagation rates, variability), the load duty cycle, the effect of failure, and test data. See Chapter 16 for a more detailed discussion of maintenance planning principles.
8.4 Creep
Creep is the gradual increase in length of a component that is subjected to combined continuous or cyclic tensile stress and high temperature. Creep is a plastic (i.e. permanent) deformation, which occurs when the material temperature exceeds about 50% of the melting point, on the absolute temperature scale. The effect is significant with components like turbine discs and blades in gas turbine engines, due to the combined very high temperatures and centrifugal forces. It has recently become a problem in electronics assemblies using surface mount components. Since solder melts at about 183 °C, system operating temperatures are generally within the creep temperature range. Therefore, permanent deformation takes place due to the shear stresses imposed by thermal cycling. The deformation in turn can result in higher shear stresses, thus accelerating the fatigue mechanism.
8.5 Wear
8.5.1 Wear Mechanisms
Wear is the removal of material from the surfaces of components as a result of their movement relative to other components or materials. Wear can occur by a variety of mechanisms, and more than one mechanism may operate in any particular situation. The science and methods related to understanding and controlling wear in engineering comprise the discipline of tribology. The main wear mechanisms are described below.
Adhesive wear occurs when smooth surfaces rub against each other. The contact load causes interactions between the high spots on the surfaces and the relative motion creates local heating and dragging between the surfaces. This results in particles being broken or scraped off the surfaces, and loose particles of wear debris are generated.
Fretting is similar to adhesive wear, but it occurs between surfaces subject to small oscillatory movements. The small movements prevent the wear debris from escaping from the wear region, so the particles are broken up to smaller sizes and might become oxidized. The repeated movements over the same parts of the surface also result in some surface fatigue, and corrosion also contributes to the mechanism.
Abrasive wear occurs when a relatively soft surface is scored by a relatively hard surface. The wear mechanism is basically a cutting action often with displacement of the soft material at the sides of grooves scored in the soft material.
Fluid erosion is caused to surfaces in contact with fluids, if the fluid impacts against the surfaces with sufficient energy. For example, high velocity fluid jets can cause this type of damage. If the fluid contains solid particles the wear is accelerated. Cavitation is the formation and violent collapse of vacuum bubbles in flowing liquids subject to rapid pressure changes. The violent collapse of the vacuum bubbles on to the material surfaces causes fluid erosion. Pumps, propellers and hydraulic components can suffer this type of damage.
Corrosive wear involves the removal of material from a surface by electrolytic action. It is important as a wear mechanism because other wear processes might remove protective films from surfaces and leave them in a chemically active condition. Corrosion can therefore be a powerful additive mechanism to other wear mechanisms.
8.5.2 Methods of Wear Reduction
The main methods of wear reduction are:
- Minimize the potential for wear in a design by avoiding as far as practicable conditions leading to wear, such as contact of vibrating surfaces.
- Selection of materials and surface treatments that are wear-resistant or self-lubricating.
- Lubrication, and design of efficient lubricating systems and ease of access for lubrication when necessary.
When wear problems arise in use, an essential starting point for investigation is examination of the worn surfaces to determine which of the various wear mechanisms, or combinations of mechanisms, is involved. For example, if a plain bearing shows signs of adhesive wear at one end, the oil film thickness and likely shaft deflection or misalignment should be checked. If the problem is abrasive wear the lubricant and surfaces should be checked for contamination or wear debris.
In serious cases design changes or operational limitations might be needed to overcome wear problems. In others a change of material, surface treatment or change of lubricant might be sufficient. It is also important to ensure that lubricant filtration, when appropriate, is effective.
8.5.3 Maintenance of Systems Subject to Wear
The life and reliability of components and systems subject to wear are very dependent upon good maintenance. Maintenance plans should be prepared, taking into account cleaning and lubrication requirements, atmospheric and contamination conditions, lubricant life and filtration, material properties and wear rates, and the effects of failure. In appropriate cases maintenance also involves scheduled monitoring of lubricant samples, using magnetic plugs to collect ferrous particles and spectroscopic oil analysis programmes (SOAP) to identify changes in levels of wear materials. Vibration or acoustic monitoring is also applied. These techniques are used in systems such as industrial and aero engines, gearboxes, and so on.
Neale (1995) and Summers-Smith (1994) are excellent introductions to tribology and wear.
8.6 Corrosion
Corrosion affects ferrous and some other non-ferrous engineering metals, such as aluminium and magnesium. It is a particularly severe reliability problem with ferrous products, especially in damp environments. Corrosion can be accelerated by chemical contamination, for example by salt in coastal or marine environments.
The primary corrosion mechanism is oxidation. Some metals, particularly aluminium, have oxides which form as very hard surface layers, thus providing protection for the underlying material. However, ferrous alloys do not have this property, so oxidation damage (rust) is cumulative.
Galvanic corrosion can also be a problem in some applications. This occurs when electromotive potentials are built up as a result of dissimilar metals being in contact and conditions exist for an electric current to flow. This can lead to the formation of intermetallic compounds and the acceleration of other chemical action. Also, electrolytic corrosion can occur, with similar results, in electrical and electronic systems when induced currents flow across dissimilar metal boundaries. This can occur, for example, when earthing or electrical bonding is inadequate. Electrolytic corrosion affects the most electrically active element in the circuit.
Stress corrosion is caused by a combination of tensile stress and corrosion damage. Corrosion initiates surface weaknesses, leading to crack formation. Further corrosion and weakening occurs at crack tips, where the metal is in a chemically active state and where the high temperatures generated accelerate further chemical action. Thus the combined effect can be much faster than either occurring alone.
Design methods to prevent or reduce corrosion include:
- Selection of materials appropriate to the application and the expected environments.
- Surface protection, such as anodizing for non-ferrous metals, plasma spraying, painting, metal plating (galvanizing, chrome plating), and lubrication.
- Other environmental protection, such as the use of dryers or desiccators.
- Avoidance of situations in which galvanic or electrolytic corrosion can occur.
- Awareness and avoidance of conditions likely to generate stress corrosion.
Correct maintenance is essential to ensure the reliability of corrosion-prone components. Maintenance in these situations involves ensuring the integrity of the protective measures described above. Since corrosion damage is usually extremely variable, scheduled maintenance should be based upon experience and criticality.
Revie (2011) describes corrosion in detail.
8.7 Vibration and Shock
Components and assemblies can be subjected to vibration and shock inputs, during use, transport or maintenance. Vibration and shock can cause:
- Fracture due to fatigue, or due to mechanical overstress.
- Wear of components such as bearings, connectors, and so on.
- Loosening of fasteners, such as screws, bolts, and so on.
- Leaks in hydraulic and pneumatic systems, due to wear of seals or loosening of connectors.
- Acoustic noise (10–10 000 Hz).
Common vibration inputs are:
- Reciprocating or rotating machinery. The dominant vibration frequency (Hz) generated by rotating masses will be rm./60.
- Wheel vibration, on road and rail vehicles.
- Aerodynamic effects on aircraft and missile structures.
- – Pressure fluctuations in hydraulic and pneumatic systems.
- Acoustic noise.
Vibration of a structure may occur at a fixed frequency, at different frequencies over time, or simultaneously over a range of frequencies. Vibration over a wide range of simultaneous frequencies is called broad band vibration. Vibration can occur in or about different linear and rotating axes.
The important units in relation to sinusoidal vibration are:
- Frequency (Hz).
- Displacement (mm), defined as peak or peak-to-peak values.
- Velocity (m/s), defined as peak values.
- Acceleration (m/s2 or gn), defined as peak values.
Every structure has one or more resonant frequencies, and if the vibration input occurs at these, or at harmonics, vibration displacements will be maximized. The locations at which zero vibration displacements occur are called nodes, and maximum displacement amplitudes occur at the anti-nodes. There may be more than one resonant frequency within the expected environmental range, and these may exist along different axes. There may also be more complex resonance modes, such as torsional or combinations of mechanical, acoustic, rotational or electromechanical modes. Sometimes simultaneously occurring resonances might be important, for example two components that vibrate in different modes or at different frequencies and in so doing impact one another. Examples are electronic circuit boards, hydraulic pipes and vehicle panels.
The resonant frequency is proportional to the stiffness of the structure, and inversely proportional to the inertia. Therefore, to ensure that resonant frequencies are well above any input vibrations that might be applied, structures must be sufficiently stiff, especially where there are relatively heavy parts, such as large components on circuit boards.
The vibration amplitude at any frequency is reduced by damping. Damping can also change the resonant frequency. Damping is provided in hydraulic and pneumatic systems by accumulators, in suspension and steering systems by mechanical dampers, and by using anti-vibration mountings for motors, electronic boxes, and so on.
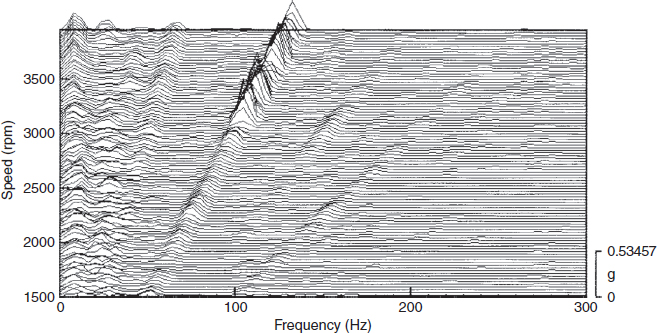
The pattern of vibration as a function of other parameters, such as engine speed, can be shown on a waterfall plot. Figure 8.8 is an example. Waterfall plots help to indicate the sources of vibration and noise. For example, a resonance, that is independent of speed shows as a vertical line, and one that is generated at a particular speed shows peaks running horizontally. The peak heights (or colours on colour map displays) indicate the amplitudes.
Shock loads can cause vibration, though the amplitude is usually attenuated due to inherent or applied damping. Shock loads are only a particular type of vibration input: relatively high intensity and frequency, for short intervals.
Piersol and Paez (2009) provides a comprehensive treatment of the subject and Steinberg (2000) describes applications to electronics. Testing methods for vibration and shock will be covered in Chapter 12.
8.8 Temperature Effects
Failures can be caused by materials being subjected to high or low temperatures. The main high temperature failure modes are:
- Softening and weakening (metals, some plastics).
- Melting (metals, some plastics).
- Charring (plastics, organic materials).
- Other chemical changes.
- Reduced viscosity or loss of lubricants.
- Interaction effects, such as temperature-accelerated corrosion.
Low-temperature effects can include embrittlement of plastics, increasing viscosity of lubricants, condensation and freezing of condensation or coolants.
Most temperature effects are deterministic (melting points, condensation temperatures, freezing points, viscosities). Effects such as these are not cumulative, so time and numbers of temperature cycles do not directly affect reliability. However, secondary effects might be cumulative, for example the effects of lubricant viscosity on rate of wear.
All materials have a thermal coefficient of expansion (TCE). If two components with different TCEs are attached to one another, or two attached components can experience different temperatures, then mechanical stresses will be set up. An important example of this situation is the attachment of electronic components to circuit boards or other substrates, particularly surface mount integrated circuit packages as described in Chapter 9. When the IC is powered and operated heat is generated, so the package temperature rises. The heat is transferred through the package and the solder joints to the circuit board (which might include a ‘heat plane’, to improve heat dissipation). The thermal resistance of the heat flow path from the package to the eventual heat sink will result in the package being hotter than the board, and in the board temperature rise lagging that of the package. If power is cycled, the temperature differences will be also. This will result in cyclic shear stresses being imparted to the solder joints. The magnitude of these stresses can lead to fatigue failures, in the form of cracks running through the joint. These in turn can cause electrical failure, often of an intermittent nature, after a sufficient number of cycles. This type of failure is particularly important in electronic systems that must withstand many on–off cycles, such as engine control systems. If the systems are also subjected to vibration, the combined effects of thermal and vibration cycling can be highly interactive.
Chemical reactions, gaseous and liquid diffusion and some other physical processes are accelerated by increasing temperature. Arrhenius’ Law expresses this phenomenon:
![]()
where: R = process rate.
K = constant.
EA = activation energy for the process (varies depending on the material and/or failure mechanism).
K = Boltzmann's constant.
T = Absolute temperature, K.
Typically, chemical process rates increase by a factor of 2 for every 10–20°C rise in temperature. An important group of processes that can be thermally accelerated is corrosion, particularly rusting of iron and steel.
8.8.1 Humidity and Condensation
Damp environments can cause or accelerate failure processes such as corrosion and mould growth. Temperature and humidity are closely related, humidity being inversely proportional to temperature until the dew point is reached, below which moisture condenses on to surfaces. Liquid water can cause further failures, including:
- Chemical corrosion, if contamination is also present.
- Electrolytic corrosion, by providing an electrolyte.
- Short circuiting of electrical systems, particularly within connectors.
- Mould growth.
Plastics are generally hygroscopic, that is, they absorb moisture, whether above or below the dew point. Therefore any components that are encapsulated in plastics, particularly electronic components and assemblies, are in principle prone to moisture ingress. This presented until fairly recently a major limitation on the application of plastic encapsulated components, since they suffered corrosion of the aluminium conductor metalization when used in high humidity environments. Their use in military and aerospace systems was banned. However, modern components such as integrated circuits have much improved protection against moisture, due to better control of the chip's surface protective layer and control of the plastic material purity and the encapsulating process, so that today there are few limitations on their application, and moisture-related failures are very rare.
8.9 Materials
Selection of appropriate materials is an important aspect of design for reliability, and it is essential that designers are aware of the relevant properties in the application environments. With the very large and increasing range of materials available this knowledge is not easy to retain, and designers should obtain data and application advice from suppliers as well as from handbooks and other databases. A few examples of points to consider in selecting engineering materials for reliability are given below. The list is by no means exhaustive, and it excludes obvious considerations such as strength, hardness, flexibility, and so on, as appropriate to the application.
8.9.1 Metal Alloys
- Fatigue resistance.
- Corrosion environment, compatibility.
- Surface protection methods.
- Electrochemical (electrolytic, galvanic) corrosion if dissimilar metals in contact.
8.9.2 Plastics, Rubbers
- Resistance to chemical attack from materials in contact or in the local atmosphere (lubricants, pollutants, etc.).
- Temperature stability (dimensional, physical), and strength variation at high and low temperature.
- Sensitivity to ultraviolet radiation (sunlight).
- Moisture absorption (all plastics are hygroscopic).
8.9.3 Ceramics
Brittleness, fracture toughness.
8.9.4 Composites, Adhesives
- Impact strength.
- Erosion.
- Directional strength.
Crane et al. (1997) is an excellent source of information on selection of engineering materials.
8.10 Components
The range of mechanical components is vast, ranging from springs, seals and bearings to engines, pumps and power transmission units. Even amongst the most basic components there is little standardization, and new products and concepts are constantly being developed. It would not be feasible to attempt to provide guidance on the detailed reliability aspects of such a range in this chapter, but some general principles should be applied:
- All relevant aspects of the component's application must be carefully evaluated, using the techniques described in the previous chapters. Where experience exists of application in another system, all data on past performance should be used, such as modes and causes of failure, application conditions, durability, and so on. It is essential to discuss the application fully with the supplier's applications engineers, to the extent of making them effectively part of the design team, with commitment to the success of the product.
- Use mature components in preference to new ones unless there are clear overriding reasons of cost, performance, and so on. Novelty, even when the risks seem insignificant, often introduces unpleasant surprises. All new components should be placed on the critical items list (see Chapter 6).
- Minimize the number of components and of component types. Whether a spring or a hydraulic pump, this approach not only reduces costs of the product and of assembly, but also can improve reliability. For example, where a mechanism such as a paper feed requires springs, cams and levers, careful study of the problem can often reveal ways in which one component can perform more than one function.
- Pay attention to detail. It is very often the simple design problems which lead to unreliability, because insufficient attention was paid to them. For example, spring attachment lugs on plastic components that break as a result of the hard spring material cutting through (a metal bush could be a solution), and the location of components so that they suffer contamination from water or oil, or are difficult to fit and adjust, are common examples of failure to apply design skills and experience to the ‘simple’ jobs.
8.11 Processes
Designers must be aware of the reliability aspects of the manufacturing processes. Machining processes create variations in dimensions, which can affect wear and fatigue properties. Processes designed to improve material properties must be considered and designed for. For example, heat treatment, metal plating, anodizing, chemical treatment, and painting require careful control if they are to be effective, and the design of the product and of its methods of assembly must ensure that these processes can be applied correctly and efficiently.
Other processes that can affect reliability include:
8.11.1 Fasteners
A huge range of different fastening methods and systems is available, including rivets, bolts and nuts, clamps, adhesives, and so on. Fasteners can loosen under vibration or as a result of temperature cycling. Fasteners can fail due to fatigue, and fatigue cracks can start at holes for rivets and bolts.
Bolts and nuts can be combined with locking devices to prevent loosening. These include deformable plastic inserts, spring washers, crush washers, split pin retainers, adhesives, locking wires, and so on. The integrity of many locking devices can be degraded if they are used more than once. Bolts and nuts used in some applications must be accurately torque loaded to ensure that the correct holding force is applied, and that the fasteners are not over-stressed on assembly.
8.11.2 Adhesives
Adhesives are used for many assembly operations, including aircraft and other vehicle structures, electronic component mountings on to heat sinks, locking of bolts and nuts, and so on. The most commonly used industrial adhesives are epoxy plastics and cyanoacrylics. Epoxies are two-component adhesives which must be mixed shortly before use. Cyanoacrylics are contact adhesives that form an instant bond. Other adhesive compounds and systems include elastomerics (used in applications such as vibration isolation) and adhesive tapes.
All adhesives require careful preparation and cleaning of the surfaces to be bonded, and they all have limitations in relation to the kinds of materials they can bond. Adhesives also have temperature limits, and generally cannot withstand temperatures above 200 °C.
8.11.3 Welding and Soldering
Metals can be joined by welding, and several different welding methods are used, depending on the materials and the application. Steel structures are welded with electric arcs or oxy-acetylene gas torches. Alloys such as of aluminium and magnesium, which burn in oxygen, are arc welded in inert gas (argon). Car assemblies are spot welded by robots applying pressure and high electric current to form resistance welds. Surfaces can also be welded by friction (high pressure and vibration, including ultrasonic welding of gold wire bonds on microelectronic assemblies).
Tin–lead solder has been by far the most common method for connecting electronic and electrical components within systems, though lead-free solders are becoming more widely used. It also serves as a structural connection. Soldering for electronics assembly is described in Chapter 9.
8.11.4 Seals
Seals are used to prevent leaks in systems such as water, oil hydraulic and pneumatic components and pipe connections, around rotating shafts and reciprocating actuator rams, and to protect items in sealed containers. Special seals include those to block electromagnetic radiation from or into electronic equipment enclosures.
The effectiveness of seals is always influenced by control of assembly operations, and often also by maintenance. They are always affected by usage (wear, erosion, etc.), so they tend to degrade over time and use.
Summers-Smith (1994) is a good introduction to engineering seals.
Chapter 15 covers the control of manufacturing processes. However, it is essential that the capabilities and problems of these are given as much consideration in design as aspects such as performance and cost. The manufacturing operations affect these aspects also, so a fully integrated approach, as described in Chapters 7 and 15, must be followed. Production and quality engineers must be included in the design team, and not left to devise production methods and quality standards after the design has been finalized.
Questions
- Sketch and annotate the general strain behaviour of materials subjected to tensile stress. Show how this differs for brittle, tough and ductile engineering materials, and give examples of each.
- Explain why the actual mechanical strength of engineering components is very much less than the theoretical strength. How does this difference affect the predictability of strength?
- Briefly describe the three most common causes of strength degradation of mechanical components. Give examples of each, with descriptions of methods used to prevent or reduce the chances of failure.
- Miner's rule is used to predict the expected time to failure in fatigue:
- Write down the mathematical expression for Miner's rule.
- A component was tested in the laboratory to determine its fatigue life. The test results were as follows:

The component will be used in service with these stress levels occurring in the following proportions, respectively:
Proportion of cycles 0.5 0.3 0.2
What will be the expected time to failure in service, if the stress cycle rate is 1000 per hour?
- Comment on the factors that would influence the accuracy of this prediction.
- A component designed for a cyclic mechanical stress application has been analysed to determine its likely fatigue life. Comment on the approach that you would apply for ensuring that failures do not occur if the component is:
- A steel mounting bracket for an actuator on an earthmoving machine.
- An aluminium alloy mounting bracket for a flight control actuator on an aircraft.
- A plastic part in a copying machine.
- Two basic approaches can be applied in the design of components and structures that can fail as a result of fatigue damage. These are the fail-safe and safe-life approaches. Describe these, discuss the factors that would determine which approach is appropriate, and give examples of their application.
- Describe briefly three methods that can be applied to reduce the likelihood of failure of components and structures owing to fatigue.
- Describe three types of wear processes that can lead to failure of surfaces in moving contact. Describe how one of these can be minimized by designers.
- Corrosion can cause failure of metallic parts. Describe three corrosion processes. How can each be minimized by designers?
- You are designing an electronic unit that will be used on an agricultural machine. What failures might be caused by the vibration environment? What steps would you take to minimize these?
- Describe briefly the effect of temperature on (give temperature values where appropriate, and consider also the effects of temperature cycles):
- The strength of a solder joint used to retain a heavy electronic component.
- The properties of a lubricating oil.
- An electronic unit located outdoors.
- Corrosion.
- Fatigue testing of a metal alloy resulted in the S-N curve:

Where N is number of cycles to failure and σ is the stress amplitude in MPa. The alloy is used in the design of an aircraft engine that under normal use will experience 120 cycles per second under a stress amplitude of 72.2 MPa. The typical engine will operate 450 hours per year. If the engine is being designed for a 12 yr life, is this the right choice of material?
Bibliography
Fracture mechanics
Anderson, T.L. (2005) Fracture Mechanics, CRC Press.
Collins, J.A. (1981) Failure of Materials in Mechanical Design, J. Wiley.
Dowling, N.E. (2006) Mechanical Behaviour of Materials, 2nd edn, Pearson Education.
Gordon, J.E. (1991) The New Science of Strong Materials, Penguin Books.
Wear
Neale, M.J. (1995) The Tribology Handbook, 2nd edn, Butterworth-Heinemann.
Summers-Smith, J.D. (1994) An Introductory Guide to Industrial Tribology, Mechanical Engineering Publications.
Corrosion
Revie, R.W. (2011) Uhlig's Corrosion Handbook, 3rd edn, J. Wiley.
Piersol, A.G. and Paez, T.L. (2009) Harris’ Shock and Vibration Handbook, 6th edn, McGraw-Hill.
Steinberg, D. (2000) Vibration Analysis for Electronic Equipment, 3rd edn, Wiley.
Materials and components
Brostow, W. and Corneliussen, R. (1986) Failure of Plastics, Hanser.
Crane, F.A., Charles, J.A. and Furness, J.A. (1997) Selection and Use of Engineering Materials, 3rd edn, Butterworth-Heinemann.
Summers-Smith, J. (1992) Mechanical Seal Practice for Improved Performance, 2nd edn, Mechanical Engineering Publications.