
Chapter 15
Number Crunching with the Total Row
In This Chapter
![]() Doing more with the Total row
Doing more with the Total row
![]() Uncovering the Total row in your query grid
Uncovering the Total row in your query grid
![]() Organizing with Group By
Organizing with Group By
![]() Summing your results
Summing your results
![]() Counting everything at one time
Counting everything at one time
Ever need to know how many orders were placed in the past month? Or total donations for last year? How about the top ten best-selling products for the current year? If you answered yes to any of these questions (or have similar questions that need answering), then this chapter is for you. Here I discuss the fabulous Total row. The Total row does it all for your data! Well, actually, it summarizes your data via the select query. (If you don’t know what a select query is or how to create one, I suggest you go back and read Chapter 13 before beginning the material in this chapter.)
Say Hello to the Total Row
In Chapter 13, I show you how simple select queries can fetch data, such as a list of volunteers who reside in California or all the details of tofu sales. The Total row takes the select query one step further and summarizes the selected data. The Total row can answer questions such as, “How many of our volunteers reside in California?” and “How much money did we make in tofu sales last month?” It can also do statistical calculations, such as standard deviations, variances, and maximum and minimum values. For a complete list of what the Total row can do for each field selected in the Field row, see Table 15-1.
Table 15-1 Total Row Functions
|
Instruction |
What It Does |
|
Group By |
Groups the query results by the field’s values. |
|
Sum |
Totals all the values from this field in the query results. |
|
Avg |
Averages the values in this field in your query results. |
|
Min |
Tells you the lowest value found in the field. |
|
Max |
Reports the highest value found in the field. |
|
Count |
Counts the number of records that match the query criteria. |
|
StDev |
Figures the statistical standard deviation of the values in the field. |
|
Var |
Calculates the statistical variance of the values in the field. |
|
First |
Displays the first record that meets the query criteria. |
|
Last |
Displays the last record that meets the query criteria. |
|
Expression |
Tells Access that you want a calculated field. (See Chapter 16 for the different calculations Access can perform.) |
|
Where |
Uses the field for record-selection criteria, but doesn’t summarize anything with it. |
To make Access perform these calculations, you must first group your records together by using the Total row’s Group By function. (The Total row makes an appearance in Figure 15-1.) As you might imagine, Group By treats multiple repeated instances of information as one. It puts all the Californians together on one row so you can count the number of Californians in your database. Typically, you apply Group By to a text or ID field and the remaining functions in the Total row on numeric fields.

Figure 15-1: The Total row appears between the Table and the Sort rows.
The most commonly used items among the Total row’s offerings are Group By, Sum, Avg, Count, and the odd-sounding option Where. Later sections in this chapter go into more depth about these items — explaining what they do, how to use them, and why you really do care about all this stuff.
Adding the Total Row to Your Queries
By default, Access always assumes you want a simple select query. You must tell it specifically that you want to summarize your data; adding the Total row to your query does the trick.
Okay, enough chatter about the Total row; it’s time to get busy. Make sure you’re in Design view, and then follow these steps to create summary queries with the Total row:
-
Create a new select query or open an existing select query that contains the data you want to summarize.
 If you’re scratching your head at this point, refer to Chapter 13 for information on creating select queries.
 -
Turn on the Total row by clicking the Totals button in the Show/Hide group of the Design Ribbon’s Query Tools tab.
The Total row appears between the Table and Sort rows on the query grid. For every field already in your query, Access automatically fills the Total row with its default entry, Group By.
 The Totals button displays the Greek letter sigma (Σ). Mathematicians, engineers, and others with questionable communication skills use this symbol when they mean “give me a total.”
 -
To change a field’s Total entry from Group By to something else, click that field’s Total row.
The blinking-line cursor appears in the Total row, right next to a down-arrow button.
-
Click the down-arrow button in the field’s Total row and then select the new Total entry you want from the drop-down menu that appears.
The new entry appears in the Total row.
-
Make any other changes you want and then run the query.
By setting values in the Total row, the query results automatically include the summary (or summaries) you selected. How about that?
The following section shows how to use the most popular and useful Total row options.
Working Out the Total Row
This section focuses on the most commonly used items in the Total row’s toolbox: Group By, Sum, Count, and Where. Remember, the choice made in the Total row applies to the field selected in the Field row above it.
Unless you’re a statistician or scientist, the information in this chapter should suffice for all your Total row needs. Even though I don’t discuss standard deviations or variances, they work the same way as Sum or Count. Check the Access Help system (press F1 on your keyboard) for more about the less popular Total row functions.
 Most Total row options perform well by themselves, but they also work well with others. When you run multiple queries, try using several different options together to save yourself time. It takes some practice to ensure that everything works the way you want, but the benefits (more information with less effort) make up for the investment.
Putting it together with Group By
The Group By instruction has two functions:
- To organize your query results into groups based on the values in one or more fields.
- To eliminate duplicate entries in your results.
When you turn on the Total row in your query grid, Access automatically puts in a Group By for every field on the grid. Group By combines like records so that the other Total row instructions (such as Sum and Count) can do their thing. So to make effective use of the Total row, your query must return one or more fields that contain duplicate information across records.
- Putting a single Group By instruction in a query tells Access to total your results by each unique value in that field (by each volunteer or product name, for example). Each unique item appears only once in the results, on a single line with its summary info.
- If you include more than one Group By instruction in a single query (such as the one shown in Figure 15-2), Access uses the Group By instruction to build a summary line for every unique combination of the fields. Grouping works like sorting. Access groups by the position of grouped fields from left to right in query design. It’ll group by the closest field to the left first, the second closest field to the left second, and so on.
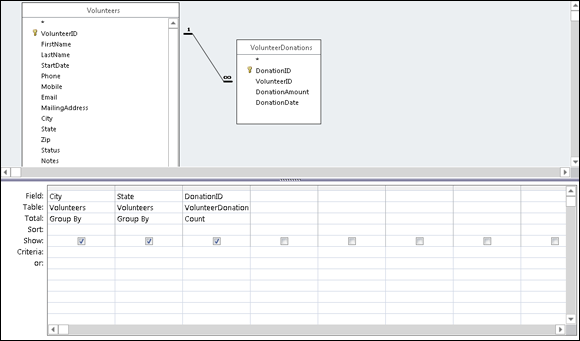
Figure 15-2: This query counts the donations for every combination of data in the City and State fields.
Put the Group By instruction into the field you want to summarize — the one that answers the question, “What do you want to count by?” or “What needs totaling?” To count California volunteers (for example), group by the State field in your table. To produce a list of total dollar donations by volunteer, you need to group by the FirstName and LastName fields.
When you use Group By, Access sorts the results automatically, in an order based on the field you specified with the Group By instruction. If you put Group By in the State field, for example, Access sorts your results alphabetically by the contents of that field. To override this behavior and choose a different sorting order, just use the Sort row in your query grid. Here’s how:
- Choose the field that you want to sort everything by.
-
Put the appropriate sorting command (Ascending or Descending, depending on your needs) in that field’s Sort row, as shown in Figure 15-3).
Access organizes the query results in the indicated order.

Figure 15-3: Make Access sort your results the way you want with a quick click in the query grid’s Sort row.
Well, that certainly sums it up
Sum finds the total value of numeric fields:
- When you put the Sum instruction in a field, Access totals the values in that field.
- If you use the Sum instruction on the only field in a query grid, Access calculates a grand total of the values in that field for the entire table.
- When you pair a Sum instruction with a Group By instruction (as shown in Figure 15-4), your results display a sum for each unique entry in the
Group Byfield. - Pair the Sum instruction with any other Total row option to get more than one summary for each line of your results. Count and Sum naturally go together, as do Sum and Avg (Average), Min (Minimum value), and Max (Maximum value).
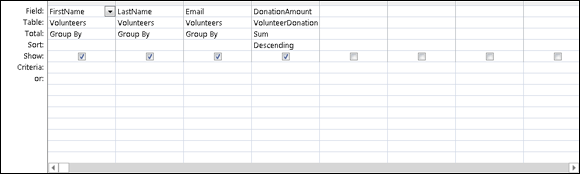
Figure 15-4: Put the Sum instruction in a numeric field so it has something to work with.
To limit the range of the records totaled in Sum, use the Where instruction (described later in this chapter).
Counting, the easy way
Use the Count instruction in the query when you want to know how many entries are in the group, instead of performing mathematical calculations on numeric fields for the group.
Because Count doesn’t attempt any math on a field’s data, it works on a field of any data type in your tables.
When used by itself in a query (as shown in Figure 15-5), Count tallies the number of entries in a particular field across every record in the entire table and then displays the answer. By using Count with one or more Group By instructions in other fields, Access counts the number of items relating to each unique entry in the Group By field.
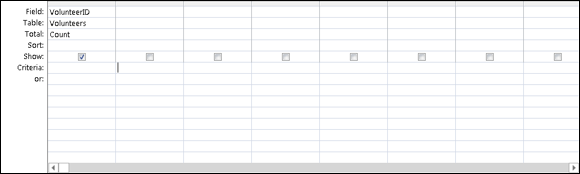
Figure 15-5: Use Count on a single field to easily count the records in a table.
For a quick and accurate count of the number of records in a group, point the Group By and Count instructions at the same field in your query grid, as shown in Figure 15-6. To be part of the group, the records need matching data in a certain field. Because you know that the field for your Group By instruction contains something (namely, the data that defines groups for the query results), that field is a perfect candidate for the Count instruction as well. Add the field to your query grid a second time by choosing the same field name again — in a new column — and then selecting Count in the Total row.

Figure 15-6: This query counts the number of volunteers in each state.
Apply a calculation to a field, and Access tacks on a newfangled word such as SumOf or CountOf or <insert calculation name here>Of to the beginning of the field name in Datasheet view. To insert your own (more meaningful) column heading, type the heading followed by a colon (as in StateCount:) in front of the field name on the query grid (see Figure 15-7).
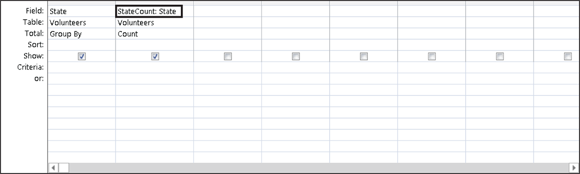
Figure 15-7: The StateCount column heading is added to the count of the State field.
Narrowing the results with Where
The Where instruction works a bit differently from the other options in the Total row. The Where instruction lets you add criteria to the query (such as showing volunteers from certain states, or including orders placed only after a certain date) without including additional fields in your results. In fact, Access won’t allow you to show a field in your query results that contains the Where instruction.
The query in Figure 15-8 uses a Where instruction to limit which records appear in the query results. Normally, that query would count donations by volunteer, using every record in the table. Adding a Where instruction to the City field tells the query that it must test the data before including it in the results. In this case, the Where instruction’s criteria include records for those people living in Lancaster or Marietta.
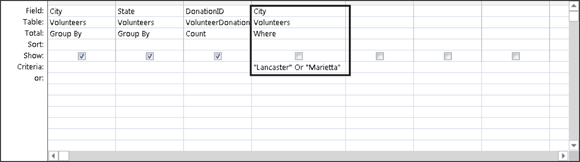
Figure 15-8: The Where instruction limits records in the results to Lancaster or Marietta volunteers.
Creating Your Own Top-Ten List
Here’s a problem that is a snap to solve with Access. Suppose you need a list of your top ten volunteers, ranked by donation amounts. Or a list of the top five best-selling products last year. Or a list of the top whatever. The query property Top Values takes all the dirty work out of this chore. Simply set it and forget it — the dirty work, that is! You can return the top values (for example, the top 5 out of a list of 40) or top percentage of values (say, the top 5 percent, which returns the top 2 out of 40) with the Top Values property.
Follow these instructions to make a top-ten (or whatever number you choose) list:
-
Open the query containing the data for your top-values list in Design view.
The query must contain at least one numerical field so that a set of top values can be selected. Usually, it’s a summary query, such as total donation amount by volunteer. The query must be sorted on the numerical field.
- From the Design tab on the Ribbon, locate the Return button in the Query Setup group of buttons.
-
Click the drop-down list arrow next to the Return button and select a choice from the list or type your own number in the box.
Because 10 isn’t on the list, you’ll have to type 10 in the box to generate a top-ten list. (See Figure 15-9.)
-
Switch to Datasheet view.
The list is limited to the range of top values determined by the number or percentage you entered in the box.
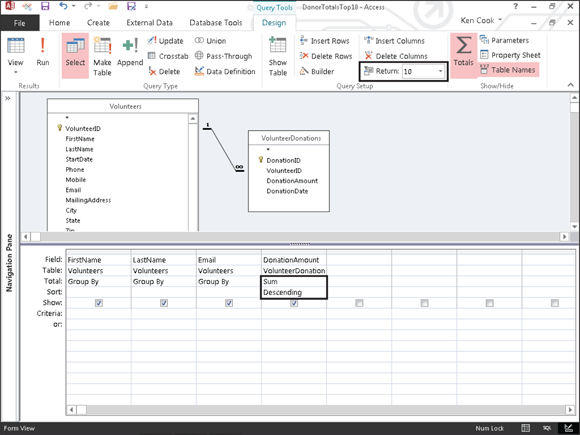
Figure 15-9: Setting the Top Values property to 10.
The Top Values property returns the top values for whatever column is sorted first in the query (Access sorts first by the leftmost field that has Sort row instructions in the QBE grid). If you tell Access to show you the top ten volunteers in donation amount based on a field called DonationAmount, you won’t get them unless you sort on the DonationAmount field. Choose Descending in the Sort row of the DonationAmount field to have Access order them for you from highest to lowest.
Choosing the Right Field for the Summary Instruction
Deciding which field gets a Sum, Count, or other Total row instruction greatly affects your query results. If you choose the wrong field, Access fails to tally things correctly.
Follow these guidelines when choosing fields for your summary queries:
- Don’t apply summary functions that require numbers to calculate (such as Sum and Avg) to a text field. You’ll get the ever-popular
Data type mismatcherror message if you do. - Fields with repetitive information (such as order date in an orders table or volunteer ID in a donations table) make excellent
Group Byfields. For example, if you group by donation date and count theVolunteerIDfield, you get a count of donations per day. - When counting records, choose a field that contains data for each record. If you don’t, Access excludes the blank fields in its count.
To see the kinds of miscues that can happen, check out Figure 15-10. There you’ll see a summary query that has been written to count volunteers and zip codes. The Count instruction has been applied to both the VolunteerID and Zip fields of the Volunteers table. The Zip field returns 17, whereas the VolunteerID field returns 19. Which is right? The latter is correct because each record in the table has a volunteer ID. Not every record has a zip code specified. Therefore, Access counts only the records for which a value appears in the Zip field for a customer. Choose your fields wisely to avoid this problem.
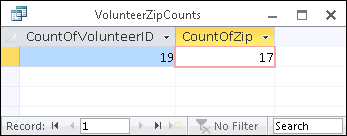
Figure 15-10: The ZipCode and VolunteerID fields counted.
The Total row takes some getting used to. But in no time, you’ll master the power of this tool in your queries. When that day comes, say goodbye to your old friend Mr. Spreadsheet forever!