
Chapter 22
Analyze This!
In This Chapter
![]() Converting a flat file to relational tables with Table Analyzer
Converting a flat file to relational tables with Table Analyzer
![]() Documenting your database
Documenting your database
![]() Fine-tuning your database with Performance Analyzer
Fine-tuning your database with Performance Analyzer
The Access Analyzer tools promise to help you set up, document, and fine-tune the performance of your database. Sound too good to be true? Well, like most software tools that promise the blessings of automation, the Analyzer tools do some things well — and others not so well.
Here is what the Analyze tools promise to do:
- Convert flat files into relational databases automatically.
- Document the database and all its parts (including tables, queries, forms, and reports).
- Analyze the structure of your tables to make sure everything is set up in the best possible way.
So which Analyze tool makes good on its promise? That would have to be the Database Documenter. To do manually what the Database Documenter does would take the average person hours, if not days. If you’re using the Analyze tools for the other two tasks, they don’t quite deliver on their promises — but they do have merit, so I cover them as well.
From Flat File to Relational Tables with Table Analyzer
Doesn’t this sound great? The Table Analyzer promises to take a messy flat-file table (such as an imported spreadsheet) — with all its repetitive data — and convert it to an efficient set of relational tables. But, as the saying goes, promises made are promises broken. Unless your flat file follows some strict rules, the Table Analyzer won’t quite get it right. I would love to tell you what those rules are, but only Microsoft knows the mysterious rules of the Table Analyzer.
 A flat-file database is one in which all the data is in one file. Access is a relational database that allows data to be stored in multiple tables for more efficiency.
Sometimes you get a perfect set of relational tables, and sometimes the Table Analyzer doesn’t suggest a new table when it should or suggests a new table when it shouldn’t. My advice to you is to give it a try and see what happens. Best case, it works right and you’ve just saved yourself a boatload of time. Worst case, it doesn’t work right and you wasted a few minutes of your time. Most of the time, you’ll get something of value that may need tweaking. At least you saved a partial boatload of time!
 The Analyzer works best with a flat-file table that contains plenty of duplicate information. For example, imagine a flat-file table for a bookstore. Each record in the table contains customer and book data. If the same customer buys six books, the table contains six separate records with the customer’s name, address, and other information duplicated in every one. Multiply that by 1,000 customers, and you have precisely the kind of flat-file mess that the Analyzer loves to solve.
With that thought in mind, here’s how to invoke the Table Analyzer Wizard:
- Open your database and select the table you’d like to evaluate from the Navigation pane.
-
Click the Database Tools tab.
The Analyze group of buttons appears on the Ribbon as shown in Figure 22-1.
-
Click the Analyze Table button from the Analyze group.
The Table Analyzer Wizard dialog box appears (see Figure 22-2).
-
Read the first two screens if you want (they’re strictly educational); click Next after each one.
Another Table Analyzer Wizard screen appears, as shown in Figure 22-3.
- The name of the table you selected in the Navigation pane should be selected in the Tables list. If it is not, click the name of the table you’d like to convert.
-
Click Next.
In the dialog box that appears, the wizard asks whether you want to just let the wizard do its thing (the wizard will decide how the flat-file table should be arranged into multiple tables) or if you want to decide which fields go to what tables.
-
Click the Yes option (if it’s not already selected) to give the wizard full power in deciding the fate of your table, and then click Next.
If the wizard recommends that you not split your table, click the Cancel button and pat yourself on the back for a job well done. This message means that the wizard thinks your table is fine just as it is.
If the wizard does split your table, it will analyze your table and show you its findings. The results look like those shown in Figure 22-4.
- Make sure the information from your flat-file table is grouped correctly into new tables:
- If the information is grouped correctly, name the tables by double-clicking each table’s title bar and typing a new name in the resulting dialog box.
- If the information is not grouped correctly, use your mouse to drag and drop fields from table to table — and then double-click each table’s title bar to rename the tables.
- If you want to create a new table, drag a field into any open space between or around the existing tables. The wizard will create a new table window containing the field. Double-click the new table’s title bar to rename the table.
-
When you’re finished arranging and naming your tables, click Next.
The wizard automatically selects a key field for each table that it thinks needs a key field. Should the wizard select a field incorrectly as a key field, you can correct the error.
- If the wizard doesn’t designate a key field properly, you can
- Designate an existing field as a key field by selecting the field and clicking the Set Unique Identifier button (looks like a key).
- Change a key-field designation by selecting the proper key field and then clicking the Set Unique Identifier button (looks like a key).
- Add a key field by clicking the Add Generated Key button (contains a plus sign and key).
-
Click Next for the final step in the process.
The wizard offers to create a query that looks and acts like your original table. If you have reports and forms that work with the flat file, they’ll work with the new query.
At this point in the process, you may not see the last screen of the wizard as described in Step 12; the wizard may tell you that some of your data might be incorrect and that you should correct it. For example, if you have a Country field in your table and there are two entries such as USAandUAS, the wizard will ask you for — or suggest — a correction for the error. You definitely should correct this type of error. Unfortunately, I’ve found that the wizard is often not very good at identifying such errors. (It might suggest that you changeBelgiumtoBrazil, for example.) My advice is to take a quick peek at the data for actual errors and move on — because the suggested “corrections” are often incorrect! -
Choose Yes to have the wizard create the query or No to skip query creation.
Choosing Yes creates a query that runs against the new tables. The query looks and acts like the original table. The original table is renamed with an
_OLDslapped on the end, and any reports and forms use the query (rather than the original table) automatically. Choosing No generates the new tables but leaves the original table with its original name. -
Click Finish to exit the wizard.
The wizard completes the process of splitting the flat-file table into a set of relational tables.

Figure 22-1: The Analyze Group on the Ribbon.
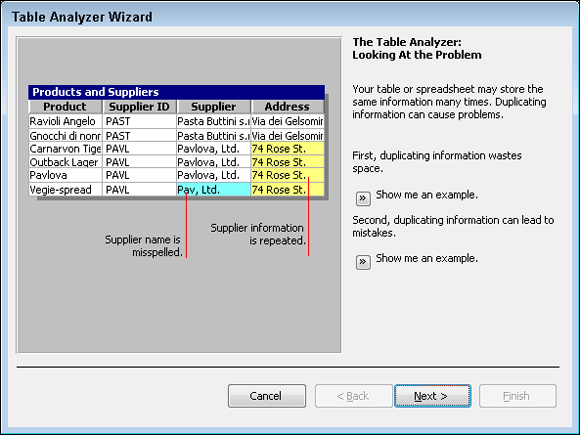
Figure 22-2: Here comes the Table Analyzer.
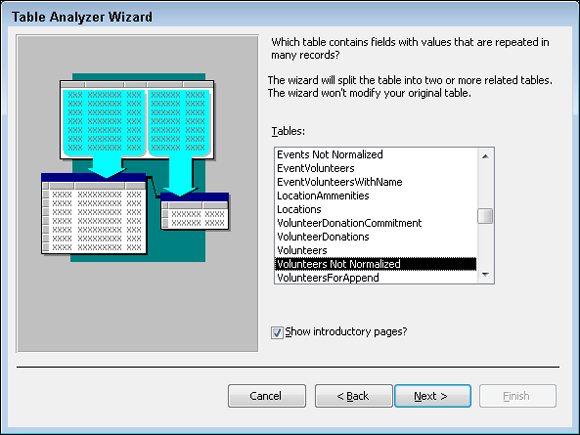
Figure 22-3: Select a table to analyze.

Figure 22-4: The Table Analyzer makes its decision.
 The Table Analyzer is unlikely to split a flat-file database correctly into a properly designed relational database — especially if the flat file is complicated. You’re much better off bringing the database to a qualified human and letting her properly redesign it as a relational database — or figuring out how to do that yourself! For more information on proper table design, see Chapter 4.
Record Database Object Information with the Database Documenter
In the world of database development, the last thing on the to-do list — if it’s done at all — is database documentation. You’re probably asking yourself, “Why do I need to create a mountain of pages to tell me about my database?” Well, if you’re the developer of that database and something were to happen to you — say, you’re promoted or you leave the company — someone else would take over responsibility for the database, and be up a creek without a paddle. A well-documented database is easier to maintain than one that is not documented.
Why is this important step rarely done? Because it takes time and money — both of which are in short supply for most businesses. Enter the Database Documenter. It browses through everything in your database and records the minutest of details about each item, be it a table, field, form, query, or report. The Database Documenter collects information so obscure that the programmers might not know what some of it means.
If you think the Documenter will create a nice user guide for your database end user, unfortunately, you’ve thought wrong! The Documenter records information helpful to the developer should the database need to be re-created. However, you’ll still need to create end-user documentation the old-fashioned way — manually.
The Database Documenter is fast and easy. All you have to do is turn it on, and it does the rest. Before you know it, the timely and costly job is done!
Here’s how to document your database:
-
Open your database and select the Database Tools tab.
The Analyze group appears on the Ribbon.
-
Click the Database Documenter button in the Analyze button group.
The Documenter dialog box appears.
- In the Documenter dialog box, click the All Object Types tab, as shown in Figure 22-5.
-
Click the Select All button to document every object in your database, and then click OK to start the process.
The Documenter begins by examining all the objects in your database, starting with the tables and moving on to the queries, forms, reports, and so on.
The process can take a while, depending on the size and complexity of the database you’re documenting. So you might want to run the Documenter before a coffee or lunch break. There’s nothing more satisfying than “working” on a break. When the Documenter finishes, it creates a lengthy report about your database, as shown in Figure 22-6. -
Click the Print button on the Ribbon to get a paper copy.
Access doesn't care a whit about trees or how much paper costs, so it generates hundreds of documentation pages about your database. For a small to mid-size database, this can be 500 to 1,000 pages of information. If you really want everything documented, and don't want a couple of reams of paper describing your database, consider saving the report and then referring back to it later. To store the report electronically, right-click the report while it is in Print Preview and choose Export ⇒ PDF or XPS. Select the destination folder and type a filename; then click Publish. The resulting exported file can be opened in a PDF viewer such as Adobe Acrobat, when needed.
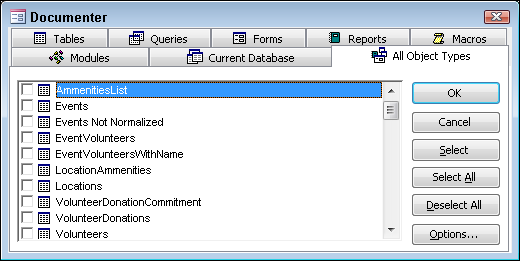
Figure 22-5: Click the All Object Types tab and then click Select All.

Figure 22-6: This page of the report shows some table information.
If you run the Documenter and find that it has generated too much detail, you can control what is documented — thereby reducing the detail (and number of pages) in the resulting report. The following instructions remove specified object properties (such as field properties like the Field Size property) from the Documenter’s report:
-
From the Database Tools tab, click the Database Documenter button in the Analyze button group.
The Documenter window opens.
- Click the All Object Types tab.
-
Click the Select All button.
Steps 2 and 3 tell the Documenter that you want to document all objects in the database.
- Repeat these steps for each object type (tables, queries, forms, reports, macros) in the Documenter window:
- Click the tab for the desired object type (like the Tables tab).
-
Click the Options button in the Documenter window.
The Print Definition dialog box for the object selected will appear. (Figure 22-7 shows the Print Table Definition dialog box.)
-
Uncheck all the check boxes in the Include for <object type> section.
In the Print Table Definition dialog box, for example, this section will be labeled Include for Table.
-
In the remaining Include For sections, select the second radio button — the one below Nothing (as illustrated in Figure 22-7).
In the Print Table Definition dialog box, for example, these sections are labeled Include for Fields and Include for Indexes.
- Click OK to close the Print Definition dialog box.
- Click OK in the Documenter window to start the documentation process.
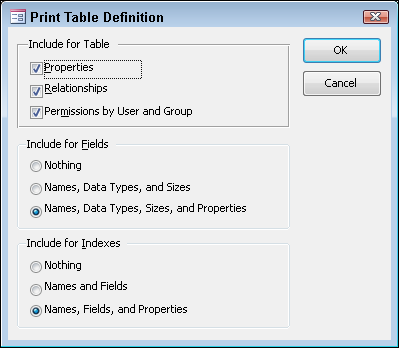
Figure 22-7: The Print Table Definition dialog box within the Documenter.
Improve Database Performance without Steroids
The Performance Analyzer is an Access tool that reviews each database object you designate and makes suggestions on how to improve the object’s performance. It might, for example, tell you to break up a complex form that loads slowly onscreen into several smaller forms that will load faster. Use the Performance Analyzer to (a) locate problem objects that are affecting database performance and (b) improve those objects. This procedure, in turn, improves performance.
Like the Table Analyzer, the Performance Analyzer is far from perfect. When you run it (and you should), be sure to review its recommendations carefully before implementing them.
Here’s how to use the Performance Analyzer:
- Make sure all database objects (such as forms and reports) are closed so the only remaining window is the Navigation pane.
-
Click the Database Tools tab on the Ribbon.
The Analyze button group appears.
-
Click the Analyze Performance button from the Analyze button group.
The Performance Analyzer dialog box appears.
-
Choose the database objects (such as forms and reports) that you want to analyze.
I recommend clicking the All Object Types tab and then clicking the Select All button. The Performance Analyzer dialog box is similar to the Documenter dialog box (refer to Figure 22-5).
-
Click OK to run the Performance Analyzer.
You’ll see a dialog box flash onscreen, listing each database object as it’s analyzed. Eventually, the results of the analysis appear in a dialog box. If the Performance Analyzer has no suggestions, you can skip Steps 6 and 7, congratulate yourself for your superior database design skills, and then move directly to Step 8.
-
Select each result (as shown in Figure 22-8) and review the comments.
If Access can make the changes for you, the Optimize button is enabled. Otherwise, use a pencil and paper and jot down any good thoughts that Access may offer. Sadly, Access does not provide a way to print the Performance Analyzer’s results — hence, the pencil and paper.
-
To implement a task from the results list, select it and click the Optimize button.
 The Optimize button won’t be available for all recommendations — only for those tasks that Access can implement.
After Access performs the task, a blue check mark appears next to the task on the list.
- When you’ve completed your review of the Analyzer’s suggestions, click Close to exit the Performance Analyzer dialog box.
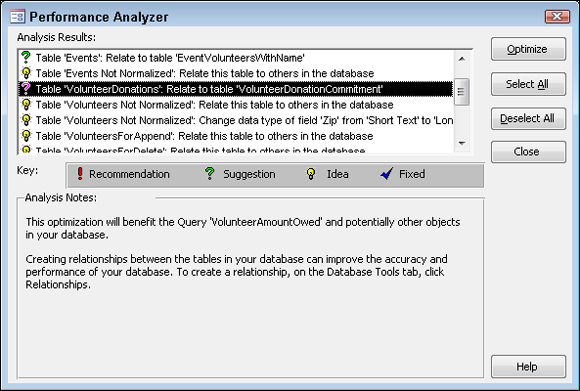
Figure 22-8: Access supplies some tips for improving your work. Implement with caution!
If you’re not sure that a result should be implemented, don’t implement it. Ask your local Access expert for his opinion before implementing such a result.