13
Green Retrofitting and Remediation
Cost of inaction is far higher than the interruption cost by a disaster.
13.1 Principle 10
Wastewater treatment plant (WWTP) is the critical infrastructure in the water–food–energy nexus. Currently more than 15 000 and 5 000 WWTPs were designed and built according to the conventional design principle in the United States and China, respectively. However, 99% of these plants were currently energy negative. In the next decade, retrofitting these WWTPs to energy‐positive water resource recovery facility (WRRF) could be the major task for SEE designers in both the developed world such as the United States and EU and the developing countries such as BRIICS. Due to different designs and combinations of different unit processes, retrofitting strategies will be different. In addition, solar energy could be added to the WRRF to reach the retrofitting targets. For developing countries, remediation of contaminated air, water, and soil is a paralleling challenge. In general, retrofitting and remediation should have the minimal footprints on energy and materials as follows:
13.2 Challenges of WWTP Design
There are more than 60 000 water treatment plants (WTPs) and 15 000 WWTPs in the United States. These plants account for about 3–4% of electricity consumption of the United States. To power these plants, the cost is roughly $10 billion. WWTPs purchase 60–80% of their total energy from electrical companies. The annual electricity bill to power three major WWTPs of 200 MGD for Miami‐Dade County is $24 million. Therefore, conventional WWTPs have lots of disadvantages, and retrofitting them should target to energy‐positive WWTPs should be the major effort for water utilities to become sustainable.
WWTPs use aerobic bacteria with oxygen to degrade organic pollutants in wastewater and produce large amount of sludge. Sludge generated consumes one‐third of the total energy of a typical WWTP. The produced sludge is usually anaerobically digested to produce biogas of 70% methane. The efficiency of the tank process is very low because dead zones can occur throughout the tank, short circled, and energy used in activated sludge (AS) is intensive. Traditional WWTPs occupy unnecessary land. Nutrients such as nitrogen and phosphate are not recovered through this process. Chlorine is toxic and can produce disinfection by‐products (DBP). Conventional WWTPs use tanks to treat wastewater (WW) and have the following disadvantages:
- Large land footprint.
- Large energy footprint.
- Vulnerable to outdoor temperature.
- Design philosophy is to treat WW, not to recover water, energy, nutrients, and materials.
- Volatile organic compounds from aeration tanks of WWTPs cause odor and possibly smog.
- Aerobic stabilization causes a higher financial burden (1/3 of WWTP cost comes from sludge disposal).
One of the urgent challenges faced by SEE designers is to retrofit the conventional WWTPs to energy positive. Sustainable designs should explore either containers or pipe reactors for communities with population equivalent (PE). Pipe reactors are better than tank units and might hold the key for sustainable WRRF. There are many innovative ways of designing WWTPs:
To improve energy efficiency, pipe reactors could be applied to many unit processes: has its advantages:
13.2.1 Energy Efficiency of Water and Wastewater Treatment
13.3 Anaerobic Digestion for Biogas Production
Modern design theories indicate that the best strategy to retrofit the WWTP is to optimize the coupling between carbon and nutrient removal process using anaerobic oxidation of organic matter while using Anammox to degrade ammonium. It skips the aerobic cycle and creates an anaerobic reaction and reduces nitrates to ammonia. As a result, it saves the energy for aeration in AS process. In aerobic process, organic compounds expressed as biological oxygen demand (BOD) are aerobically converted to the secondary waste such as AS that is expensive to be further treated to meet disposal standards. On the other hand, anaerobic digestion (AD) is the degradation of organic material by anaerobic microorganisms to produce biogas. Anaerobic digestion has four major stages:
- Hydrolysis cleaves a chemical compound using water reaction and breaking down insoluble complex molecules to simple sugars, fatty acids, and amino acids.
- Fermentation (acidogenesis) uses the products from hydrolysis and transform them into organic acids and alcohols.
- Acetogenesis converts organic acids and alcohols into hydrogen, carbon dioxide, and acetic acid.
- Methanogenesis makes the acetic acid react through methanogenic bacteria to produce, methane and carbon dioxide (Figure 13.1).
Figure 13.1 Degradation steps of anaerobic digestion process.
AD process produces biogas that is a mixture between methane and carbon dioxide, typically composed of 50–75% methane, 25–50% carbon dioxide, 5–10% hydrogen gas, and 1–2% nitrogen gas. Methane is the major component of natural gas (97% of the volume). It is a colorless, odorless gas and is flammable and has a calorific value of 10 kWh/Nm3 (Nm3 is normal cubic meter at standard temperature and pressure). AD undergoes reduction reactions (assimilation of electrons) and has relatively long sludge cycles (due to low growth rate of methanogens) As a result, long solid retention times are required (Table 13.1).
Table 13.1 Ultimate products of oxidation and reduction of common elements.
| Chemical elements | Oxidation products | Reduction products |
| Carbon (C) | CO2 (carbon dioxide) | CH4 (methane) |
| Nitrogen (N) | NO2 (nitrogen dioxide) | NH3 (ammonia) |
| Phosphate (P) | P2O3 (diphosphorus trioxide) | H4P (phosphonium) |
| Sulfur (S) | SO2 (sulfur dioxide) | H2S (hydrogen sulfide) |
During the reduction processes, the relative size of organic matter is typically as shown in Table 13.2.
Table 13.2 Product size during anaerobic stages.
| Anaerobic digestion stage | Products | Organic matter (in meters) |
| Hydrolysis | Super fatty acids, amino acids | >10−4 |
| Acidogenesis | Organic acids | >10−7 |
| Acetogenesis | Hydrogen gas, carbon dioxide | >10−8 |
| Methanogenesis | Hydrogen gas, carbon dioxide, methane gas | >10−9 |
Anaerobic treatment is a biological process carried out in the absence of O2 for the stabilization of organic materials by conversion to CH4 and inorganic end products such as CO2 and NH3. Anaerobic fermentation breaks down organic matter without the need of an external electron to release energy. Anaerobic respiration requires external electron acceptors to release energy at a higher level than anaerobic fermentation. There are many advantages of anaerobic treatment:
- Less energy requirement (no aeration needed).
- Energy formation in the form of methane gas.
- Less biomass (sludge) formation.
- AD is the key to a low‐carbon economy. It generates energy to heat the sludge, recycles digested sludge for agriculture, and protects environmental and human health.
- It converts organic matter in the sludge as CH4 to reduce energy or heat consumption and reduces greenhouse gas (GHG) emissions and the use of energy and material.
- Hydrolysis at high temperature improves the gas production rate of AD.
- CH4 can be used for power generation and waste heat can be used to dry the sludge or to thermally hydrolyze food wastes for anaerobic digestion.
- It reduces fertilizer application, energy consumption, and the need for land resources.
To reduce sludge production, organic matter should be diverted to anaerobic digester directly. As a result, the organic matter would be anaerobically digested to produce methane instead of fix free water into secondary waste such as sludge. The operation parameters of anaerobic and aerobic processes are compared in Table 13.3 which shows that the aerobic sludge production is from 4 to 10 times higher than that of anaerobic process. Furthermore, the anaerobic digested sludge is much easier to be be dewatered than the aerobic sludge (Tables 13.4 and 13.5).
Table 13.3 Comparison between anaerobic and aerobic processes.
| Anaerobic | Aerobic |
| Organic loading rate | |
| High loading rates: 10–40 kg COD/m3‐day (for high rate reactors, e.g. AF, UASB, E/FBR) | Low loading rates: 0.5–1.5 kg COD/m3‐day (for activated sludge rate process) |
| Biomass yield | |
| Low biomass yield: 0.05–0.15 kg VSS/kg COD (biomass yield is not constant but depends on types of substrates metabolized) | High biomass yield: 0.35–0.45 kg VSS/kg COD (biomass yield is fairly constant irrespective of types of substrates metabolized) |
| Specific substrate utilization rate | |
| High rate: 0.75–1.5 kg COD/kg VSS‐day | Low rate: 0.15–0.75 kg COD/kg VSS‐day |
| Start‐up time | |
| Long start‐up: 1–2 months for mesophilic | Short start‐up: 1–2 weeks |
| : 2–3 months for thermophilic | |
Table 13.4 General conditions for sludge digestion.
| Parameter | Range of values | |
| Temperature | Optimum | 35°C |
| General range of operation | 29°C | |
| pH | Optimum | 7.0–7.1 |
| General limits | 6.7–7.4 | |
| Gas production | Per kg of volatile solids added | 0.5–0.8 m3 |
| Per kg of volatile solids destroyed | 1–1.1 m3 | |
| Gas composition | Methane | 65–69% |
| Carbon dioxide | 31–35% | |
| Hydrogen sulfide | Trace | |
| Volatile acid concentration as acetic acid | Normal operation | 200–800 mg/l |
| Maximum | Approx. 2000 mg/l | |
| Alkalinity concentrations as CaCO3 | Normal operation | 2000–3500 mg/l |
Table 13.5 Loadings and detention times for heated anaerobic digesters.
| Conventional single stage (unmixed) | First‐stage high rate (completely mixed) | |
| Loading (kg/m3/day of VS) | 0.3–0.8 | 1.5–3 |
| Detection time (days) | 30–90 | 10–15 |
| Capacity of digester (m3/population/equivalent) | ||
| Primary only | 0.03–0.06 | 0.011–0.015 |
| Primary and secondary | 0.12–0.18 | 0.02–0.04 |
| Volatile solids reduction (%) | 50–70 | 50 |
13.3.1 Operation Guidelines for Wastewater Treatment Plants
- In monitoring AD, the rule of thumb is that the higher the percentage of methane output, the better the performance of the plant,
- On the other hand, higher the percentage of carbon dioxide, the worse the efficiency of the plant.
Thermophilic (~55°C) or hyperthermophilic (~73°C) could achieve a much higher rate of biogas production. At a given flow rate, the hydraulic retention time (HRT) is designed so that all the organic compounds are removed. Volume is calculated by the product of that flow rate and the HRT. Traditional AD needs up to 20 days of HRT. However, anaerobic membrane biological reactor separates HRT from solid retention time; as a result, AnMBR could produce significantly high amount of biogas than traditional AD.
Conventional WWTPs in the United States are implementing the biological membrane reactors (BMRs) technology to improve the efficiency of biogas production, because BMRs reduce HRT from 2 to 15 days to just 2 h and separate the organic compounds in water through biological membrane (Figure 13.2). Another important technology is the upflow anaerobic sludge blanket (UASB) reactors that use inflow rates in a vertical direction (upflow) with a high sludge concentration maintained in the reactor to result in long solid retention times (Figure 13.3).

Figure 13.2 Anaerobic digestion process schematic.

Figure 13.3 Upflow anaerobic sludge blanket.
To reduce the carbon, water, energy, nutrient, and ecological footprints of the WWTP, different innovative alternatives can be designed to save energy and recover nutrients. For example, to reduce organic load, a rotating cloth sieve can be an effective way to filter solid which is then diverted to AD to produce methane. AD does not require aeration, which significantly reduces electricity consumption. However, the mass transfer efficiency is low. For nonbiodegradable organic solid, the combustion of dry organic compounds can produce heat. Waste organic matter should be viewed as an energetic compound rather than the pollutant as it was viewed in the past. WWTPs can be retrofitted to energy positive if enough financial source were committed to renovate WWTPs. WW contains up to 99.9% water where the 0.01% reflects the biodegradable organics and nutrients. In addition to this, water contains pathogens and other toxic compounds that need to be removed. A typical WWTP uses 1200–2400 MJ per 1000 m3, while a typical WW could contain up to 7000 MJ per 1000 m3. Therefore, if the energy recovery efficiency is as low as 30%, a WWTP could reach energy neutral.
However, traditional activated sludge process employs aerobic bacteria to degrade organic matter in wastewater and produce four times larger amount of sludge than anaerobic digestion as follows
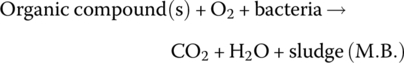
Since sludge handling and disposal is very energy intensive and costly, the best retrofitting strategy is to divert organic matter from primary settler to anaerobic digester directly to produce more methane.
Figures 13.4 and 13.5 show that more than 60% BOD could be diverted directly to the anaerobic digester as the first stage. In the second stage, N is removed through anammox in a 10 MGD WWTP in Strass, Austria.

Figure 13.4 Treatment system (base case).

Figure 13.5 Treatment system (anaerobic stage B).
13.4 Best Practice Benchmark
In retrofitting the existing WWTP, it is very important to establish the unit consumption benchmark for each unit process of WWTP. Tarallo (2015) developed an excellent net zero energy guide for WWTP. The guide analyzed 24 WWTPs in the state of New York and classified different WWTPs as typical versus the best practice according to the plant configuration. For an AS process as secondary treatment, configuration A1 in the guide (Tarallo, 2015) includes primary treatment, cothickening in gravity thickener, AD, and dewatering of sludge. According to each unit process, the typical and best performance in terms of energy efficiency is listed for 24 different treatment WWTPs. Table 13.6 shows a specific configuration referred as configuration A1.
Table 13.6 Energy consumption and production in configuration A1 (data from Tarallo, 2015).
| Energy consumption and production | Units | Typical | Best practice | Percent |
| Major electricity using processes | ||||
| Biological reactor | kWh/MG | 431 | 212 | 51 |
| Odor control | kWh/MG | 300 | 300 | 0 |
| Influent pumping | kWh/MG | 210 | 148 | 30 |
| Anaerobic digestion | kWh/MG | 129 | 11 | 92 |
| Final clarifiers and RAS pumping | kWh/MG | 103 | 75 | 27 |
| Total facility electricity consumption and production | ||||
| Total electricity usage | kWh/MG | 1416 | 937 | 34 |
| Electricity generation | kWh/MG | 0 | 0 | — |
| Production as % of consumption (% neutrality) | % | 0 | 0 | — |
| Natural gas consumption | ||||
| Natural gas usage | MJ/MG | 0 | 0 | — |
Table 13.7 summarizes technical benchmark of 24 WWTPs in New York by statistically analyzing the energy consumption data reported by the Department of Environmental Protection of New York (Tarallo, 2015).
Table 13.7 Summary technical benchmark of WWTP unit processes (data from Tarallo, 2015).
| MJ/MG | Typical | Best | Typical | Best | Typical | Best | Typical | Best | Typical | Best | Typical | best | Typical | Best |
| Activity | 10% | 10% | 25% | 25% | 50% | 50% | 75% | 75% | 90% | 90% | Min | Min | Max | Max |
| Influent pump station | 210 | 148 | 210 | 148 | 257 | 181 | ||||||||
| Screening and grit removal | 188 | 188 | 188 | 188 | ||||||||||
| Screening and grit removal (sidestream pump) | 9 | 4 | 11 | 6 | 14 | 9.5 | 18.5 | 14 | 21 | 17 | 8.32 | 3.8 | 26.45 | 17.25 |
| Primary clarifiers | 84.5 | 95.5 | 85.5 | 96.3 | 88 | 98 | 89.5 | 100.5 | 91.5 | 102.5 | 84.4 | 95.8 | 93.2 | 102.9 |
| Biological reactors and final clarifiers | 46 | 36 | 49 | 39 | 54.5 | 45 | 80.5 | 51 | 125.1 | 106 | 45.9 | 37.8 | 126.9 | 119.9 |
| Disinfection (discharge) | 11.5 | 11.5 | 15.4 | 15 | 16.75 | 16.6 | 24.1 | 24 | 24.5 | 24.5 | 9.8 | 10.4 | 24.7 | 24.7 |
| Gravity thickener | 76 | 92 | 77 | 94 | 82 | 96 | 85.5 | 101 | 123 | 136 | 79.1 | 90.4 | 148.8 | 153.2 |
| Gravity thickener (sidestream pump) | 4 | 4.4 | 4.57 | 5.1 | 5 | 6.2 | 6.1 | 12 | 20.1 | 13.4 | 3.8 | 4.5 | 20.1 | 14.75 |
| Mechanical thickener | 43 | 33 | 46 | 36 | 50 | 47 | 79 | 100 | 108 | 125 | 44 | 37 | 132 | 132 |
| Mechanical thickener (sidestream pump) | 2.1 | 0.6 | 2.6 | 0.8 | 2.8 | 1.25 | 4 | 1.8 | 7 | 3.6 | 1.9 | 0.7 | 7.9 | 3.6 |
| Lime stabilization (cake) | 72 | 72 | 75 | 75 | 80 | 80 | 75 | 105 | 105 | 108 | 70.7 | 71.8 | 101.9 | 107.1 |
| Anaerobic digestion | 67 | 55 | 63 | 68 | 65 | 72 | 70 | 74 | 74 | 77.5 | 49.3 | 36.5 | 76.3 | 79 |
| Anaerobic digestion (dewatering) | 54 | 51 | 58 | 52 | 61 | 56 | 66.5 | 58 | 73 | 64 | 54.9 | 51.3 | 74.4 | 66.4 |
| Flare | 22.5 | 36 | 24 | 38 | 28 | 44 | 38 | 50 | 40 | 51 | 20.8 | 33.6 | 42.6 | 51.3 |
| Boiler | 17.4 | 15.2 | 17.8 | 15.4 | 19.7 | 16 | 24 | 19.5 | 24 | 20 | 17.5 | 14.2 | 25.4 | 20.7 |
| Dewatering (cake) | 49 | 48.5 | 52 | 50.5 | 56 | 54 | 62 | 60.5 | 68 | 65.5 | 49.6 | 49.4 | 69.8 | 69.5 |
| Dewatering (sidestream pump) | 4.53 | 2.1 | 4.3 | 2.2 | 5.1 | 2.4 | 5.8 | 2.7 | 11 | 4 | 17.5 | 2.14 | 11.1 | 5.9 |
| Disinfection (discharge) | 11.5 | 11.5 | 15.4 | 15 | 16.75 | 16.6 | 24.1 | 24 | 24.5 | 24.5 | 9.8 | 10.4 | 24.7 | 24.7 |
| Gravity thickener | 76 | 92 | 77 | 94 | 82 | 96 | 85.5 | 101 | 123 | 136 | 79.1 | 90.4 | 148.8 | 153.2 |
| Gravity thickener (sidestream pump) | 4 | 4.4 | 4.57 | 5.1 | 5 | 6.2 | 6.1 | 12 | 20.1 | 13.4 | 3.8 | 4.5 | 20.1 | 14.75 |
| Mechanical thickener | 43 | 33 | 46 | 36 | 50 | 47 | 79 | 100 | 108 | 125 | 44 | 37 | 132 | 132 |
| Mechanical thickener (sidestream pump) | 2.1 | 0.6 | 2.6 | 0.8 | 2.8 | 1.25 | 4 | 1.8 | 7 | 3.6 | 1.9 | 0.7 | 7.9 | 3.6 |
| Lime stabilization (cake) | 72 | 72 | 75 | 75 | 80 | 80 | 75 | 105 | 105 | 108 | 70.7 | 71.8 | 101.9 | 107.1 |
13.5 Green Retrofitting
13.5.1 Energy Auditing
The first step to improve plant energy efficacy is to conduct an energy auditing. Table 13.8 provides energy benchmark data for selected WW treatment processes. In general, biofilm reactor such as trickling filter consumes much less energy than AS WWTP and produces much less sludge due to higher solid retention time. However, the treatment capacity is limited for small WWTPs with flow rate less than 10 MGD. For AS system, nitrification could increase the energy consumption more than 30%.
Table 13.8 Energy benchmarks for selected treatment processes.
| Secondary treatment | Energy benchmark (kWh/MG) |
| Activated sludge with advanced treatment and nitrification | 1900 |
| Activated sludge with advanced treatment, no nitrification | 1600 |
| Activated sludge with no advanced treatment or nitrification | 1400 |
| No activated sludge, trickling filter | 1000 |
Note: For WTPs the energy benchmark is approximately 1400 kWh/MG.
Figures 13.6 and 13.7 show the percentage of energy consumption in a typical WTP and a WWTP, respectively.

Figure 13.6 Typical energy consumption for a water treatment system.
Figure 13.7 Typical energy consumption for a wastewater treatment plant.
Figures 13.8 presents the energy balance in a typical WWTP.
Figure 13.8 Wastewater treatment energy balance.
Table 13.9 Total charge for the month in Example 13.1.
| Charge | Cost |
| Facility charge | $100 |
| Demand charge ($12/kW × 6200 kW) | $74 400 |
| Electricity consumption charge (1 000 000 kWh×$0.10/kWh) | $100 000 |
| Total | $174 500 |
Table 13.13 can be used to convert different energy content equivalents: It shows that the highest energy recovery by anaerobic system is 7.3 kJ/g COD by anaerobic baffled reactor (ABR) and the lowest is 0.48 kJ/g COD by microbial fuel cell (MFC).
Table 13.13 Standard energy content and conversion factors.
| Component | Conversion factor | Unit |
| CH4 | 803 | kJ/mol CH4 |
| H2 | 286 | kJ/mol H2 |
| COD | 13.9 | kJ/g COD |
| kW/h | 3600 | kJ/kW/h |
Table 13.14 lists the percentages of COD removed by each technology and shows that Anaerobic Membrane Biological Reactor (AnMBR) is a much better process than the traditional AS process due to cost and environmental impacts. AnMBR not only improves discharge quality but also produces CH4‐rich biogas. AnMBR is one of the best alternatives to achieve energy‐positive WWTP design because it integrates an AD with membrane filtration. It decouples solid retention time (SRT) from hydraulic retention time (HRT) that significantly reduces the reactor volume and environmental footprints. Under different temperatures and loading conditions, AnMBR is able to deliver reliable COD removal efficiency from 90 to 99% from WW. In CSTR or AF configurations of AnMBR systems, permeate pumping and membrane fouling control still consume significant energy. In terms of sensitivity, cost is the most sensitive to interest rate, flux, and membrane lifetime with median correlation of −0.50. Flux is the greatest contributor to global warming potential (GWP) due to tank volume and material increases with the flux. If specific gas demand increases, electricity consumption will increase.
Table 13.14 Average percentage of energy recovery or COD removed.
| Average ± standard deviation | Average (min, max) | |
| ABR | 47.5 ± 4.5 | 90.3 (88.7, 92.5) |
| AnMBR | 35.4 ± 26.8 | 86.7 (82, 90) |
| AFB | 33.8 ± 12.9 | 82 (72, 89.7) |
| UASB | 24.0 ± 11.4 | 67.6 (54, 85) |
| ASBR | 17.7 ± 10.1 | 58.1 (33, 91) |
| MEC | 14.3 ± 14.4 | 78 (33.7, 96.7) |
| MFC | 1.6 ± 1.4 | 45.5 (19, 83) |
Note: anaerobic baffled reactor (ABR) anaerobic membrane bioreactor (AnMBR) anaerobic fluidized bed reactor (AFB) upflow anaerobic sludge blanket (UASB) anaerobic sequencing batch reactor (ASBR) microbial electrolysis cell (MEC) microbial fuel cell (MFC)
After 150 combinations of different configurations such as reactor structure, fouling mitigation, membrane type, and methane management for anaerobic systems were proposed, Shoener et al. (2016) quantified the impact of 22 input parameters on the net present value (NPV) and life cycle GWP of the systems. Quantitative sustainable design (QSD), techno‐economic analysis (TEA), and life cycle assessment (LCA) were used with Monte Carlo simulation in their analysis. Membrane types included hollow fiber (HF), flat sheet (FS), and multitube (MT) in submerged or cross‐flow with or without GAC. GAC has the greatest impacts on NPV and GWP. It reduces GWP by 58% on average and reduces cost by 25% when combined with FS modules. Due to the high cost of GAC, the cost may increase by about 40% for FS AnMBR. Degassing membrane may release 30–50% dissolved CH4. In terms of the net energy consumption (NEC) and the NPV, cross‐flow MT membranes, submerged HF with GAC, and submerged FS with GAC all have a neutral NEC of about 0 kWh/m3. The NEC for submerged with gas sparging and cross‐flow FS without GAC is about 0.8 and 1.6 kWh/m3, respectively. Table 13.15 presents the desirable design standards for an energy‐neutral AnMBR system together with the reasons for these standards as explained by Shoener et al. (2016).
Table 13.15 Desirable design standards for energy‐neutral AnMBR.
| AnMBR | Parameters | Standards | Reasons |
| CSTR | Cross‐flow velocity | <0.5 m/s | Balance between fouling and hydrolysis |
| Submerged | Membrane cleaning | <7.5 m/h with HRT <1.6 h | Eliminate gas sparging |
| FS or MT | Membrane geometry | >0.02 m/s for cross‐flow (m3/h) and > 2000 m2/m3 material | Membrane material efficiency |
| Materials | Membrane lifetime | >10 years | Avoid fluorinated materials |
Shoener et al. (2014) presented a simple conversion of aerobic biological nutrient removal (BNR) into ABR followed by High Rate Algal Pond (HRAP). The simulated energy consumption, recovery, and production are significantly changed. Future AnMBR will be able to handle increased flux and decreased HRT. To retrofit current WWTPs to achieve energy‐neutral operation, ARAS with AnMBR or AB with AnMBR should be designed using two configurations, cross‐flow with MT or submerged HF with GAC. Table 13.16 clearly shows the traditional AS waste energy of 140 kJ/capita in removing COD and NH3–N. When an ABR is used to convert COD to CH4 and HRAP is designed to produce biomass for fuel production, the total kJ/capita increased from barely 600 to 8900 kJ/capita.
Table 13.16 Desirable design standards for energy‐neutral AnMBR.
| Condition | Stage B energy (kJ/capita) | Digester biogas (kJ/capita) | Total (kJ/capita) | |
| COD | NH3–N | |||
| BNR | −140 | 740 | 600 | |
| ABR + HRAP | 420 | 2200 | 600 | 3200 |
| ABR + PBR | 420 | 7900 | 600 | 8900 |
13.5.1.1 Phototrophic System
The carbon limit appears to be important in an N‐rich phototrophic system because cells require a C : N ratio of 6 : 1, while there is only 3 : 1 of C : N in WW.
There are four ways to achieve energy‐neutral WWTP design:
- Decrease the energy required for C, N, and P removal.
- Increase biomass yield.
- Reduce energy consumption during phototrophic process.
- Increase fuel recovery efficacy.
Comparing a phototrophic system with an anaerobic process based on maximum energy content of 13.9 kJ/g COD in WW, the potential to produce energy through a phototrophic system varies from 280 to 400% on the basis of cubic meters of WW treated. Indeed, energy recovery efficacy by an anaerobic process varies from 2 to 47% and 130 to 510% of energy production due to the use of nutrients for phototrophic cultivation. How biomass is converted to energy significantly affects energy yield as listed in Table 13.17 by Shoener et al. (2014). Therefore, following advanced technologies should be developed to promote synergy between effluent quality and energy production.
Table 13.17 Biomass energy yield (kJ/g nutrient removed) by different energy conversion technologies.
| Technology | Nutrient | HTL | Anaerobic digestion | Transesterification | Combustion |
| HRAP | N | 75–160 | 32–160 | 34–100 | 90–130 |
| P | 730–1600 | 32–1500 | 330–980 | 880–1300 | |
| PBR | N | 270–590 | 120–580 | 120–370 | 330–500 |
| P | 230–500 | 100–490 | 100–310 | 280–420 | |
| Stirred tank | P | 900–1900 | 400–1900 | 400–1200 | 1100–1600 |
| ATS | N | 100–240 | 47–230 | 49–150 | 130–200 |
| P | 580–1300 | 250–1200 | 260–790 | 700–1100 |
Enhanced primary sedimentation: To reduce the volume of AS, particulate organic compounds could be settled through enhanced coagulation. The settled sludge goes directly to the anaerobic sludge digester. As a result, maximum methane could be generated for energy recovery while significantly reducing sludge volume.
Codigestion with manure and biofuel: For anaerobic digestion, higher‐influence COD leads to higher energy production and less energy consumption in terms of cubic meters of WW treated. For this reason, codigestion with manure and biofuel WW is the key to achieving energy positive. If AnMBR can add animal manure, CH4 production can be tripled. When biodiesel is produced, the WW contains high energy waste known as glycerol after esterification. Glycerin can significantly increase CH4 yield of anaerobic digestion by 300%.
Emerging technologies should be cost effective, predictable, controllable, and capable of achieving compliance with regulatory requirements. They could further contribute to energy‐positive WWTP retrofitting.
Pyrolysis: Pyrolysis is a thermal process that uses high temperature and pressure in the absence of air to decompose organic material in the biosolids into gas, liquid, and solid (or char). Char is a carbon‐based material formed by incomplete combustion of the organic material. The process yields a product that can be pelletized into solid fuel, which can be used with coal in power plants.
Gasification: Gasification is used to convert biosolids to either heat or electricity. It partially oxidizes organics (biomass) to carbon monoxide, hydrogen, and methane (syngas). New gasification technologies are emerging to use biosolids to generate electricity or hydrogen fuel.
Algae culture: Algae can recover nutrients from WW and use the biogenic carbon to generate biomass with high energy content. Algae‐based WW solutions have the potential to manage carbon, phosphorus, and nitrogen life cycle issues and make significant net energy gains. Algal biofuels from WW could offset coal and imported oil, while nutrient recovery could reduce the use of fossil fuel in fertilizer manufacturing and improve environmental quality.
Microbial fuel cells and other microbial conversions: Anaerobic systems can be engineered to produce electrical energy by using microbial fuel cell technology to take advantage of the electrical potential in WW. Other microbial conversions of WW constituents to biofuel are possible, including butanol and methanol.
13.5.1.2 Renewable Energy for WWTPs
Renewable energy (RE) sources such as wind, solar, and hydropower for meeting the energy demands at WRRF can reduce facility requirements for external sources of energy. Large multi‐megawatt wind turbines can be installed for utility‐scale applications in the range of 100 kW to 1 MW. Photovoltaic systems are becoming more cost competitive with modular solar technologies. They can be used to power buildings as freestanding arrays of photovoltaic modules. Microhydropower technologies may also be installed at some WWTPs.
13.6 Sludge Processing and Disposal
The major by‐product of all the biological process is the sludge produced. Due to no‐regulations on sludge disposal legally, only 7% of sludge have been properly treated and disposed in China. In addition, to retrofit WWTPs, one of the key processes is anaerobic digestion of sludge to produce methane for heat and electricity. Waste sludge is classified based on the process from which it is produced. Raw or primary sludge is drawn from the primary sedimentation tanks and contains all the readily settleable matter from the WW plus 1% scum. It has high organic content, mainly fecal matter and food scraps, and is thus highly putrescible. Primary sludge accounts for 50–60% of the SS applied. Typical solid concentrations in raw primary sludge from settling municipal WW are 6–8%. The portion of volatile solids (VS) varies from 60 to 80% and therefore should be directly sent to anaerobic digester to generate methane. Waste‐activated sludge is a mixed liquor solids that settle slowly, forming a rather bulky sludge of high water content. Therefore, AS contains only 0.4–1.5% SS with a volatile fraction of 0.7–0.8. Aerobically digested sludge contains 1.0–2.0% SS, and about 50% of the VS could be converted to gaseous end products. Trickling filter humus from secondary clarification from the biological filter media has a solids content of 46%. The solids content of anaerobically digested sludge ranges from 6 to 12%. The dry residue is 30–60% volatile depending on the mode of digester operation. Nonfilterable residue, expressed in milligrams per liter, is the solids content in sludge determined by filtration of the sample through a glass fiber filter. Since the filterable portion of sludge is very small, sludge solids are often determined by total residue on evaporation through drying in an oven at 103°C. Total solids (TS) is determined by evaporating to constant mass a measured amount of sludge, weighing the residue, and expressing this as a percentage of the original wet sludge mass. Sludge moisture content (PM) is 100% minus percent of TS. VS content measured as the mass loss after incineration of the dried sludge solids from the TS test at 550°C reflects the organic content of the sludge. The fixed solid (FS) defines the mass of inorganic matter in the sludge that would require ultimate disposal after incineration. Since sludge commonly contains only between 1 and 10% solids by mass, its major component is water.
Sludge moisture–mass–volume relationships are very important calculation in sludge handling. For sludge containing 1% dry solids (moisture content, PM = 99%), 10 kg of dry solids is associated with 990 kg of water. The average density of water sludge solids is 1400 kg/m3, and the density of water is 1000 kg/m3. For 2% solids, the volume occupied with 20 kg of dry solids is 994 l. For any sludge, the volume, ![]() , is given by
, is given by
If the sludge has a dry solids content less than 20% (that is, ![]() ), then
), then
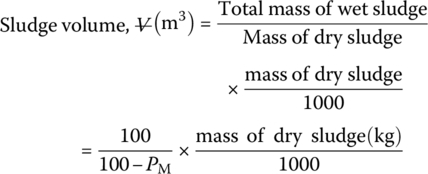
For sludge of 2% solids content, 10 kg of dry solids would be contained in wet sludge with a volume given by
If sludge is concentrated so that the mass of dry solids, SS, remains constant, but the moisture content is decreased from PM1 to PM2, the ratio between the initial volume, ![]() , and the final volume,
, and the final volume, ![]() , is given by
, is given by
Thus, removing water from sludge of low solids content affords a dramatic reduction in volume. Doubling the solids content from 1 to 2% halves the volume of wet sludge, if the density of dry solids was assumed to be 1400 kg/m3 for sludge of greater than 10% solids content and the liquid is assumed to be water (density 1000 kg/m3) (Table 13.18).
Table 13.18 Density and volume of sludge.
| Sludge solids content (%) | kg sludge/kg dry solids | m3 sludge/ton dry solids |
| 1 | 100 | 100 |
| 2 | 50 | 50 |
| 5 | 20 | 20 |
| 10 | 10 | 9.7 |
| 15 | 6.7 | 6.4 |
| 20 | 5.0 | 4.7 |
| 30 | 3.3 | 3.0 |
| 40 | 2.5 | 2.2 |
Mechanically dewatered sludge varies in characteristics based on the type of sludge, chemical conditioning, and unit process employed. The density of dewatered cakes ranges from 15 to 40%. Waste solids production in primary and secondary processing can be estimated using the following calculation:
where
- Wts = total dry solids (kg/day)
- Wps = raw primary solids, kg/day = f × SS × Q
- Wss = secondary biological solids, kg/day = (k × BOD + 0.27SS)Q
- f = fraction of SS removed in primary settling
- SS = suspended solids in unsettled WW (mg/l)
- Q = daily WW flow (Ml/day)
- k = fraction of applied BOD that appears as excess biological growth in waste‐activated sludge or filter humus, assuming about 30 mg/l of BOD and SS remaining in the secondary effluent
- BOD = concentration in applied WW (mg/l)
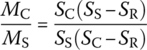
A relatively easy method of estimating solids capture by sludge thickening or dewatering unit is to measure solids concentrations in the process flows. The solids mass balance is given in Equations (13.4) and (13.5): where
The specific gravity of all flows can be assumed to be 1.0. Therefore, the mass of solids M in a process flow stream is the rate of flow Q times the solids concentration S:
Combining these equations results in the following relationships: where where
A maximum of 0.6 kg/m3/day (1.3 kg/m3/day) VS could be loaded for single‐stage operation of AD. These loadings assume that the raw sludge is derived from domestic WW, the digestion temperature is in the range of 29–30°C, the VS reduction is 40–50%, and the digested sludge is removed frequently from the digester. The operation of a digester can be monitored by plotting the daily gas production per unit of raw sludge fed, the percentage of carbon dioxide in the digestion gases, or the concentration of volatile acids in the digesting sludge. A reduction in gas production, an increase in carbon dioxide percentage, and a rise in volatile acids concentration all indicate reduced activity of the acid‐splitting methane‐forming bacteria. Aerobic sludge digestion (ASD) is to stabilize waste sludge solids by long‐term aeration, thereby reducing the BOD and destroying VS. The most common application of ASD is in handling waste‐activated sludge. Since dilute solids suspensions have a low rate of oxygen demand, the need for effective mixing rather than microbial metabolism usually governs the air supply required. The volume of air supplied for ASD is normally in the range of 0.9–1.8 m3/m3 of digester. Design criteria vary with the type of AS system, BOD loading, and the means provided for ultimate disposal of the digested sludge. Small AS plants without primary sedimentation are generally provided with 57–85 l of aerobic digester volume per design PE of the plant. For stabilizing waste‐activated sludge with an SS concentration of 1.0% or less, the VS loading should be limited to 0.64 kg/m3/day, and the aeration period 200–300 degree days computed by multiplying the digesting temperature in degrees Celsius by the sludge age. This equates to a minimum aeration period of 10 days at 20°C or 20 days at 10°C. VS and BOD reductions at these loadings are in the range of 30–50%, and the digested sludge can be disposed of without causing odors or other nuisance conditions.
It took more than ten years to retrofit the Strass WWTP in Austria from energy negative to energy positive in 2005. The major strategies were the planned retrofitting projects to reduce its energy footprint to 0.35 kWh/m3 while innovative technologies are added. For Miami-Dade WASD to retrofit their three WWTPs to energy positive, Table 13.21 lists important technologies as well as the target time periods. Table 13.21 Retrofitting projects for three WWTPs of Miami-Dade Water and Sewer Department13.6.1 Design of Wastewater Sludge Thickeners
13.6.2 Suspended Solids Removal Efficiency
![]()
![]()
13.6.3 Anaerobic Digester Capacity
13.6.4 Aerobic Sludge Digestion
13.6.5 Retrofitting Strategies of WWTPs
Projects
Benefits
Targets
Diverted COD from primary settler to anaerobic digester
Decrease sludge production by 20% Increase biogas production by 10%
5 years
Anaerobic oxidation of ammonium (anammox)
Reduce sludge production by half Reduce aeration electricity by half
10 years
Fat–oil–grease and food wastes to increase biogas production (currently, food wastes are not diverted)
Increase biogas production 20–50% Decrease BOD to WWTPs
3 years
Membrane bioreactor to increase WWTP capacity
Increase WWTP capacity Increase solid retention time
5 years
Decentralized WWTPs
Increase irrigation rate
10 years
UV disinfection
Increase compliance of disinfection by‐product rules Reduce operation costs
10 years
Leachate separated treated
Reduction of BOD and COD to WWTP Reduce toxicity of leachate Decrease
10 years
13.7 Green Remediation
To enhance the environmental, societal, and economic benefits of federal remediation programs, the US EPA provides sustainable strategies, approaches, and applications in two aspects:
- Maximize sustainability, reduce energy and water use as well as toxic air emissions, promote carbon neutrality and industrial material reuse and recycling, and protect and preserve the land.
- Efficient use of energy and water, use of EPA‐designated recovered materials and bio‐based materials, solid waste prevention, energy and water conservation, and use of alternative fuels.
Green remediation considers all environmental effects of remedy implementation and incorporates alternatives to minimize the environmental footprint of cleanup actions. The environmental footprints of a cleanup project are to establish the parameters (metrics) to be quantified and to establish a straightforward process (methodology) for quantifying those metrics. Metric refers to a project parameter for which a quantitative value might be derived mathematically. EPA’s five core elements of green remediation are energy, air and atmosphere, water, land and ecosystem, and materials and waste. Quantitative information on footprint reductions can be achieved by applying EPA’s green remediation best management practices (BMPs). These BMPs should provide excellent technical reference data for China's huge markets of 500 billion USD in water and soil remediation in next decade. To ensure minimal footprints, green remediation metrics, quantification methods of these metrics, and the interpretation of the results are presented in the following sections.
13.7.1 Green Remediation Metrics and Methodology
EPA’s green remediation metrics encourage environmentally friendly engineering design that applies to each of the core elements of greener cleanups and emphasizes parameters that a remedy project team likely has the ability to change. Materials and waste metrics include the following items:
- Refined materials used on‐site.
- Percentage of refined materials from recycled or waste material.
- Unrefined materials used on‐site.
- Percentage of unrefined materials from recycled or waste material.
- On‐site hazardous waste generated.
- On‐site nonhazardous waste generated.
- Percentage of total potential on‐site waste that is recycled or reused (Table 13.22).
The methodology consists of seven steps to quantify the metrics:
- Set goals and scope of analysis.
- Gather remedy information.
- Quantify on‐site materials and waste metrics.
- Quantify on‐site water metrics.
- Quantify energy and air metrics.
- Qualitatively describe affected ecosystem services.
- Present results.
Table 13.22 Green remediation metrics and their components.
| Media of metrics | Category | Metrics |
| Water | Source |
|
| Use |
|
|
| Fate |
|
|
| Energy |
Voluntary purchase of RECs |
|
| Air |
|
The results can be analyzed to identify large contributors to the metrics and evaluate opportunities for footprint reduction. In general, the methodology utilizes publicly available information and can be implemented using standard spreadsheet software developed by the US EPA (2012).
Step 1: Set Goals and Scope of Analysis
The goal of the analysis typically varies with the remedial stage and with other site‐specific factors. The typical goals of footprint quantification, based on remedy stage, are:
- Development of remedy alternatives is to identify components of various remedy alternatives that are large contributors to footprints.
- Remedial design and remedy optimization is to:
- Identify remedy components that are large contributors to the remedy footprint.
- View remedy from different perspective to identify opportunities for improvement.
- Identify design components that are large contributors to footprints during construction or during remedy operation.
- Refine the conceptual site model that, if addressed, might help reduce footprints (e.g. improved characterization that refines the known contamination source area).
- Identify potential opportunities for footprint reductions.
- Quantify and document emissions.
The scope of the analysis significantly influences the data to be gathered in step 2 of the methodology. The boundary of study is also established at the outset of a footprint analysis. The study boundary is the conceptual boundary around a system or project that determines the processes that are included and the processes that are excluded.
Step 2: Gather Remedy Information
This step of the footprint methodology involves collecting information about remedy design, construction, and operation. The information includes design parameters, activities conducted, and types of materials used. The information will likely be relatively uncertain during the early design stage but will increase in certainty as the design stage proceeds and as the remedy is implemented. Information are similar to the design documents, remedial action progress reports, or conducting remedy optimization evaluations. Two types of screening limits of materials should be set and documented based on a specified percentage of the maximum contributor to a particular metric or based on a specified magnitude for a particular metric. Both types of limits should be applied to each of the green remediation metrics or grouping of metrics because an item that is a negligible contributor for one metric may be a significant contributor for another metric.
Step 3: Quantify On‐site Materials and Waste Metrics
Quantification of materials on‐ or off‐sites is an accounting of the significant materials used, the recycled content of those materials, various waste generated, and the portion of that waste that is recycled or reused. The primary challenges associated with this step include (i) converting the various quantities of materials and wastes into common units for each of the metrics, (ii) recognizing recycling and reuse when it occurs, and (iii) presenting information in a clear and concise manner. Table 13.23 provides materials typically involved in various remedy activities.
Table 13.23 Materials used in remediation projects.
| Category | Materials | Examples |
| Wells | Grout | |
| Well casing | PVC Steel | |
| Sand/gravel/bentonite | ||
| Piping | Steel | |
| Plastic | PVC HPDE Other | |
| Building and foundations | Concrete | |
| Steel | ||
| Cutoff walls | Sheet pile | PVC Steel |
| Slurry | Bentonite Grout Fill | |
| Geomembranes/liners/caps | PVC, HDPE | |
| Clay | ||
| Asphalt | ||
| Treatment chemicals/materials | GAC | |
| Oxidants | Hydrogen peroxide | |
| Acids | Sulfuric acid | |
| Bases | Sodium hydroxide | |
| Flocculants | Ferric chloride | |
| Polymer | ||
| Well rehabilitation chemicals | ||
| Injection reagents | Oxidants | Permanganate |
| Acids | Sulfuric acids | |
| Catalysts | Ferrous sulfate | |
| Zerovalent iron | ||
| Nutrients, electron donors | Vegetable oil | |
| Other | Fertilizers | |
| Mulch/compost | ||
| Process equipment | PVC HDPE Steel |
Rules of Thumb and General Assistance for Quantifying Materials Use
Quantifying materials use in tons can be challenging during any phase of a remedy because many materials are ordered or described in different units, such as feet of pipe, square feet of plastic membrane, or gallons of chemical reagents. Some materials use can also be difficult to quantify if many small components are used. In addition, some commonly used construction materials include the actual recycled content, but the recycled content is not necessarily communicated to the purchaser. EPA (2012) documents provide (i) densities of common materials, (ii) approximate material content of commonly used aqueous chemical solutions, (iii) estimated materials use for piping and wiring runs, (iv) estimated materials use for well installation, (v) estimated materials use for process equipment and building construction, and (vi) reasonable assumptions for recycled content of steel, concrete, and asphalt, which are construction materials with a significant percentage of recycled content.
The following waste streams are commonly associated with remediation and may significantly contribute to on‐site waste generation:
- Drill cuttings and used drilling mud.
- Excavated soil for off‐site disposal.
- Construction debris.
- Treatment plant residue.
- Spent GAC.
The following waste streams are also commonly associated with remediation but may be too small to merit inclusion in the waste footprint. These two items include package and disposal personal protection equipment.
Waste streams that exceed the screening limits would be included in the calculation of the footprint. Waste streams that fall below these limits would be excluded from the calculation of the footprint and should be described with an appropriate level of documentation and can be addressed through qualitative BMPs for green remediation.
Step 4: Quantify On‐site Water Metrics
The methodology involves quantifying on‐site water use with an emphasis on reducing on‐site water use and returning water of high quality for reuse. Activities in this step include:
- Distinguishing between various local and on‐site water sources.
- Identifying the quality of the water used from each source.
- Quantifying the amount of water used from each source.
- Identifying the use of the water from each source.
- Distinguishing between various fates of the water from each source after use.
These items can be explained in more detail as follows:
- Water resources – Common sources of water that may be used on‐site in association with a remedy include potable water from a public water supply system, multiple groundwater resources, multiple surface water resources, captured stormwater, and reclaimed water.
- Water quality – The quality of the water used is an important aspect of the water footprint because the potential beneficial uses of the water by the local community, economy, and environment are directly related to the water quality.
- Volume used – The amount of water used from the indicated water resource refers to the volume that is used or diverted from that resource over the life cycle of a remedy.
- Potential water uses – The uses of the water vary from remedy to remedy. Common uses of water resources associated with remediation include the following:
- Extraction for treatment (e.g. in a groundwater P&T system).
- Extraction for testing (e.g. for long‐term pumping tests).
- Injection for plume migration control.
- Blending and injecting reagents for in situ bioremediation.
- Blending and injecting reagents for in situ chemical oxidation (ISCO).
- Blending of chemicals for treatment plant operation.
- Makeup or backwash water from treatment plant operation.
- Mixing grout or slurry.
- Evapotranspiration from phytoremediation.
- Purge water from sampling.
- Equipment decontamination.
- Dust control and general construction.
- Potential fates of used water – Common fates of water after water use during remediation include the following:
- Discharge to public water supply.
- Discharge for use as industrial process water.
- Discharge to groundwater.
- Discharge to surface water.
- Discharge for use as irrigation.
- Discharge to a brackish or saline water body.
- Discharge to the atmosphere through evapotranspiration or vaporization.
- Chemical solutions – Chemical solutions brought to the site from a chemical vendor can contain a significant amount of water. In the absence of other information, it is appropriate to consider the water content of the solution to be public water that is used on‐site at the cleanup project.
Step 5: Quantify Energy and Air Metrics
The energy and air metrics as calculated by the methodology attempt to account for as much of the life cycle of the material or activity as is practicable. The methodology purposefully does not include energy use and air emissions resulting from the following aspects of the remedy:
- The manufacturing of rental or temporary equipment for the site.
- Office‐related work and other off‐site personnel activities (other than routine transportation between the site and the office).
- Items or activities that are nonadditional.
- Items or activities external to the remediation process associated with redeveloping a property.
Step 5 is divided into three parts to facilitate organizing, presenting, and calculating the energy and emission footprints.
Part 1: Inventory Remedy Transportation, Equipment Use, Materials and Waste, Public Water Use, and Off‐site Services
Much of the information required for this inventory is based on the information previously gathered for the materials, waste, and water footprints. Additional information is gathered on transportation, equipment use, and off‐site services required for the remedy.
In an effort to streamline the footprint analysis process, it is appropriate to screen the information to be included in the analysis. The material use, waste disposal, and public water use described in steps 2 and 3 can be included directly. The transportation, equipment use, and other off‐site services are screened against the limits discussed. Items and activities that exceed the limits would be included, and items and activities that fall below the limits would be excluded. Items and activities that are excluded should be described with an appropriate level of documentation; these aspects can be addressed through qualitative BMPs for green remediation.
Part 2: Determine Remedy Energy Use
The second part of step 5 is to organize and refine the inventory information that was developed in step 2 and to use that information to determine the amount of energy involved. This part is divided into the following processes:
- Determining fuel use:
- Converting personnel transportation into fuel use.
- Converting on‐site equipment use into fuel use.
- Converting transportation of equipment, materials, and waste into fuel use.
- Gathering information about actual fuel use (when such information is available).
- Determining electricity use:
- Converting electrical equipment and power requirements into electricity use.
- Gathering information about actual electricity use (when such information is available).
Part 3: Convert the Remedy Inventory into Energy and Air Metrics
The third part of step 5 is to convert the fuel, electricity, materials, and off‐site services involved in the remedy into energy and air metrics. Footprint conversion factors are used for this purpose. One of the challenges of conducting a footprint analysis is establishing accurate conversion factors for the fuels, electricity, materials, and services used in a remedy.
Conversion factors for energy and air emissions from off‐site electricity generation are dependent on the specific grid mix supplied to the site and are determined on a site‐by‐site basis. The type of information used to determine the conversion factors is generally available from the individual electricity service providers. Otherwise, related information at US state level is available online from the US Energy Information Administration (http://www.eia.gov/state) or can be accessed for US regions defined in the federally sponsored Emissions and Generation Resource Integrated Database (eGRID) (http://www.epa.gov/egrid).
Step 6: Qualitatively Describe Affected Ecosystem Services
The methodology suggests the use of qualitative descriptions of the effects of a remedy on land and ecosystem services such as nutrient uptake and erosion control. Concepts related to ecosystem services are available online from EPA’s Ecosystem Services Research Program at https://www.epa.gov/eco‐research/ecosystem‐services.
Step 7: Present Results
In addition to the information gained through each step, documentation of a footprint analysis should be provided for the screening process, analytical assumptions, possible areas of uncertainty, and specific ideas of how to reduce the footprint.
Interpreting Footprint Results
Interpreting the results of a footprint analysis is influenced by a number of considerations, including the quality of the data used in the analysis, the trade‐offs among footprint metrics, and the magnitude of the footprint. There are three main factors that influence data quality:
- The quality of the remedy information input into the footprint analysis.
- The accuracy or appropriateness of the formulas for quantifying the use of electricity, fuel, water, materials, and off‐site services involved in a specific remedy.
- The accuracy of the conversion factors used to convert the remedy inventory into green remediation parameters.
The methodology helps quantify metrics for more than 15 different parameters in 4 different green remediation core elements. Some of the parameters are local in nature (e.g. on‐site HAP emissions or local water use), and others are more regional (e.g. NOx/SOx/PM10 emissions) or global in nature (e.g. total GHG emissions). A potential modification to an existing remedy may increase the values for some metrics and decrease the values for others.
Two main questions regarding the magnitude of a footprint that may arise when interpreting the results of a footprint analysis are (i) what is considered a large footprint or footprint reduction, and (ii) what is considered a significant difference between footprints of two or more potential modifications under consideration?
Data Quality: Transportation
Data quality of transportation and electricity generation are illustrated through example 13.9 and 13.10, respectively.
Data Quality: Electricity Generation
13.7.2 Approaches to Reducing Footprints
Each approach should be tailored to a site’s unique conditions and the expected operating parameters of a particular cleanup remedy. Some contributions to a metric may appear to be small relative to other contributions from the same project but are large when compared with comparable remedies implemented at other sites.
Experience and documentation gained through EPA’s green remediation initiative, including illustrative profiles of green remediation strategies, are available online at
The website suggests that the greatest opportunities for footprint reduction often relate to remedy optimization. Footprint reduction approaches can be linked to specific or general categories of EPA’s green remediation BMPs. The agency compiled a series of quick‐reference fact sheets describing BMPs forspecific remedial technologies, project phases, and issues common to many sites. Some of the BMPs described in these fact sheets include the following (Table 13.27).
Table 13.27 EPA’s green remediation best management practices (BMPs).
| Category | BMPs |
| Excavation and surface restoration |
|
| Site investigation |
|
| Pump and treat technologies |
|
| Bioremediation |
|
| Soil vapor extraction and air sparging |
|
| Clean fuel and emission technologies for site cleanup |
|
| Integrating renewable energy into site cleanup |
|
| Sites with leaking underground storage tank systems |
|
| Landfill cover systems and energy production |
|
13.7.2.1 Approaches to Reducing Materials and Waste Footprints
- Pump and treat (P&T) remedies: The largest contributors to the materials and waste footprints for a P&T remedy are typically system construction, chemical use, and waste disposal. All these items are directly tied to the extraction rate and water quality, so the optimal extraction program would be a key focus for the footprint reduction of P&T systems.
- In-situ Chemical Oxidation (ISCO) and in situ bioremediation: The largest contributors to the material footprint associated with these in situ remedies are the amount of reagents used/injected and the construction of permanent injection locations. Optimizing the number of injection locations and the reagent demand could lead to significant footprint reductions.
- Excavation remedies: The largest contributions to material use and waste generation for excavation remedies are the disposal of excavated material in landfill and the use of clean fill for backfill. Consideration should be given to conducting the on‐site treatment of impacted soils followed by the reuse of the treated soil on‐site, using clean soil from the excavation to partially backfill the excavation, and locating crushed concrete or other reusable materials for fill.
13.7.2.2 Approaches to Reducing Water Footprints
- Pumping and Treatment remedies: The most important factor in quantifying the water footprints for many P&T remedies is the change in water quality through the extraction, treatment, and discharge process.
- In‐situ Chemical Oxidation (ISCO) and in situ bioremediation: The largest contributors to the water footprint associated with these in situ remedies are reagent dilution, injection, and dispersal. Optimizing the number of injection locations, reagent demand, and delivery concentration could help reduce overall water use.
- Excavation remedies: Large contributions to the water footprint for excavation and other earth‐moving remedies could include water used for dust control or water from dewatering. Water used for dust control could be reduced by planning work for the appropriate season or weather condition.
13.7.2.3 Approaches to Reducing Energy and Air Footprints
- Pumping and Treatment remedies: The largest contributors to the energy and air footprints are typically electricity, chemical use, process sampling, and waste disposal. Electricity, chemical use, and waste disposal are directly tied to the extraction rate, so establishing the optimal extraction rate would be a key focus for footprint reduction of P&T systems.
- ISCO and in situ bioremediation: The largest contributors to energy and air footprints are typically the production and transport of the reagents to be injected. Therefore, optimizing the amount of reagent to be added would be a key focus for footprint reduction for in situ remedies that involve reagent injection.
- Excavation remedies: The largest contributions to energy and air footprints for excavation remedies are the transport of the excavated material or backfill material from one location to another. Minimizing this horizontal transport distance and choosing the optimal mode of transportation would be key areas of focus in reducing the footprints of excavation remedies. Many footprint reduction approaches also result in cost reductions.
13.7.3 Evaluation Methods
13.7.3.1 Greenhouse Gas (GHG) Emissions Evaluation Fact Sheet
GHG emissions generated during project activities are measured by “metric tons/cubic yards COC‐impacted soil” or “metric tons/gallons COC‐impacted groundwater” for project activities. The six GHGs listed in the 1997 Kyoto Protocol of the United Nations Framework Convention on Climate Change include the following:
- Carbon dioxide (CO2)
- Methane (CH4)
- Nitrous oxide
- Sulfur hexafluoride
- Hydrofluorocarbons (HFCs)
- Perfluorocarbons (PFCs)
CO2 is likely to be the primary contributor to GHG emissions at the majority of remediation sites; therefore the EPA assessment method only provides guidance to evaluate CO2 emissions. The GHG emissions evaluation may include both direct and indirect GHG emissions. Direct GHG emissions are emissions from sources owned or controlled by a particular party (World Business Council for Sustainable Development/World Resources Institute, 2004; The Climate Registry, 2008). Indirect emissions are GHG emissions that are a consequence of a party but occur at sources owned or controlled by another party,such as electricity use (WBCSD/WRI, 2004; TCR, 2008).
Evaluation Approach
The remediation project team identifies sources of direct and indirect emissions and associated emission factors in order to perform GHG emissions evaluation. An emission factor is a factor allowing GHG emissions to be estimated from a unit of available activity data and absolute GHG emissions (WRI/WBCSD, 2004; TRC, 2008). Occupational health and safety associated with tasks performed during project activities should be emphasized throughout the project. The metric for occupational health and safety is accidents requiring treatment beyond first aid.
13.7.3.2 Future Land Use
The future land use of a remediation project should be evaluated. This stressor considers the anticipated future land use of the site following project completion, for example, unrestricted/residential or commercial land use. The stressor also considers whether institutional controls are required following project activities. The metric for future land use is land use. Throughout the project, the remediation project team seeks to obtain the least restrictive land use for the site following remediation. Actual land use for which the site is cleaned up, including related institutional controls and land use covenants, is recorded.
13.7.3.3 Green Building
A green building is a structure that is environmentally responsible and resource efficient. Examples of green buildings include buildings certified to the US Green Building Council LEED scheme and those with Energy Star certification. This stressor is only applicable to project planning and office‐based task activities. The green building stressor does not have a metric. The remediation project team determines whether buildings occupied by team members are certified to the LEED, Energy Star, or other green building certifications.
13.7.3.4 Post‐remediation Site Conditions
The benefit of post‐remediation site conditions for a remediation project should be quantified. Post‐remediation site conditions reflect those that benefit the local community. This stressor is only applicable to O&M/closure activities. The metric for post‐remediation site conditions is beneficial use for the local community. The remediation project team identifies and implements opportunities to increase the local community’s beneficial use of the site. Example 13.11 presents a hypothetical project illustrating how to quantify the sustainability rating.
13.8 Tools
There are two major tools in green remediation: One is sustainable remediation tool (SRT) and another is SiteWiseTM.
Sustainable remediation tool (SRT): SRT is an Excel‐based tool designed to enable users to plan the future implementation of remediation technologies at a particular site, compare remediation approaches on the basis of sustainability metrics, and provide a means to evaluate the optimization of remediation technology systems already in place.
The SRT allows users to evaluate the sustainability impacts associated with various remediation technologies for soil and groundwater. The technologies include:
- Excavation.
- Soil vapor extraction.
- In situ thermal.
- Pump and treat.
- Enhanced bioremediation.
- Permeable reactive barriers.
- In situ chemical oxidation.
- Long‐term monitoring/monitored natural attenuation.
- Particulate matter (as PM10).
- Total energy consumed.
- Change in resource service.
- Technology cost.
- Safety/accident risk.
The tool is structured into two tiers:
- Tier 1, the simplest tier, comprises calculations based on rules of thumb that are widely used in the environmental remediation industry.
- Tier 2 comprises calculations that are more detailed and incorporate site‐specific factors.
The SRT is designed to be user‐friendly with menu‐driven work flows and on‐screen help topics. The tool is available for download from AFCEE’s sustainable remediation website at https://clu‐in.org/products/tins/tinsone.cfm?num=66247610
SiteWiseTM includes a number of Excel spreadsheets designed to evaluate sustainability impact associated with different remediation projects. The remediation project is broken down into four phases in the tool: remedial investigation (RI), remedial action construction, remedial action operation, and long‐term monitoring. Six different remedial alternatives may be considered at one time, enabling SiteWiseTM to be employed during the remedy selection process as well. Each phase is further broken down into following
- Material production.
- Transportation: personnel and equipment.
- Equipment used: earthwork, pumps, and other electric.
- Residual handling.
A number of stressors may be evaluated in SiteWiseTM, including GHG emissions; energy use; criteria pollutants emissions, including oxides of nitrogen, sulfur oxides, and particulate matter; water consumption; and worker safety. SiteWiseTM can be downloaded from the Navy’s sustainable remediation website: https://www.navfac.navy.mil/navfac_worldwide/specialty_centers/exwc/products_and_services/ev/erb/gsr.html.
13.9 Exercise
13.9.1 Questions
- Why is an activated sludge process so energy intensive yet is the most common wastewater treatment process?
- What are the major ways to reduce sludge?
- What are major strategies to retrofit WWTPs to energy positive?
- Why is anaerobic sludge digestion a better sustainable design than mechanical dewatering of sludge?
- According to energy benchmark data, which three processes in conventional WWTPs have the most potential to be retrofitted?
- What are the major metrics for green remediation?
- How is the footprint on energy calculated during remediation project?
- How energy mix affect the energy footprint?
13.9.2 Calculation
- Miami‐Dade Water and Sewer Department (WASD) aims to increase its water reuse rate from 5 to 30 and 60% in 5–10 years to end ocean outfall of treated wastewater by 2025. The proposal is to reclaim 40 MGD of the treated wastewater effluent in the Miami‐Dade South WWTP. The ultimate goal is to achieve zero energy, zero water, and zero nutrients.
- Since the discharge standards are extremely high, who are the stakeholders? How should two loops of the stakeholder involvement be designed during planning and implementation?
- Use the EPA five best WWTP examples reported by Tarallo (2015) to establish the best benchmark of performance metrics for this new treatment plant to be designed and built in the Miami-Dade Country.
- Using the 12 design principles, design a true WRRF that is energy neutral, 100% water reuse, and N and P recovery.
- Miami‐Dade County plans to retrofit three WWTPs into energy positive, in which eight projects are proposed as follows:
- COD is to be diverted from primary settler to anaerobic digester to decrease sludge production and increase biogas production.
- Anaerobic oxidation of ammonium (anammox) is proposed to reduce sludge production and aeration electricity.
- Fat–oil–grease and food wastes are diverted to anaerobic digester for more biogas production and decrease BOD to WWTP.
- Membrane bioreactor (MBR) will be used to increase WWTP capacity by increasing solid retention time.
- UV disinfection will be used to increase compliance of disinfection by‐product rules and reduce operation costs.
- Leachate will be separated and treated to reduce BOD and COD to WWTP and toxicity of leachate.
- Food wastes will be diverted to anaerobic digesters to increase biogas production.
- Theoretical values of energy balance in terms of kWh/m3 or kWh/kg COD.
- Benchmark values of energy balance in terms of kWh/m3 or kWh/kg COD.
- Best practices from the five best WWTPs.
- Compare WWTPs of Miami‐Dade County with the previous three values, and develop the best design alternatives to achieve the energy‐neutral design.
- For a WWTP serving a population of one million, conventional activated sludge is used. Please compare the energy, water, and material footprints of the following different design alternatives using the US EPA TRACI 2.0 (https://cfpub.epa.gov/si/si_public_record_report.cfm?dirEntryId=227747):
- Sandbed drying.
- Mechanical dewatering.
- Anaerobic sludge digestion with AnMBR.
- Anaerobic digestion with 5% fat–oil–grease from kitchen and restaurants.
13.9.3 Projects
13.9.3.1 Xiongan Project
- Please use daily per capita production data and energy content data to estimate the maximum energy that could be recovered by each of the different technologies discussed.
- How would you design the WWTP to be energy positive using innovative technologies for WWTPs that serve 1, 2, and 5 million PE in 5, 10, and 20 years in Xiongan?
- The first step in land development in Xiongan is to clean up the vast contaminated lakes and soil. Using green remediation metrics, please design the two different alternatives to clean up the site, and compare the water, energy, and material footprints of each alternative. Which alternative would you recommend and why?
13.9.3.2 Community Project Proposal
- Energy auditing of WWTP serves two purposes: (i) baseline for developing energy efficiency projects and (ii) quantitative energy consumption of each unit process for identifying energy gaps between the WWTP and best practice benchmarks for proposing retrofitting projects. Please contact WWTPs of your own city and request permission to conduct energy auditing for their WWTPs. Once you get the permission, please request following information to conduct a comprehensive energy auditing of their plants (US EPA, 2013):
Historical data from the facility supervisory control and data acquisition/control system (5–10 years):
- Average flow and load data
- Pump curves.
- Blower curves.
- Actual operational data (motor amperages).
- Electric/gas utility rates and bills.
- Diffuser manufacturer data.
- Miscellaneous plan drawings from previous construction projects (piping configurations, aeration diffuser layouts, etc.).
In your energy auditing report, please answer the following:
- What is the current unit energy consumption in terms of kWh/1000 m3 and kWh/kg COD removed?
- What are the unit processes that consume the most energy and the gap from the top 10% best practice WWTPs of its peer WWTPs?
- What are the energy retrofitting strategies would you recommend to improve the overall energy efficiency of the WWTP?
- What are the innovative technologies would you recommend to retrofit the WWTP to WRRF?
- What are the life cycle cost and benefit of the retrofitting technologies in terms of capital and O&M costs if the WWTP is to be in operation in the next 20 years?
- Within the Southern Florida Water Management District (SFWMD), water contaminated with nitrogen and phosphorus was discharged into the Everglades National Park (ENP), and, as a result, the ENP was almost ruined by exotic plants. In the federal court, the ENP sued the SFWMD for not performing its duty in protecting the ENP and won the case. As a result, every year, the restoration of the Southern Florida ecosystem started with one billion dollars per year from 1995 to 2015. In the plan, 13 elevated reservoirs were proposed, and the following questions were asked to stop the elevated reservoirs:
- How has the problem developed over time?
- What are the main direct and indirect causes of the problem’s development, including link polarities?
- What are the consequences of the problem?
- What are main feedback processes?
- What kind of short‐term policies do you think can be adopted to solve this problem?
- What kind of long‐term policies can be adopted to solve this problem?
- What are the main hurdles in the success of these policies?
References
- Shoener, B.D., Bradley, I.M., Cusick, R.D., and Guest, J.S. (2014). Energy positive domestic wastewater treatment: the roles of anaerobic and phototrophic technologies. Environmental Science: Processes and Impacts 16: 1204–1222.
- Shoener, B.D., Zhong, C., Greiner, A.D. et al. (2016). Design of anaerobic membrane bioreactors for the valorization of dilute organic carbon waste streams. Energy and Environmental Science 9 (3): 1102–1112.
- Tarallo, S. (2015). A Guide to Net‐Zero Energy Solutions for Water Resource Recovery Facilities. Alexandria: Water Environment Research Foundation.
- The Climate Registry (2008). General Reporting Protocol. Version 1.1, May.
- US EPA (2012). Methodology for Understanding and Reducing a Project's Environmental Footprint. Washington, DC: US EPA.
- US EPA (2013). Energy efficiency in water and wastewater facilities, Local Government Climate and Energy Strategy Series. Washington, DC: US EPA.
- World Business Council for Sustainable Development/World Resources Institute (2004). The Greenhouse Gas Protocol, a Corporate Accounting and Reporting Standard. Revised Edition, March.