
CHAPTER 15
Accounting Information in the Prediction of Securities Class Actions
Vassiliki Balla
INTRODUCTION
After the tenth anniversary of the passage of the Sarbanes-Oxley Act, there has been an increase in allegations related to SOX reporting requirements. According to the “2011 Review and Analysis” of Cornerstone Research, there has been an increase in Class Actions (CAs) in 2011 contrary to 2010, originating from accounting misstatements and financial restatements. It is worth noting that CAs, which are linked to accounting, take longer to resolve and are less likely to result in dismissal than settlement. However, accounting cases result in higher settlement outcomes. The year 2011 was characterized by increased stock market volatility, creating a dynamic environment for securities class action litigation. In recent years, there has been an increase in the number and value of securities class actions (SCAs), attracting the attention of various stakeholders such as investors, managers, policy makers, lawyers, and so on. Over the years numerous class action lawsuits have been in the spotlight, most of them involving securities fraud. It is worth noting that even in regular securities class actions that received less media attention in recent years, the compensation exceeded $500 million. By and large, even median class action cases may reach settlements of millions of dollars (Buckberg et al. 2003).
Importance of the Study
In recent years, there has been an increase in securities class action lawsuits indicating another type of risk: namely, the securities class action risk (Ryan and Simmons 2007). It has been made evident that companies should operate in a way to avoid all type of risks including the risk stemming from mass litigations. Pellegrina and Saraceno (2009) highlight the significance of the phenomenon in the banking sector, indicating that the size of a class action may be a warning signal about the bank's stability. Accordingly, it is vital for all business sectors, as well as investors and stakeholders (e.g., creditors, debtors, staff), to be aware of the risk exposure that stems from a class action before making an investment decision. For this reason, it would be beneficial to investors, who do not participate in a class action, to be able to know if the company will face a class action in the future, long before it is announced. Current research builds on this and focuses on the development of a model to predict securities class actions.
There are many studies that prove the negative effect of security class actions on stock returns. Abnormal security returns will be observed not only when misrepresentations are discovered in a company's financial statements, but also in periods preceding the discovery. Kellogg (1984) and Alexander (1996) agree that the non-disclosure of adverse information that inflates the price of a stock harms the investors who purchase the stock.
Supporting evidence suggests that a security class action might be seen as an event of three stages (Ferris and Pritchard 2001). The first stage is the revelation of a potential fraud, in which there is significant negative reaction to stock price. The second stage is the filing of the fraud to court, in which the significance is smaller but still the reaction to stock price is negative. Lastly, there is the third stage of the judicial resolution, during which there is no reaction to stock price. This evidence shows that only the revelation of a potential fraud has immediate reaction to stock price. Shareholders are not much interested about the outcome of the lawsuit (third stage); rather, they are concerned about the revelation of the incidence (first stage) and its filing (second stage). A related empirical study proved that the revelation of a potential fraud is linked to an abnormal negative return of 21.5 percent during a three-day period surrounding the announcement of negative information, 23.5 percent during the formation of the class and until two days before the announcement, and 43.8 percent during the entire class period (Niehaus and Roth, 1999).
According to Chava et al. (2010), security class actions are likely to increase a firm's perceived risk in corporate governance, information asymmetry, and operation, and therefore its cost of equity capital. They found that after the lawsuit is filed, a firm's cost of equity capital increases significantly. Also, security class actions are associated with indirect costs such as difficulty in recruiting directors and auditors after a lawsuit has occurred. More importantly, security class actions disrupt the relationships between an entity and its suppliers and customers (Black et al. 2006).
Securities class actions affect CEO turnover, too. Out of a sample of 309 companies that were sued and settled between 1991 and 1996, their board structure did not change significantly after a lawsuit, whereas insider holdings declined. The probability of CEO turnover increases for both high and low settlement cases, from about 9 percent per year before to about 23 percent per year after the settlement (Strahan 1998). A class action's announcement harms CEOs’ and CFOs’ future job prospects. After such an event, CEO turnover takes place as well as pay-cuts and takeovers, causing a negative market reaction (Humphery-Henner 2012).
A class action results in decrease of overinvestment. This decrease matches with an increase in cash holdings, a decrease in pay-outs, and an increase in leverage. Firms that have faced a class action in the past change their behavior toward better governance, greater focus, and lower overinvestment (McTier and Wald 2011).
The existing literature presents descriptive and statistical evidence for securities class actions trying to investigate the factors that cause this phenomenon. Part of the literature applies statistical analysis, which either relates to the consequences of SCAs as explained earlier or investigates its effect to the share price. Conclusively, this research employs five classification techniques, plus an integrated method, in order to predict the phenomenon of security class actions. In other words, it is the first study that examines the prediction of securities class actions in industrial sector basing on data from the most recent period (2003–2011) and while employing the largest sample so far.1
Focusing on Industrial Sector
Prior research in the field has covered the examination of banking sector (Pellegrina and Saraceno 2011; Balla et al. 2014). This is surprising, since the industrial sector has been subject to the highest class actions of all time, such as the case of Master Tobacco ($206 billion) and the case of Dukes v. Wal-Mart Stores ($11 billion). Furthermore, the recent financial crisis resulted in a number of credit-crisis cases filed since 2007. BP in the energy sector, NOVARTIS in the healthcare-sector, and NOKIA and YAHOO! in the information technology sector are some characteristic examples that prove that the industrial sector is a major target of securities class actions.
Focusing on the United States
The legal framework of the United States that covers securities class actions is clearer than in any other country for many years now. Security class actions operate in a specific legal context, which is approved by the United States, blocking ineligible and inappropriate securities class actions to take place that would be incorrectly traced. European jurisdictions and the EU have different features compared to the U.S. class actions system. Therefore, it is not only the fact that U.S. firms were chosen because they are all subject to the same jurisdiction as previously explained, but also because this jurisdiction is considered to be more integrated than any other in the world. Hence, the lack of a common base upon which class actions operates causes difficulties in creating a homogeneous sample with comparable data, highlighting the appropriateness of a US dataset.
LITERATURE REVIEW
It is not surprising that a growing strand of the literature examines the causes of securities class actions, providing insights into the litigation process and analyzing the effects of lawsuits on corporations (e.g., McTier and Wald 2011). Others examine the factors that influence the probability of a security class action (e.g., Strahan 1998). However, there are no studies on the development of quantitative multicriteria models to predict security class actions (apart from Balla et al. 2014, who focused on banking sector), in advance of their occurrence. This chapter attempts to fill this material gap.
The disclosure of bad news increases the probability of security class actions. Kinney et al. (1989) claim that when firms restate their financial statements due to material errors, the yield of the stock returns is directly affected, increasing once more the probability of a lawsuit. There is evidence to link the size of the company with the lawsuit, proposing that larger companies have higher probability to face a class action, as they promise large damage compensation (Sarra and Pritchard 2010).
The first issue that should be noted is that of methodology. Half of the papers used logistic regression and the other half probit regression, in order to determine the variables that play an important role. This is considered as sufficient, given the fact that they did not aim to develop prediction models. This chapter will apply more advanced techniques (UTADIS, MHDIS, SVMs), filling in this way this gap and enriching a rather poor literature, as far as the methodology is concerned.
Even though the first study comes from Kellogg (1984), including data from 1967 to 1976, the researchers that followed did not include in their analysis data between 1977 and 1990 due to the stagnant legal framework that repelled researchers from investigating this phenomenon. The era that most authors examined is between 1996 and 2004, mainly because during that period the enactment of PSLRA and SLUSA took place, giving incentive to academicians to investigate its impact on the phenomenon. The current study ranks among three other studies (Poulsen et al. 2010; Pellegrina et al. 2011; Balla et al. 2014) that account for the most recent period of 2003–2011.
The only literature that directly relates to the current study comes from McShane et al. (2012), who use Hierarchical Bayesian model, and Balla et al. (2014), who developed classification models to forecast the incidence of security class action. All other researches examine whether certain variables affect the filing of a lawsuit. Consequently, this is the third study that will research the prediction of securities class actions and the second that will apply multicriteria techniques in order to predict the phenomenon of securities class action.
METHODOLOGY
UTilités Additives DIScriminantes (UTADIS)
UTADIS is a classification method that uses an additive utility function in order to score firms and decide upon their classification. It is a variant of the well-known UTA method (UTilités Additives) (Zopounidis and Doumpos 1999).
Its general form is:

Where gi = (g1, g2,…, gn) is the vector of evaluation criteria, pi is a constant indicating the significance of criterion gi (p1 + p2 +…pn = 1), and ui(g1) is the marginal utility of criterion gi. The evaluation criteria g1, g2,…, gn involve all the characteristics (qualitative and/or quantitative) of the alternatives that affect their overall evaluation. In the case of the class action's prediction, the evaluation criteria involve the financial ratios. The alternatives under consideration are classified by the decision maker into q classes C1, C2,…, Cq (in our case there are two classes: the first contains the firms that faced CA at least once in the past; and the second, firms that never faced CAs so far).
Multi-group Hierarchical Discrimination (MHDIS)
An alternative MCDA non-parametric approach is the multi-group hierarchical discrimination (MHDIS) method. MHDIS has been successfully applied in classification problems in finance, such as credit risk (e.g., Doumpos and Zopounidis 2002) and M&A's (Zopounidis and Doumpos 2002). MHDIS distinguishes the groups progressively, starting by discriminating the first group from all the others, and then proceeds to the discrimination between the alternatives belonging to the other groups.
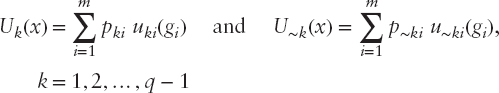
The utility functions in MHDIS do not indicate the overall performance but, rather, serve as a measure of the conditional similarity of an alternative to the characteristics of group Ck when the choice among Ck and all the lower groups Ck+1,…, Cq is considered. However, similarly to the UTADIS, the estimation of the weights of the criteria in the utility functions, as well as the marginal utility functions, is accomplished through mathematical programming techniques. More specifically, at each stage of the hierarchical discrimination procedure, three programming problems (two linear and one mixed-integer) are solved to estimate the utility thresholds and the two additive utility functions in order to minimize the classification error, as summarized.
Support Vector Machines (SVMs)
Support vector machines (SVMs) can be used for regression as well as for classification. SVMs are a family of learning algorithms first introduced by Vapnik in 1995 that can solve linear and nonlinear problems. In current research, SVMlight was applied in classifying SCAs. SVMlight is an implementation of basic SVM for the problem of pattern recognition. The optimization algorithms used in SVMlight can handle problems with many thousands of support vectors efficiently. This can be represented by the following equation:
![]()
Where y is the outcome, yi is the class value of the training example xi, and • is the dot product. The vector x corresponds to an input, the vectors xi are the support vectors, and b and ai are parameters that determine the hyperplane (a ≥ 0).
Majority Voting
Majority voting (MV) is a simple framework that allows us to combine different methods operating on binary classification outputs (class actions / non–class actions). The MV method goes with the decision where there is a consensus that at least half of the classifiers agree on it. Let us assume that there is a system L of K classifiers, L = {l1,…, lM}, and yk(xi), i = 1,…, n and k = 1,…, K, that denote the output of the kth classifier for the ith multidimensional input sample xi. Given the binary outputs from the M classifiers for a single input sample, the decision of the MV classifier can be represented as follows:

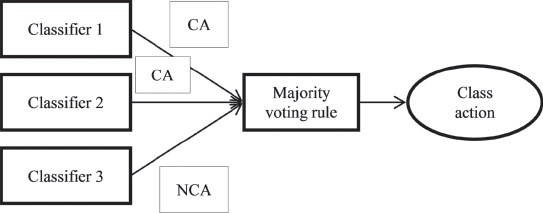
Figure 15.1 illustrates the application of the majority voting combining the output of three classifiers. Classifiers 1 and 2 indicate that the firm has faced a class action, whereas classifier 3 indicates the opposite. Therefore, just because two out of three classify the firm as facing a class action, the final decision under majority voting rule is that the firm will be classified in the group with the class action firms.
The combination of multiple classifiers has received increased attention in recent applications in finance, such as credit scoring and the prediction of acquisitions (Pasiouras et al. 2005).
DATA
The current research investigates firms that faced a security class action lawsuit at least once during the period 2003 to 2011. These firms are matched with another set of firms that did not face a security class action lawsuit during the same period:
- The financial data are drawn from the OSIRIS Database of Bureau van Dijk, as it has been extensively used for research in the area of accounting and finance (Lara et al. 2006).
- The list of firms that faced SCAs is drawn from the Securities Class Action Clearinghouse maintained by the Stanford Law School in cooperation with Cornerstone Research.
In order to include firms subject to SCAs in the sample, they should meet the following criteria:
- Only filings that took place between January 1, 2003, January 1, 2003, and December 31, 2011, and December 31, 2011, are considered for inclusion in the sample. This is due to unavailability of financial data in the online version of OSIRIS Database of Bureau van Dijk, prior to 2001.
- SCAs should be filed to USA courts.
- All firms should be classified in OSIRIS as industrial companies.
- Data should be available in OSIRIS for at least one year prior to the SCA—that is, if a SCA took place in 2004, then financial data of 2003 should be retrieved from OSIRIS.
- To include NCAs firms into the matching sample, they should meet the same criteria, the only exception being that they should not have been subject to a SCA. To be more specific, when a company in the energy sector faced a SCA in 2007, it should be matched with another company of the same sector that did not face a class action in the same year. In both cases, financial data from the year prior to the event (i.e., 2006) should be available in OSIRIS.
Sample Construction
Initially, we identified a total of 1,204 U.S, firms that faced a SCA, which were matched by size and industry with an equal number of NSCA firms. Then, 168 firms were excluded due to unavailability of data, reducing the sample to 1,036 SCA and 1,036 NSCA firms. Therefore, the total number of filings is 2,072 companies operating in the United States over the period 2003 to 2011.
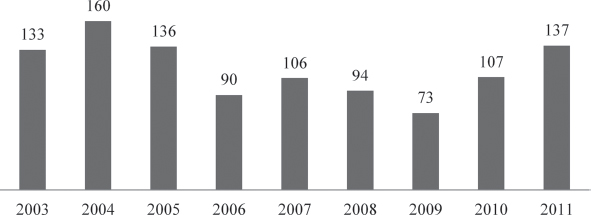
Figure 15.2 presents the distribution of the SCAs over the period of the analysis. For example, our sample includes 136 companies that faced a SCA during 2005.
Table 15.1 presents the nine sectors that were used in the analysis. For example, the “Manufacturing” sector contains firms that relate to manufacturing and construction industry; the “Consumer Staples” sector contains products that satisfy essential needs such as food, beverages, tobacco items, and so on. The “Information Technology,” the “Healthcare,” the “Consumer Discretionary,” and the “Manufacturing” are the sectors with the largest average number of class action filings for the period under examination. Table 15.1 also presents the total number of class actions per sector under investigation. Therefore, we collected financial data of 23 SCA firms from the same sector (“Utilities”), lagged by one year, and so on.

The matching was made according to the sector and to the year the class action took place. For example, for a company in the “Energy” sector that faced a class action during the year 2003, financial data from the prior year (i.e., 2002) were gathered and were matched to another company from the “Energy” sector that was not subject to a SCA, using data from the same year (i.e., 2002). In other words, in both cases (SCA and NSCA firms), financial data from the previous year (i.e., 2002) were used.
The total sample must be split into two subsamples: the training sample and the validation sample. The training sample will be used for model development and the validation sample will be used to test the predictive ability of the models. The current research splits the sample in the two subsamples under the “2/3 rule” (Panel A, Model A) and under the “Crisis rule” (Panel B, Model B), as will be explained further.
Training and Validation Sample (Model A) As mentioned earlier, the total sample consists of 1,036 firms that faced a SCA during 2003 to 2011 and 1,036 firms that were not subject to a SCA over the same period. The training sample amounts a total of 1,382 firms so that two-thirds of the sample will be used for training purposes (66 percent).
The validation sample consists of the remaining 345 firms (i.e., not used in the training dataset) that faced a SCA during 2010 to 2011 matched with another 345 firms that did not face a SCA during the same period. That makes a total validation sample of 690 firms, which is around 33 percent of our total sample (see Table 15.2).
Training and Validation Sample (Model B) A further test will be applied over the credit crisis period to examine whether the performance of the models is robust. On the basis of a cut-off point in time, the two subsamples that are produced correspond to the precredit and postcrisis period. So, the training sample contains data from 2003 until 2007.
The validation sample consists of 411 firms that faced a SCA between 2008 and 2011 and 411 firms that did not face a SCA. Therefore, the total size of the validation sample is 822 firms, corresponding to 40 percent of the total sample. Table 15.2 summarizes the construction of the training and validation samples under the division of the 2/3 rule (Panel A Model A), as well as the construction of training and validation samples taking into consideration the crisis that occurred in 2008 (Panel B Model B).

Variables
OSIRIS contains numerous quantitative variables. In the beginning, various basic pre-calculated ratios were extracted. After the above data were exported, variables with missing values of more than 5 percent were excluded from the analysis. So, the final set of accounting variables is limited to the remaining eight:
- Return on assets (ROA), measuring the profitability of a firm
- Current ratio (CR), measuring the liquidity level of a firm
- Equity to total assets (E/TA), measuring the leverage of a firm
- Total assets (TA), measuring the size of a firm
- Total of all immediate negotiable medium of exchange or instruments normally accepted by banks for deposit and immediate credit to a customer account (CE/TLD), measuring the liquidity level of a firm
- Goodwill to total assets (G/TA), measuring the goodwill of a firm
- Historical background of each company to SCAs (PAST), measuring the repetition of an action after a SCA has already taken place in the past
- Net sales to total assets (NS/TA) measuring the productivity of a firm
Variables Reduction Process
We applied descriptive statistics for the two groups in order to investigate the main characteristics of target firms and further a correlation analysis.
The main results from the descriptive statistics are summarized below:
- As far as the profitability is concerned, the results offer a preliminary indication that earnings generated from invested capital (assets) are more in firms belonging in the NSCA group than those belonging in the SCA group. In other words, firms belonging in NSCA group make use of their assets more efficiently than firms belonging in SCA group. Gande and Lewis (2009) provide supporting evidence that firms that have lower profitability ratio will face a SCA.
- In terms of liquidity, the firms that belong in the SCA group have better liquidity than those belonging in the NSCA group. This suggests that firms that belong in SCA group have better working capital management than those firms that belong in the other group.
- Concerning the productivity, the firms that belong in the SCA group have lower ratio of net sales to total assets than those that belong in the NSCA group. High ratio indicates effective pricing strategy. Firms with low profit margins tend to have high asset turnover, while those with high profit margins have low asset turnover. So, it is clear that firms belonging in SCA group have lower productivity than firms belonging in the NSCA.
- The firms that belong in the SCA group are firms with low level of total assets (measuring the size of the entity) compared to the NSCA group. This is an indication that small entities are SCA targets, even though Pellegrina and Saraceno (2011) and Donelson et al. (2012) proved that the log of TA is positively linked to the litigation.
- Firms belonging in SCA group do not have high goodwill compared to firms belonging in the NSCA category. This stems from the fact that G/TA is lower in the SCA group than that of firms than belong in NSCA group, although the difference is quite small.
- The figures for leverage suggest that SCA is attracted by firms with high level of equity, given that the SCA firms tend to have higher levels of equity to total assets ratio than the NSCA firms. This indicates that shareholders will file a class action against a firm that has increased equity in relation to total assets. McTier and Wald (2011) found that leverage2 is negatively correlated with statistical significance at the 1 percent level in all models except one, in which the correlation is not statistically significant.
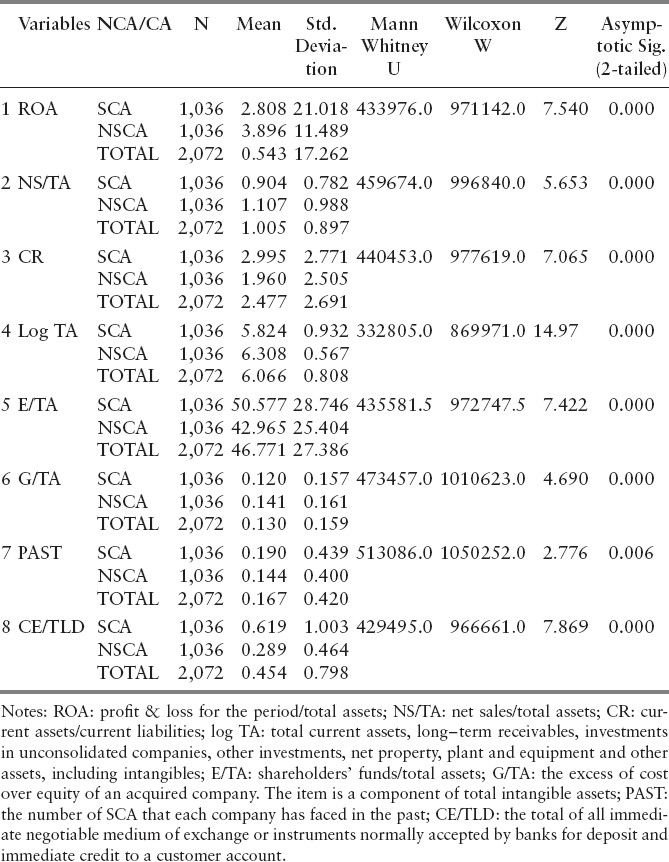
- Finally, it seems that the firms belonging in the SCA group are those that have historical background in litigation. This is supported by the higher mean of SCA group. Gande and Lewis (2009) used a dummy called “previous lawsuit” in order to examine whether the legal past of a business plays significant role. The results showed that this dummy is positively correlated and statistically significant at the 1 percent level.
Univariate Test of Two Groups
A parametric approach applied, in order to test whether the means of the retained variables differ among the two groups of firms. The results are the same when a non-parametric approach is applied. All the variables are statistically significant at the 1 percent level. Thus, all the variables seem to have discriminative power between SCA and NSCA firms under the assumption that the two groups are not normally distributed.
Correlation Analysis
An important issue of concern is multicollinearity. If there is a strong correlation among the variables, the estimates of the regression model may become unstable. The outcome of the non-parametric test shows that further attention needs to be paid on the statistical significant variables. Thus, we examine the correlation among the variables. Table 15.4 shows the correlation coefficients.
The variable CE/LTD is considered to highly correlated with CR, which is somehow expected, since they belong to the same category representing liquidity. Therefore, CE/TLD will be excluded from further analysis. The rest of the variables do not seem to correlate with each other, a fact that allows us to consider them in further analysis. The final set of variables to be included to the classification models are the ones shown in Table 15.5.


RESULTS
Before moving to the discussion of the results, it should be reminded that two approaches are followed for the analysis of the models: that is, the Model A (where two-thirds of the sample will be used for training purposes) and the Model B3 (where the training and validation samples were constructed in such way as to correspond to the pre- and post-crisis period).
Table 15.6 shows the coefficients of LA. All signs are as expected. First of all, ROA, NS/TA, Log TA, and G/TA are negatively related to the probability of a SCA, while all the rest carry a positive sign. The variable PAST is statistically significant and positively related to the probability of SCAs. Apart from E/TA and G/TA, all the rest variables are statistically significant in both cases.
Supporting results are provided by DA and SVMs in Table 15.7 showing the coefficients of these variables. Once more, all signs are as expected. As in the case of LA, the variables ROA, NS/TA, log TA, and G/TA are negatively related to the probability of a SCA. Moreover, results do not differ materially in the case of the crisis robustness test (Model B).
Table 15.8 presents the UTADIS and MHDIS weights of the model in both cases. As far as the UTADIS results are concerned, the ratio CR contributes the most to the classification (36.41 percent and 38.41 percent in both cases respectively). The log TA variable follows by contributing 36.19 percent and 32.34 percent. NS/TA weights 12.42 percent and 13.47 percent again in both cases, and ROA contributes by 11.91 percent and 11.02 percent. Also, the variable PAST plays a role, although small to the classification of the firms, weighting 4.09 percent and 3.64 percent in both cases, respectively. Thus, when a firm has faced a massive lawsuit in the past, it has many chances to face another one in the future. It is worth noting that once more all variables play a significant role to the classification, apart from G/TA, which does not affect the classification of firms in the two groups.


As far as MHDIS is concerned, CR contributes more to the classification 86.82 percent and 62.02 percent in NSCA group and in SCA group 0.00 percent and 24.00 percent under Model A and Model B, respectively. The Log TA contributes 8.38 percent and 23.58 percent in NSCA group and 12.62 percent and 0.00 percent in SCA group, in both models, respectively. The NS/TA ratio follows weighting 0.61 percent and 0.50 percent in NSCA group and in SCA group 11.55 percent and 12.03 percent in both cases. ROA weights 0.62 percent and 10.93 percent in NSCA group and 6.88 percent and 0.34 percent. G/TA ratio influences by 0.69 percent and 0.77 percent in NSCA group and 66.93 percent and 60.49 percent the classification of SCA firms in both cases, respectively. Once more, all variables play a significant role to the classification.
This above clarifies that there is consistency in the results regardless of the employed method. Most of the selected accounting variables play a significant role in the classification. Four out of the seven variables are statistically significant in discriminating between SCA and NSCA firms. These results can be linked to the weights given by UTADIS and MHDIS, which indicates that these four variables play the most important role in classifying firms into SCA and NSCA group.
The results provided by the techniques proved that there are differences in classification accuracies even when the dataset is the same. In some cases, LA provided higher classification accuracy than UTADIS, and vice versa. This happens because each technique processes differently the information given. In other words, even though the dataset employed is the same, there are differences in the implicit criteria for solving the problem. As a result, some methods are more accurate in classifying SCA firms and others are more accurate in classifying NSCA firms.
Each technique employs different algorithms for the development of a prediction model and utilizes different objective functions. Even techniques that belong to the same category may provide totally different results.
For instance, UTADIS and MHDIS belong to multicriteria decision aid models group. UTADIS solves one linear programming formulation to minimize the sum of all misclassifications. MHDIS solves three mathematical programming formulations, two linear and one mixed-integer, involving (1) minimization of overall classification error, (2) minimization of the number of misclassifications, and (3) maximization of the minimum distance between the global utilities of the correctly classified banks. These techniques generate different weights affecting the utility scores, and consequently provide different classification accuracies (Doumpos and Zopounidis 2002). Discriminant analysis on the other hand as a multivariate statistical technique develops a linear discriminant function in order to maximize the ratio among–group to within-group variability, assuming that the variables follow a multivariate normal distribution and that the dispersion matrices of the groups are equal (Zopounidis and Doumpos 1999). These assumptions do not apply in real world problems, like security class actions. As such, DA (as well as LA) was used for comparison purposes.
Profile of SCA Target Firms
The analysis of the examined variables will assist us provide a profile of the target firms that have more probabilities to face a security class action. Let's examine the variables in more detail.
ROA & CR ROA relates negatively to SCA. The lower the ratio is, the more likely it is for a firm to face a SCA. This result is in line with CR, which is linked to the SCAs in a positive way, implying that firms, that are SCA targets are the ones that present increased current assets compared to current liabilities to the financial statements. Firms with high liquidity and low profitability have more chances of facing a massive litigation, due to the fact that the shareholders expect to be compensated by firms that have high liquidity. When a firm achieves high profitability compared to its total assets (high ROA), the shareholders are not willing to proceed to a SCA, showing a sense of trust to the financial management, as well as to generate expectations for a prosperous future performance (i.e., continuous and hopefully increased profitability in the future). It would not have been to the shareholders interest to turn against the firm disturbing its day to day operation, with unexpected consequences; either positive or negative.
ROA and CR are statistically significant at 1 percent level, meaning that these variables are statistically reliable. Also, the weights in UTADIS are 9.91 percent and 11.02 percent in Model A and Model B accordingly; that is the fourth most significant variable playing an important role in the classification of the firms. As for CR, the weights in UTADIS are 36.41 percent and 32.34 in the Model A and the Model B accordingly, making it the second most significant variable. The weights in MHDIS are 0.00 percent (Model A) in SCA and 86.82 percent in NSCA. In the Model B the weight in SCA is 24.00 percent, while in NSCA is 62.02 percent. The results agree with those of Gande and Lewis (2009) and Peng and Röell (2008), who found ROA to be negatively related to the SCA with statistical significance at 5 percent level.
NS/TA NS/TA ratio is used to capture the productivity level of a firm. It turns out that NS/TA ratio is negatively related to SCA. The firm's productivity is directly affected, when it utilizes its assets inefficiently, and therefore a satisfactory level of sales cannot be generated. From the shareholders’ point of view, this is translated as a sign of inefficient financial management, a fact that that makes them willing to start thinking of creating a class. Linking this productivity ratio with the profitability ratio discussed above (ROA), firms with inefficient use of assets will likely face a SCA. NS/TA ratio is also statistically significant at the 1 percent level. Regarding UTADIS, it the third most influencing factor with 12.42 percent and 13.47 percent in both cases, showing that this variable plays a significant role along with ROA, CR, and Log TA. MHDIS is also consistent with UTADIS results, generating 11.55 percent in SCA and 0.61 percent in NSCA (Model A) and 12.03 percent in SCA and 0.50 percent in NSCA (Model B).
Log TA Log TA is negatively related to SCA. Small-size firms measured in terms of the log of total assets have increased possibility to face a SCA, compared to their larger rivals. This is explained by the fact that the shareholders target small firms, which are probably being run by inexperienced managers, and they can be an easier target in the case of a lawsuit compared to large corporations. Log TA is statistically significant at the 1 percent level in Model A and also when crisis robustness is tested (Model B). McTier and Wald 2011 found that small firms are less likely to face a SCA provided they paid a high dividend. It can be assumed that the shareholders may be biased by this kind of dividend policy. However, it is doubtful whether this would be the case if a small firm did not distribute profits. Pellegrina and Saraceno (2011) conclude that banks with high total assets have high probability to face a SCA, but they avoid such legal actions as they please shareholders through compensation mechanisms. Large banks in terms of total assets have the capability to distribute dividends, whereas small firms usually do not have this kind of flexibility, thereby increasing the possibility to face SCA. It should be kept in mind that Pellegrina and Saraceno (2011) focused only on banking sector, whereas the current study focuses on the industrial one. Moreover, the findings of the current study support the findings of Poulsen et al. (2010), who also found that the logarithm of total assets and ROA are negatively related to a SCA.
G/TA G/TA ratio relates negatively to the SCA, indicating that the lower the G/TA ratio is, the higher the possibility that a firm does not manage its intangible assets in the most effective way. The firms that receive lawsuits are the ones that have not paid significant attention to build their goodwill. Although it is not a statistically significant variable at all levels in either Model A or Model B, it is still included in the analysis as a measure of size control in addition to log TA. According to MHDIS, G/TA ratio weights 66.93 percent in SCA and 0.69 percent in NSCA and 60.49 percent in SCA and 0.77 percent in NSCA in Model A and Model B accordingly.
PAST PAST is positively related to SCA. This indicates that massive lawsuits will take place in firms that faced SCAs in the past. Donelson et al. (2012) examine the incidence of a SCA in the case where the firm operates in a high litigation risk industry. They support that a firm in a high litigation risk industry is more likely to be sued compared to one belonging in an industry with no historical background in litigations. Gande and Lewis (2009) and Pellegrina and Saraceno (2011) agree with these findings, showing that firms that experienced litigation activity in the past have higher likelihood of being sued again.
E/TA E/TA ratio is positively related to SCA. The higher a company's equity against its debt is, the higher is the probability of SCA. When existing shareholders invest more and/or new shareholders invest in a firm, this increases the possibility of SCA. Increased equity reflects increased expectations from the side of investors/shareholders. Hence, they would be willing to proceed to a SCA in case they would not be compensated for their investment. Additionally, increased equity stemming from new shareholders increases the possibility of finding a group of unsatisfied ones who would be willing to proceed to a SCA. Previous literature captures the leverage characteristic through the use of total debt to total assets claiming that higher leverage leads to higher probability of a SCA (Amoah and Tang 2010; Poulsen et al. 2010). Evidence from Peng and Röell (2008) and Strahan (1998) support the idea that high debt may indicate a recent history of poor performance, asset write-downs, or forced heavy borrowing that fuels shareholder dissatisfaction and leads to massive litigations. So, the higher the firm's leverage, the higher the risk, and consequently the higher the probability of a SCA.
Results of Six Classification Methods
Table 15.9 summarizes the results of all six classification methods. The comparison of the results obtained in the training and validation datasets show that the models are quite stable, achieving similar accuracies in the two datasets.
Panel A summarizes the overall accuracy in the validation sample. We observe that UTADIS provides the highest classification of 70.72 percent, followed by SVMs and MV (68.84 percent). DA and LA follow with 67.50 percent and 67.40 percent, respectively. Turning to the accuracies in the SCA group, MHDIS provides the best classification with 57.97 percent, DA with 55.70 percent, and LA with 54.80 percent. As for the NSCA group, UTADIS provides the best classification with 89.86 percent, SVMs with 88.12 percent, and MV (as an integrated method) with 84.05 percent.
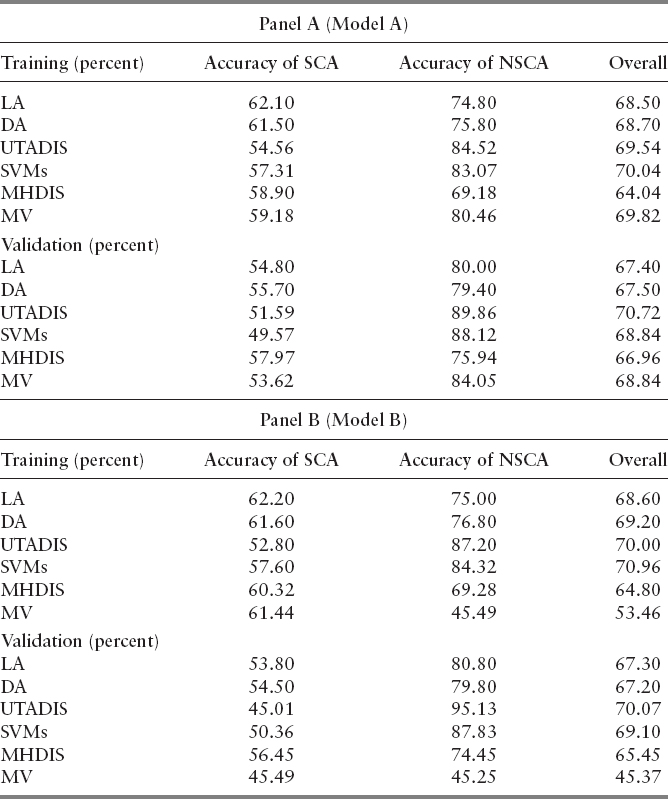
Panel B summarizes the results of all six classification methods when the crisis robustness test is applied (Model B). The classification results are generally in line with the previous ones. As far as the overall accuracy in validation sample is concerned, UTADIS provides the highest classification of 70.07 percent, followed by SVMs and MV(69.10 percent). LA and DA follow with slightly lower accuracy (67.30 percent and 67.20 percent, respectively). As it regards the accuracy in the SCA group, MHDIS provides the best classification with 56.45 percent, DA with 54.50 percent, LA with 53.80 percent, and SVMs with 50.36 percent. Turning to the NSCA group, UTADIS provides again the best classification with 95.13 percent, followed by SVMs and LA with 87.83 percent and 80.80 percent, respectively.
MV as a popular integration technique is applied in order to examine whether the combination of different methods can lead to better classification results. It is clear from both tables that its application has not resulted in a significant improvement in the recorded classification accuracies. In more detail, in Table 15.9 (Panel A) the overall accuracy under MV in the training sample is 69.82 percent and in the validation sample is 68.84 percent. The overall accuracy in Table 15.9 (Panel B) in the training sample is 53.46 percent and in the validation sample is 45.37 percent.
CONCLUSIONS
Focusing on the industrial sector, this study explores the predictability of the five separate classification techniques plus an integration technique, so as to value the probability that a firm will face a class action in the future. It is important that we utilized the largest sample size so far, counting 2,072 cases from the industrial sector in the United States. In addition, the data collected cover a wide period of time, 2003 to 2011, which is immediately after the Sarbanes–Oxley Act took place in 2002.
Firms with high liquidity and low profitability have more chances of facing a massive litigation due to the fact that the shareholders expect to be compensated by firms that have high liquidity. According to UTADIS, the profitability ratio (ROA) is the fourth most significant variable in the classification of the firms, and liquidity ratio (CR) is the second most significant variable. These results are in line with those of Gande and Lewis (2009) and Peng and Röell (2008). Inefficient financial management (low NS/TA ratio) drives the shareholders to form a class and go against the firm. Regarding UTADIS, this variable plays also a significant role. Against McTier and Wald (2011) and Pellegrina and Saraceno (2011), this research reveals that small-size firms have increased possibility to face a security class action, compared to their larger rivals. Poulsen et al. (2010) provides supporting evidence that the logarithm of total assets and ROA are negatively related to a security class action.

Moreover, the firms that that receive lawsuits are the ones that have not paid significant attention to build their goodwill and have experienced litigation activity in the past. Once more, the results are in line with Donelson et al. (2012), Gande and Lewis (2009), and Pellegrina and Saraceno (2011). Also, the higher the firm's leverage, the higher the risk, and consequently, the higher the probability of a security class action supporting results by Peng and Röell (2008) and Strahan (1998).
The classification techniques provide consistent results, and the order in which the methods provide the highest accuracies are the same for the two models, as shown in Table 15.10.
Undoubtedly, MHDIS, UTADIS, and MV are the best classifiers in all models providing over 60 percent accuracy. Interestingly in overall accuracy UTADIS and MHDIS takes the first place in all models in overall accuracy and SCA group, respectively.
REFERENCES
Alexander, J. C. 1996. Rethinking damages in securities class actions. Stanford Law Review 48 (6): 1487–1537.
Amoah, N., and A. Tang. 2010. Board, audit committee and restatement-induced class action lawsuits. Advances in Accounting, Incorporation Advances in International Accounting, 26 (2): 155–169.
Balla, V., C. Gaganis, F. Pasiouras, and C. Zopounidis. 2014. Multicriteria decision aid models for the prediction of securities class actions: evidence from the banking sector. OR Spectrum 36: 57–72.
Black, B. S., B. R. Cheffins, and M. Klausner. 2006. Outside Director Liability. Stanford Law Review 58: 1055–1159.
Buckberg, E., T. Foster, and R. Miller. 2003, June. Recent trends in securities class action: Will Enron and Sarbanes-Oxley change the tides? NERA Economic Consulting.
Chava, S., C. A. Cheng, H. Huang, and G. J. Lobo. 2010. Implications of securities class actions for cost of equity capital. International Journal of Law and Management 52 (2): 144–161.
Donelson, D. C., J. J. McInnis, R. D. Mergenthaler, and Y. Y. Yu. 2012. The timeliness of earnings news and litigation risk. Accounting Review.
Doumpos, M., and C. Zopounidis. 2002. Business failure prediction: A comparison of classification methods. Operational Research 2 (3): 303–319.
Ferris, S., and A. A. Pritchard. 2001. Stock price reactions to securities fraud class actions under the private securities litigation reform act. Michigan Law and Economics Research Paper No. 01–009.
Gande, A., and C. Lewis. 2009. Shareholder-initiated class action lawsuits: Shareholder wealth effects and industry spillovers. Journal of Financial and Quantitative Analysis 44 (4): 823–850.
Humphery-Jenner, M. L. 2012. Internal and external discipline following securities class actions. Journal of Financial Intermediation 21: 151–179.
Kellogg, R. 1984. Accounting activities, security prices and class action lawsuits. Journal of Accounting and Economics 6: 185–504.
Kinney, W., and L. L. McDaniel. 1989. Characteristics of firms correcting previously reported quarterly earnings. Journal of Accounting and Economics 1: 71–93.
Lara, J. M. G., B. G. Osma, and B. G. D. A. Noguer. 2006. Effects of database choice on international accounting research. ABACUS 42 (3–4): 426–454.
McShane, B., O. O. Watson, T. Baker, and S. S. Griffith. 2012. Predicting securities fraud settlements and amounts: A hierarchical Bayesian model of federal securities class action lawsuits. Journal of Empirical Legal Studies 9 (3): 482–510.
McTier, B. C., and J. K., Wald. 2011. The causes and consequences of securities class action litigation. Journal of Corporate Finance 17: 649–665.
Niehaus, G., and G. Roth. 1999. Insider trading, equity issues, and CEO turnover in firms subject to securities class action. Financial Management 28 (4): 52–72.
Pasiouras, F., S. Tanna, and C. Zopounidis. 2005. Application of Quantitative Techniques for the Prediction of Bank Acquisition Targets. Singapore: World Scientific Publishing Co.
Pellegrina, L. D., and M. Saraceno. 2011. Securities class actions in the US banking sector: Between investor protection and bank stability. Journal of Financial Stability 7: 215–227.
Peng, L., and A. Röell. 2008. Executive pay and shareholder litigation. Review of Finance 12 (1): 141–184.
Poulsen, T., T. T. Strand, and S. S. Thomsen. 2010. Voting power and shareholder activism: A study of Swedish shareholder meetings. Corporate Governance: An International Review 18 (4): 329–343.
Ryan and Simmons. 2007. Securities class action settlements. 2006 Review and Analysis Cornerstone Research, Inc.
Sarra, J., and A. Pritchard. 2010. Securities class actions move north: A doctrinal and empirical analysis of securities class actions in Canada. Alberta Law Review, 47: 881–927.
Strahan, P. 1998. Securities class actions, corporate governance and managerial agency problems. Boston College—Department of Finance; National Bureau of Economic Research. Working paper series.
Zopounidis, C., and M. M. Doumpos. 1999. A multicriteria decision aid methodology for sorting decision problems: The case of financial distress. Computational Economics 14: 197–218.
_________. 1999. Business failure prediction using the UTADIS multicriteria analysis method. Journal of the Operational Research Society 50: 1138–1148.
_________. 2002. Multicriteria classification and sorting methods: A literature review. European Journal of Operational Research 138 (2): 229–246.
1Existing literature concentrates on corporate events such as bankruptcy, mergers, and acquisitions. Most of it shows encouraging results in predictive accuracy, even though they seem to differ according to the event, the country, as well as the methodology used.
2Leverage is calculated as the company's total debt divided by the sum of the company's market value of equity and total debt.
3The empirical work for LA and DA was performed in SPSS, while rest methodologies were applied in MATLAB.