
CHAPTER 12
Predicting Credit Ratings Using a Robust Multicriteria Approach
Technical University of Crete, School of Production Engineering, and Management Financial Engineering Laboratory, Audencia Nantes School of Management, France
INTRODUCTION
Credit risk refers to the probability that an obligor will not be able to meet scheduled debt obligations (i.e., default). Credit risk modeling plays a crucial role in financial risk management, in areas such as banking, corporate finance, and investments. Credit risk management has evolved rapidly over the past decades, but the global credit crisis of 2007–2008 highlighted that there is still much to be done at multiple levels. Altman and Saunders (1997) list five main factors that have contributed to the increasing importance of credit risk management:
- The worldwide increase in the number of bankruptcies
- The trend toward disintermediation by the highest quality and largest borrowers
- The increased competition among credit institutions
- The declining value of real assets and collateral in many markets
- The growth of new financial instruments with inherent default risk exposure, such as credit derivatives
Early credit risk management was primarily based on empirical evaluation systems. CAMEL has been the most widely used system in this context, which is based on the empirical combination of several factors related to capital, assets, management, earnings, and liquidity. It was soon realized, however, that such empirical systems cannot provide a sound basis for credit risk management. This led to an outgrowth of attempts from academics and practitioners, focused on the development of new credit risk assessment systems. These efforts were also motivated by the changing regulatory framework that now requires banks to implement analytic methodologies for managing and monitoring their credit portfolios (Basel Committee on Banking Supervision 2004).
The existing practices are based on sophisticated quantitative techniques, which are used to develop a complete framework for measuring and monitoring credit risk. Credit rating systems are in the core of this framework, and they are widely used for estimating default probabilities, supporting credit-granting decisions, pricing loans, and managing loan portfolios. Credit ratings are either obtained through scoring models developed internally by financial institutions (Treacy and Carey 2000) or are provided externally by credit rating agencies (CRAs).
The risk ratings issued by CRAs have received heavy criticism on their scope and predictive accuracy (e.g., Frost 2007; Pagano and Volpin 2010; Tichy et al. 2011), especially after the recent global credit crunch. The results from several studies actually indicate that such ratings are inferior to internal scoring systems for assessing the risk of financial distress and default. Hilscher and Wilson (2013), however, argue that focusing solely on a firm's default risk may lead to considerable loss of information in credit risk assessment, as systematic risk is also an important yet distinct dimension. Their empirical findings show that this risk dimension is best modeled through credit ratings issued by CRAs. This explains their widespread use by investors, financial institutions, and regulators, and their extensive analysis by academic researchers (for a recent overview, see Jeon and Lovo 2013). In this context, models that explain and replicate the ratings issued by CRAs can be useful in various ways, as they can facilitate the understanding of the factors that drive CRAs’ evaluations, provide investors and regulators with early-warning signals and information for important rating events, and support the credit risk assessment process for firms not rated by the CRAs.
Previous studies have focused on analyzing and predicting credit ratings using mostly firm-specific data (usually in the form of financial ratios) and market variables, using different model building techniques. For instance, Huang et al. (2004) compared two data-mining methods (neural networks and support vector machines) using two data sets from Taiwan and U.S.A. for predicting credit ratings using purely financial ratios. Pasiouras et al. (2006) analyzed the bank credit ratings issued by Fitch for a cross-country sample, using explanatory factors covering the regulatory and supervisory framework and bank-specific characteristics. Hwang et al. (2010) employed an ordered nonlinear semiparametric probit model to predict the ratings issued by Standard and Poor's (S&P) for a static sample of listed U.S. companies, using financial and market variables as well as industry effects. In a similar framework, Mizen and Tsoukas (2012) found that using a nonlinear probit model with state dependencies improves the prediction results, whereas Hwang (2013) further found time-varying effects to be important. On the other hand, Lu et al. (2012) analyzed the information in news articles, combined with financial and market variables, to predict changes in the S&P ratings for firms in the United States. Some studies have also considered default risk estimates from structural models (Hwang et al. 2010; Hwang 2013; Lu et al. 2012), which are based on the contingent claims approach introduced by Black and Scholes (1973) and Merton (1974).
In this study, a multicriteria decision aid (MCDA) methodology is employed. MCDA is well suited to the ordinal nature of credit ratings and the features of studies, through easy-to-comprehend decision models and model fitting techniques that do not rely on statistical assumptions. The applicability of the proposed MCDA approach is tested on a sample of European companies from different countries over the period 2002–2012. While most of the past studies related to the analysis of the ratings issued by CRAs have focused on the United States and the United Kingdom, the ratings of firms in European countries (other than the United Kingdom) have been relatively underexamined.
The focus on European data has some interesting aspects. First, during the past decade, particularly after the outbreak of the European sovereign debt crisis, the role of CRAs has received much attention from authorities, regulators, and governments in Europe. Furthermore, in contrast to U.S. firms, which operate out of a single country, European firms face different economic and business conditions, and the global crisis has not affected all European countries in the same manner. These particular features make it interesting to examine how the findings of studies conducted in other regions and time periods translate into a cross-country European setting, and to investigate the existence of time-varying effects, particularly in light of the ongoing turmoil in the European economic environment.
The rest of the chapter is organized as follows. The next section discusses construction of credit scoring and risk rating models and analyzes the contribution of multicriteria techniques in this field. The following section presents the multicriteria methodology adopted in this study, whereas the fourth section is devoted to the empirical analysis and the discussion of the results. Finally, this chapter proposes some future research directions.
CREDIT SCORING AND RATING
General Framework
Credit risk is defined as the likelihood that an obligor (firm or individual) will be unable or unwilling to fulfill its debt obligations toward the creditors. In such a case, the creditors will suffer losses that have to be measured as accurately as possible.
The expected loss Li over a period T (usually one year) from granting credit to a given obligor i can be measured as follows:
![]()
where PDi is the probability of default for the obligor i in the time period T, LGDi is the percentage of exposure the bank might lose in case the borrower defaults, and EADi is the amount outstanding in case the borrower defaults.
Under the existing regulatory framework of Basel II, default is considered to have occurred with regard to a particular obligor when one or more of the following events has taken place (Basel Committee on Banking Supervision 2004; Hayden 2003):
- It is determined that the obligor is unlikely to pay its debt obligations in full.
- There is a credit loss event associated with any obligation of the obligor.
- The obligor is past due more than 90 days on any credit obligation.
- The obligor has filed for bankruptcy or similar protection from creditors.
The aim of credit-rating models is to assess the probability of default for an obligor, whereas other models are used to estimate LGD and EAD. Rating systems measure credit risk and differentiate individual credits and groups of credits by the risk they pose. This allows bank management and examiners to monitor changes and trends in risk levels, thus promoting safety and soundness in the credit-granting process. Credit-rating systems are also used for credit approval and underwriting, loan pricing, relationship management and credit administration, allowance for loan and lease losses and capital adequacy, credit portfolio management, and reporting (Comptroller of the Currency Administrator of National Banks 2001).
Generally, a credit-ratingmodel can be considered as amapping function f : ![]() K → C that estimates the probability of default of an obligor described by a vector x ∈
K → C that estimates the probability of default of an obligor described by a vector x ∈ ![]() K of input features and maps the result to a set C of risk categories. The feature vector x represents all the relevant information that describes the obligor, including financial and nonfinancial data. For instance, corporate loans, financial ratios, measuring the company's profitability, liquidity, leverage, and so on are usually considered to be important quantitative attributes. Nonfinancial criteria are related to the company's activities, its market position, management quality, growth perspectives, credit history, and the trends in its business sector, for example. Empirical evidence has shown that such nonfinancial attributes significantly improve the estimates of credit scoring and default prediction models (Grunert et al. 2005). Furthermore, market data and estimates from the Black–Scholes–Merton model have also been shown to be strong predictors of credit risk (Doumpos et al. 2014a; Vassalou and Xing 2004).
K of input features and maps the result to a set C of risk categories. The feature vector x represents all the relevant information that describes the obligor, including financial and nonfinancial data. For instance, corporate loans, financial ratios, measuring the company's profitability, liquidity, leverage, and so on are usually considered to be important quantitative attributes. Nonfinancial criteria are related to the company's activities, its market position, management quality, growth perspectives, credit history, and the trends in its business sector, for example. Empirical evidence has shown that such nonfinancial attributes significantly improve the estimates of credit scoring and default prediction models (Grunert et al. 2005). Furthermore, market data and estimates from the Black–Scholes–Merton model have also been shown to be strong predictors of credit risk (Doumpos et al. 2014a; Vassalou and Xing 2004).
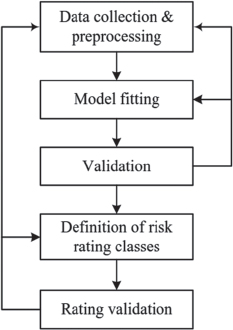
The development of a rating model is based on the process of Figure 12.1. The process begins with the collection of appropriate data regarding known cases with known creditworthiness status (e.g., defaulted and nondefaulted borrowers). These data can be taken from the historical database of a credit institution or from external resources. At this stage, some preprocessing of the data is necessary in order to transform them into useful features, to eliminate possible outliers, and to select the appropriate set of features for the analysis. These steps lead to the final data ![]() , where xi is the input feature vector for obligor i, yi is the actual credit status of the obligor, and M in the number of observations in the data set. These data, which are used for model development, are usually referred to as training data.
, where xi is the input feature vector for obligor i, yi is the actual credit status of the obligor, and M in the number of observations in the data set. These data, which are used for model development, are usually referred to as training data.
The second stage involves the optimization process, which refers to the identification of the model's parameters that best fit the training data. In the simplest case, the model can be expressed as a linear function of the form:
![]()
where β ∈ ![]() K is the vector with the coefficients of the selected features in the model, and β0 is a constant term. Under this setting, the objective of the optimization process is to identify the optimal parameter vector α = (β, β0) that best fits the training data. This can be expressed as an optimization problem of the following general form:
K is the vector with the coefficients of the selected features in the model, and β0 is a constant term. Under this setting, the objective of the optimization process is to identify the optimal parameter vector α = (β, β0) that best fits the training data. This can be expressed as an optimization problem of the following general form:
where A is a set of constraints that define the feasible (acceptable) values for the parameter vector α, X is the training data set, and L is a loss function measuring the differences between the model's output and the given classification of the training observations.
The results of the model optimization process are validated using another sample of obligors with known status. This is referred to as the validation sample. Typically, it consists of cases different than the ones of the training sample and for a future time period. The optimal model is applied to these new observations, and its predictive ability is measured. If this is acceptable, then the model's outputs are used to define a set of risk rating classes (usually, 10 classes are used). Each rating class is associated with a probability of default, and it includes borrowers with similar credit risk levels. The defined rating needs also to be validated in terms of its stability over time, the distribution of the borrowers in the rating groups, and the consistency between the estimated probabilities of default in each group and the empirical ones that are taken from the population of rated borrowers.
Multicriteria Aspects of Credit Rating
From the methodological point of view, credit scoring for business and consumer loans is a statistical pattern classification problem, as the decision models are constructed on the basis of historical default data. Nevertheless, some features that analysts often require scoring models to have (Krahnen and Weber 2001) make MCDA techniques appealing in this context. In particular (Doumpos and Zopounidis 2014):
- Credit scoring models are usually required to be monotone with respect to the inputs. From an economic and business perspective, the monotonicity assumption implies that as the input information for a given applicant improves, the estimated probability of default should decrease. Assuming that all attributes are in a maximization form, the monotonicity assumption can be formally expressed as follows:
where Pr(D|xi) is the estimated probability of default for credit applicant i, and f represents the dominance relationship, defined as follows: xi
 xj ⇔ xi ≥ xj and xik > xjk, for at least one attribute k.
Models that violate monotonicity in an arbitrary manner may fail to be accepted, simply because they lack economic sense, thus providing counterintuitive results from an economic perspective. Furthermore, empirical results have shown that introducing monotonicity in credit-scoring models actually improves their predictive performance and robustness, through the elimination of the overfitting effect (Doumpos and Zopounidis 2009).
- Credit-scoring models should be transparent and comprehensible. The predictive ability of credit-rating models is not the sole decisive factor for their success in practice. In addition to being accurate, credit risk–rating models should also be easy to understand by analysts, end users, and regulators. A comprehensible model enables its user to understand its underlying logic and provide justifications on its recommendations (Martens and Baesens 2010; Martens et al. 2011), instead of simply being used as a blackbox analytic recommendation tool.
- Risk grades are ordinal. This is often ignored by many popular statistical and computational intelligence techniques used for model building, which often assume that the classes are nominal (i.e., in no particular order).
Multicriteria decision models fit well these requirements: (1) they are by definition ordinal; (2) they provide evaluation results that are monotone with respect to the evaluation criteria; and (3) they promote transparency, enabling the credit analyst to calibrate them on the basis of his/her expert domain knowledge and allowing for justification of the obtained results. Among others, MCDA methods have been used in the area of credit scoring and risk-rating (and the relevant field of financial distress prediction) in four different ways:
- As tools for building accurate and transparent credit-risk assessment systems, customized to the needs of particular financial institutions (Bana e Costa et al. 2002; García et al. 2013). This is particularly important for special types of credit (e.g., project finance) for which historical data may be lacking. In such cases, MCDA methods can greatly enhance peer expert judgment systems, facilitating the structuring of the credit-granting evaluation process and providing formal procedures for aggregating multiple credit evaluation criteria.
- In combination with other modeling and learning techniques, including rough sets, fuzzy models, case-based reasoning, and neural networks (Capotorti and Barbanera 2012; Hu 2009; Vukovic et al. 2012; Yu et al. 2009). Such computational intelligence techniques provide strong data analysis capabilities. MCDA, on the other hand, provides axiomatic decision models of different forms.
- As optimization approaches for model fitting under multiple performance measures (He et al. 2010; Li et al. 2011; Odeh et al. 2011). The performance of a credit-rating model has different aspects, including statistical (e.g., different measures of predictive accuracy) and economic (profit/costs derived from actions taken on the basis of the results of a risk assessment model). Multi-objective optimization techniques enable the consideration of such multiple performance measures when building a credit-rating model.
- As alternatives to popular statistical and machine learning approaches providing more accurate rating results (Doumpos and Pasiouras 2005; Doumpos and Zopounidis 2011; Hu and Chen 2011). The results from several studies show that credit-scoring models constructed using MCDA techniques provide robust and accurate results, often actually outperforming other popular approaches. Thus, they could be considered as potential candidates for constructing credit scoring and rating models.
MULTICRITERIA METHODOLOGY
Modeling Approach
MCDA provides a variety of approaches for credit risk modeling and the construction of credit scoring systems, including outranking techniques (Doumpos and Zopounidis 2011; Hu and Chen 2011), rule-based models (Capotorti and Barbanera 2012; Vukovic et al. 2012; Yu et al. 2009), and value models (Bana e Costa et al. 2002; Doumpos and Pasiouras 2005; Doumpos 2012).
To facilitate the presentation this study focuses on additive value models in the framework of the UTADIS method (Doumpos and Zopounidis 2002; Zopounidis and Doumpos 1999). Additive models are popular approaches for credit risk modeling, as they are intuitive scoring systems that are simple to understand and implement, and they are compatible with the scorecard structure of credit rating systems used in practice (Siddiqi 2006). For instance, Krahnen and Weber (2001) conducted a survey among major German banks and found that all of them used credit scoring models expressed in the form of an additive value function:
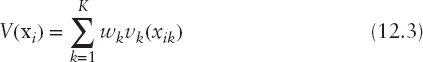
where the global value V(xi) is an estimate of the overall creditworthiness and default risk of obligor i.
In this model, the overall assessment is a weighted average of partial scores v1(xi1),…, vk(xiK) defined over a set of K credit risk assessment criteria. Without loss of generality, we shall assume that the weighting trade-off constants are non-negative and normalized such that w1 + w2 + · · · + wK = 1. On the other hand, the marginal value functions v1(·),…, vK(·), which define the partial scores, are scaled such that vk(xk∗) = 0 and ![]() , where xk∗ and
, where xk∗ and ![]() are the most and least risky level of risk attribute k, respectively. For simplicity, henceforth it will be assumed that all risk assessment criteria are expressed in maximization form (thus implying that all marginal value functions are nondecreasing).
are the most and least risky level of risk attribute k, respectively. For simplicity, henceforth it will be assumed that all risk assessment criteria are expressed in maximization form (thus implying that all marginal value functions are nondecreasing).
The construction of the credit-scoring model (12.3) can be simplified by setting uk(xk) = wkvk(xk), which leads to a rescaled set of marginal value functions u1,…, uK normalized in [0, wk]. With this transformation, the evaluation model (12.3) can be rewritten in the following equivalent form:

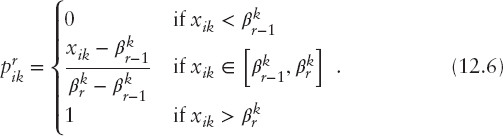
This decision model can be linear or nonlinear, depending on the form of the marginal value functions. The marginal value functions can be either prespecified by risk analysts or inferred directly from the data using a preference disaggregation approach. In the context of credit rating, the latter approach is the preferred one, particularly when there are historical data available for constructing the model. Under this scheme, a convenient and flexible way to take into consideration a wide class of monotone marginal value functions is to assume that they are piecewise linear. In that regard, the range of each risk criterion k is split into sk + 1 subintervals defined by sk breakpoints ![]() , between the least and the most preferred levels of the criterion (denoted by
, between the least and the most preferred levels of the criterion (denoted by ![]() and
and ![]() , respectively), as illustrated in Figure 12.2. Thus, the marginal value of any alternative i on criterion k can be expressed as:
, respectively), as illustrated in Figure 12.2. Thus, the marginal value of any alternative i on criterion k can be expressed as:


where ![]() is the difference between the marginal values at two consecutive levels of criterion k and
is the difference between the marginal values at two consecutive levels of criterion k and
With the above piecewise linear modeling of the marginal value functions, the scoring model (12.4) can be expressed as a linear function of the step differences in the marginal values between consecutive breakpoints in the criteria's scale:

where ![]() and
and ![]() .
.
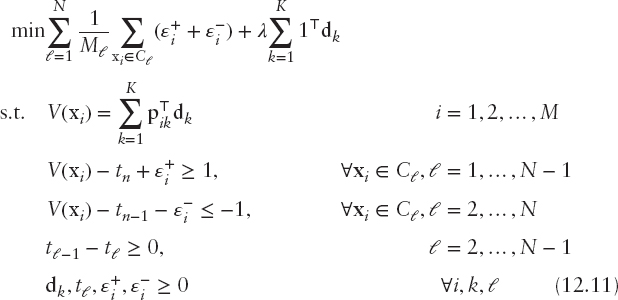
The parameters of model (12.7) can be estimated in the context of the MCDA disaggregation paradigm (Jacquet-Lagrèze and Siskos 2001) with nonparametric linear programming formulations, using data for obligors classified into predefined risk classes. In a general setting, assume that reference (training) data for M1, M2, …, MN obligors are available from N risk classes C1, …, CN, defined such that C1 is the low-risk category and CN the higher-risk one. The rating imposed by model V(x) are made on the basis of the following classification rule:
Obligor i belongs in risk category 1 if and only if
where 1 > t1 > t2 > · · · > tN−1 > 0 are score thresholds that distinguish the risk classes.
The scoring model and thresholds that best fit the previous rule, according to the available training data, can be estimated through the solution of the following linear programming problem:
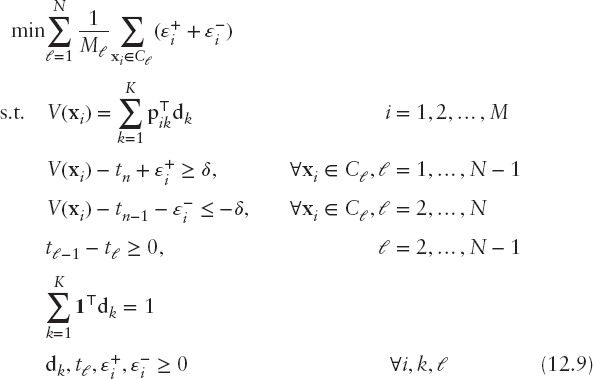
where 1 is a vector of ones. The first set of constraints defines the credit scores for the training cases according to the additive model (12.7). The second set of constraints defines the violations (ε+) of the lower bound of each risk class (this applies only to obligors belonging to classes C1,…, CN−1), whereas the third set of constraints defines the violations (ε−) of the upper bound of each risk category (this applies only to the obligors belonging to classes C2,…, CN). In both constraints δ is a small positive user-defined constant used to model the strict inequalities of the classification rule (12.8). The fourth constraint is used to ensure that the thresholds are monotonically nonincreasing, whereas the last constraint normalizes the additive model so that the maximum score for any obligor is one.
The objective function involves the minimization of the model's fitting error. This is defined as the weighted sum of the errors for cases belonging into different classes, where the weights are defined in terms of the number of sample observations in each class. In this way, it is possible to handle training sets with considerable imbalanced class sizes, which are very common in credit rating (e.g., the number of obligors is default is much lower than the nondefaulted obligors).
The use of linear programming for model fitting enables the handling of big data sets. This is particularly important for credit scoring, as the available data become larger, particularly after the introduction of the Basel II regulatory framework. Furthermore, a linear programming model enables the risk analyst to incorporate special domain knowledge, which can be very useful for calibrating the model with expert judgment, in order to capture aspects of the problem not adequately covered by the data.
Robust Formulation
Robustness analysis has emerged over the past decade as a major research issue in MCDA. Vincke (1999) emphasized that robustness should not be considered in the restrictive framework of stochastic analysis and distinguished between robust solutions and robust methods. He further argued that although robustness is an appealing property, it is not a sufficient condition to judge the quality of a method or a solution. Roy (2010), on the other hand, introduced the term robustness concern to emphasize that robustness is taken into consideration a priori rather than a posteriori (as is the case of sensitivity analysis). In the framework of Roy, the robustness concern is raised by vague approximations and zones of ignorance that cause the formal representation of a problem to diverge from the real-life context, due to: (1) the way imperfect knowledge is treated; (2) the inappropriate preferential interpretation of certain types of data (e.g., transformations of qualitative attributes); (3) the use of modeling parameters to grasp complex aspects of reality; and (4) the introduction of technical parameters with no concrete meaning.
The robustness concern is particularly important when inferring MCDA decision models from data through disaggregation formulations. The quality of the inferred models is usually described in terms of their accuracy, but their robustness is also a crucial issue. Recent experimental studies have shown that robustness and accuracy are closely related (Doumpos et al. 2014b; Vetschera et al. 2010). However, accuracy measurements are done ex-post and rely on the use of additional test data, while robustness is taken into consideration ex-ante, thus making it an important issue that is taken into consideration before a decision model is actually put into practical use.
The robustness concern in this context arises because, in most cases, alternative decision models can be inferred in accordance with the information embodied in a set of training cases. This is evident in cases where the solution of optimization formulations such as (12.9) is not unique. Different optimal solutions may result in very different decision models, yielding results that may vary significantly when used to evaluate the risk level for cases outside the training set. Furthermore, even if the optimal solution is unique under the selected model fitting criterion for a given training sample, near optimal solutions may actually yield more meaningful models with improved robustness with regard to data variations.
The complexity of the inferred decision model is also an issue that is related to its robustness. Simpler models are more robust compared to more complex nonlinear models. The latter are defined by a larger number of parameters and, as a result, the inference procedure becomes less robust and more sensitive to the available data. Therefore, care should be given to the selection of the appropriate modeling form, taking into account the available data. This issue has been studied extensively in areas such as the statistical learning theory (Schölkopf and Smola 2002; Vapnik 2000).
Following this direction, Doumpos and Zopounidis (2007) presented simple modifications of traditional optimization formulations (such as the one discussed in previous section) on the grounds of the regularization principle, which is widely used in data mining and statistical learning (Vapnik 2000). From a data mining/statistical learning perspective, robustness involves the ability of a prediction model (or learning algorithm) to retain its structure and provide accurate results in cases where the learning process is based on data that contain imperfections (i.e., errors, outliers, noise, missing data, etc.). Given that the robustness of a prediction model is related to its complexity, statistical learning has been founded on a rigorous theoretical framework that connects robustness, complexity, and the accuracy of prediction models.
The foundations of this theoretical framework are based on Tikhonov's regularization principle (Tikhonov et al. 1995), which involves systems of linear equations of the form Ax = b. When the problem is ill-posed, such a system of equations may not have a solution and the inverse of matrix A may exhibit instabilities (i.e., A may be singular or ill-conditioned). In such cases, a numerically robust solution can be obtained through the approximate system Ax ≈ b, such that the following function is minimized:
where λ > 0 is a regularization parameter that defines the trade-off between the error term ||Ax − b||2 and the “size” of the solution (thus controlling the solution for changes in A and b).
Following this approach, Doumpos and Zopounidis (2007) reformulated problem (12.9) as follows:
In this formulation, the objective function combines two terms. The first involves the minimization of the model's fitting error, similarly to formulation (12.9). The second term in the objective function is in accordance with Tikhonov's regularization. The parameter λ > 0 defines the trade-off between the minimization of the fitting error and the complexity of the model, which can be set by trial-and-error or with statistical resampling techniques.
Denoting by ![]() the optimal parameters of the model resulting from the solution of the earlier linear program, the constructed additive value function is scaled between zero and
the optimal parameters of the model resulting from the solution of the earlier linear program, the constructed additive value function is scaled between zero and ![]() . Rescaling the model in [0, 1] can be easily done simply by dividing the optimal solution by θ.
. Rescaling the model in [0, 1] can be easily done simply by dividing the optimal solution by θ.
EMPIRICAL ANALYSIS
Data and Variables
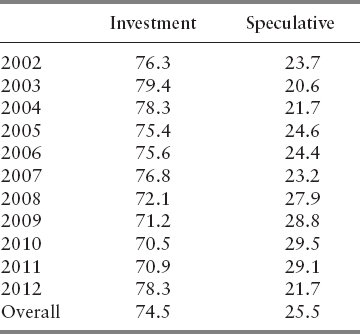
The empirical analysis is based on a panel data set consisting of 1,325 firm-year observations involving European listed companies over the period 2002–2012. The sample covers eight different countries and five business sectors, as illustrated in Table 12.1.
Financial data for the firms in the sample were collected from the Osiris database, whereas Bloomberg was used to get the firms’ ratings from S&P. Due to the sparsity of the data set with respect to the number of observations from each rating grade in the S&P scale, the observations were regrouped. In particular, a two-group setting is considered distinguishing between firms in speculative (D to BB+) and investment grades (BBB to AAA). The percentage of observations in each rating group under these schemes is shown in Table 12.2.

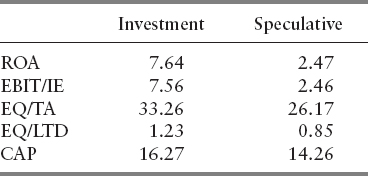
For every observation in the sample for year t, the S&P long-term rating is recorded at the end of June, while annual financial data are taken from the end of year t − 1. The financial data involve four financial ratios: ROA (earnings before taxes/total assets), interest coverage (earnings before interest and taxes/interest expenses, EBIT/IE), solvency (equity/total assets, EQ/TA), and the long-term debt leverage ratio (equity/long term debt, EQ/LTD). ROA is the primary indicator used to measure corporate profitability. Interest coverage assesses firms’ ability to cover their debt obligations through their operating profits. The solvency ratio analyzes the capital adequacy of the firms, whereas the long-term debt leverage ratio takes into consideration the long-term debt burden of firms relative to their equity. In addition to these financial ratios, we also take into account the size of firms, as measured by the logarithm of their market capitalization (CAP).
Table 12.3 presents the averages (over all years) of the financial variables for the two rating groups in the sample. All variables have a clear monotone (increasing) relationship with the ratings. In particular, firms in investment grades are more profitable, have higher interest coverage, are better capitalized and leveraged in terms of long-term debt, and have higher market capitalization. The differences between the rating groups are statistically significant at the 1 percent level for all variables under the Mann–Whitney nonparametric test.
Results
Given that during the time period spanned by the data, the European economic environment has experienced significant changes (e.g., the outbreak of the global crisis and the European sovereign debt crisis), the dynamics and robustness of the results over time are tested by developing and validating a series of models through a walk-forward approach. In particular, the data for the period 2002–2005 are first used for model fitting, whereas the subsequent period, 2006–2012, serves as the holdout sample. In a second run, the training data are extended up to 2006, and the holdout data span the period 2007–2012. The same process is repeated up to the case where the training data cover the period 2002–2010. Thus, six training and test runs are performed. Henceforth, these walk-forward runs will be referred to as F05 (model fitting on data up to 2005) up to F10 (model fitting on data up to 2010).
Table 12.4 summarizes the trade-offs of the predictor attributes in all models constructed through the walk-forward approach. It is evident that the size of the firms as measured by their capitalization is the dominant factor that explains the ratings, even though its relative importance has decreased over the years. The significance of market capitalization has also been reported by Hwang et al. (2010) and Hwang (2013), who derived similar results for U.S. firms. The profitability of the firms is also an important dimension, as evident by the relative importance of the ROA indicator. On the other hand, interest coverage was mainly important in the first years of the analysis, but its explanatory power appears to be weaker in the models that consider more recent data. At the same time, the importance of the equity to long-term debt has increased considerably, thus indicating that over the crisis leverage has become a crucial factor for explaining the credit ratings of the firms. Finally, the solvency ratio (equity to assets) appears to be the weaker predictor overall, throughout all years of the analysis.
Figure 12.3 provides further information on the marginal value functions of the attributes in the models, which indicate how the firms are evaluated under each risk-assessment criterion. The results are quite robust over all six models developed over different time periods. In terms of the ROA indicator, the form of the corresponding marginal value function shows that firms with positive ROA receive much higher rating compared to firms whose profitability is negative. A similar result is also evident for the long-term leverage ratio (EQ/LTD). Finally, as far as size is concerned, the performance score of the firms increases (almost in a linear way) for firms with market capitalization approximately above 700 million euros. Such insights provide analysts with useful information about the rating models, thus enhancing their transparency and comprehensibility, which has been found to be important for their successful use in practice (Martens and Baesens 2010; Martens et al. 2011).

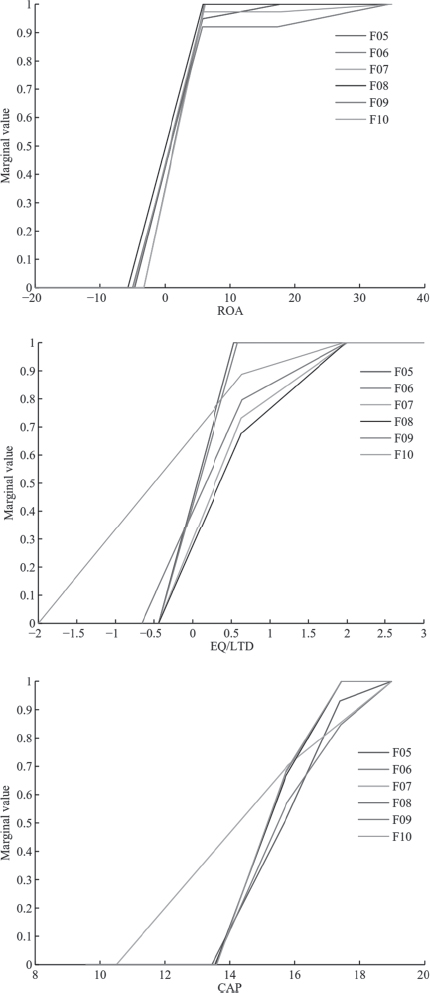

Table 12.5 presents results for the classification accuracies of all models in the holdout samples. Classification accuracy is defined as the ratio between the number of correct class assignments by a model (i.e., cases where the ratings estimated by the model coincide with the actual ratings) to the total number of observations being rated. All the reported results involve the holdout samples, which correspond to future time periods compared to the data used to fit the models. Table 12.5 reports the accuracy rates separately for cases in investment and speculative grades, together with the overall accuracy. For comparative purposes, the overall accuracies of models fitted with logistic regression (LR) are also presented. LR is probably the most popular method used by researchers and practitioner for constructing credit scoring and rating models. The results indicate that the accuracy rates of the multicriteria models are consistently higher for investment-rated firms, whereas firms rated in speculative grades are more difficult to describe. The overall accuracy of all models is consistently higher than 81 percent, and the proposed multicriteria methodology provides more accurate results compared to logistic regression.
CONCLUSIONS AND FUTURE PERSPECTIVES
The analysis of the ratings issued by CRAs has received much attention in the financial literature, due to their significance in the context of credit risk management and their widespread use by investors, policymakers, and managers. In this study, we sought to explain and predict the credit ratings issued by S&P on the basis of financial and market data, using a cross-country panel data set from Europe over the period 2002–2012. For the analysis, an innovative nonparametric multicriteria technique was employed, which is based on a linear programming formulation for fitting additive credit-risk rating models to data.
The results showed that the market capitalization appears to be the dominant factor for explaining the credit ratings of European firms. Profitability was also found to be an important dimension, together with long-term leverage, which has become an important issue, particularly after the outbreak of the crisis. The developed multicriteria models exhibit good and robust behavior, whereas its performance was found to be superior to logistic regression.
These empirical results could be extended in a number of directions. First, additional predictor attributes could be considered, focusing on macroeconomic factors, which could be of particular importance over the business cycle and during economic turmoil, providing a better description of cross-country differences. Data related to market sentiment and information from the CDS markets could also be useful for predicting credit ratings by complementing the estimates of structural models with timely findings on market trends. Variables related to regulatory frameworks (Cheng and Neamtiu 2009) and corporate governance (Alali et al. 2012) are also important for the analysis of credit ratings in a comprehensive context. Second, except for only focusing on static analyses of credit ratings, the explanation and prediction of rating changes is also a crucial point of major interest to market participants. The investigation could also be extended to cover nonlisted companies. Finally, the combination of financial data, structural models, and credit ratings in an integrated risk management context could be considered, in accordance with the findings reported in recent studies (e.g., Das et al. 2009; Hilscher and Wilson 2013) on the possible synergies that can be derived by combining different types of risk models and measures in credit risk assessment.
REFERENCES
Alali, F., A. Anandarajan, and W. Jiang. 2012. The effect of corporate governance on firms credit ratings: Further evidence using governance score in the United States. Accounting and Finance 52 (2): 291–312.
Altman, E. I., and A. Saunders. 1997. Credit risk measurement: Developments over the last 20 years. Journal of Banking and Finance 21 (11–12): 1721–1742.
Bana e Costa, C. A., L. Barroso, and J. O. Soares. 2002. Qualitative modeling of credit scoring: A case study in banking. Journal of European Research Studies 5 (1–2): 37–51.
Basel Committee on Banking Supervision. 2004. International convergence of capital measurement and capital standards: A revised framework. Bank for International Settlements, Basel, Switzerland.
Black, F., and M. Scholes. 1973. The pricing of options and corporate liabilities. Journal of Political Economy 81 (3): 637–659.
Capotorti, A., and E. Barbanera. 2012. Credit scoring analysis using a fuzzy probabilistic rough set model. Computational Statistics and Data Analysis 56 (4): 981–994.
Cheng, M., and M. Neamtiu. 2009. An empirical analysis of changes in credit rating properties: Timeliness, accuracy and volatility. Journal of Accounting and Economics 47 (1–2): 108–130.
Comptroller of the Currency Administrator of National Banks. 2001. Rating Credit Risk: Comptroller's Handbook. Washington, DC: U.S. Department of Treasury.
Das, S. R., P. Hanouna, and A. Sarin. 2009. Accounting-based versus market-based cross-sectional models of CDS spreads. Journal of Banking and Finance 33 (4): 719–730.
Doumpos, M. 2012. Learning non-monotonic additive value functions for multicriteria decision making. OR Spectrum 34 (1): 89–106.
Doumpos, M., D. Niklis, C. Zopounidis, and K. Andriosopoulos. 2014a. Combining accounting data and a structural model for predicting credit ratings: Empirical evidence from European listed firms. Journal of Banking & Finance (forthcoming).
Doumpos, M., and F. Pasiouras. 2005. Developing and testing models for replicating credit ratings: A multicriteria approach. Computational Economics 25 (4): 327–341.
Doumpos, M., and C. Zopounidis. 2002. Multicriteria Decision Aid Classification Methods. New York: Springer.
_________. 2007. Regularized estimation for preference disaggregation in multiple criteria decision making. Computational Optimization and Applications 38 (1): 61–80.
_________. 2009. Monotonic support vector machines for credit rating. New Mathematics and Natural Computation 5 (3): 557–570.
_________. 2011. A multicriteria outranking modeling approach for credit rating. Decision Sciences 42 (3): 721–742.
_________. 2014. Multicriteria Analysis in Finance. Berlin, Heidelberg: Springer.
Doumpos, M., C. Zopounidis, and E. Galariotis. 2014b. Inferring robust decision models in multicriteria classification problems: An experimental analysis. European Journal of Operational Research 236: 601–611.
Frost, C. A. 2007. Credit rating agencies in capital markets: A review of research evidence on selected criticisms of the agencies. Journal of Accounting, Auditing and Finance 22 (3): 469–492.
García, F., V. Giménez, and F. Guijarro. 2013. Credit risk management: A multicriteria approach to assess creditworthiness. Mathematical and Computer Modeling 57 (7–8): 2009–2015.
Grunert, J., L. Norden, and M. Weber. 2005. The role of non-financial factors in internal credit ratings. Journal of Banking and Finance 29 (2): 509–531.
Hayden, E. 2003. Are credit scoring models sensitive with respect to default definitions? evidence from the Austrian market. Tech. rep., University of Vienna.
He, J., Y. Zhang, Y. Shi, and G. Huang. 2010. Domain-driven classification based on multiple criteria and multiple constraint-level programming for intelligent credit scoring. IEEE Transactions on Knowledge and Data Engineering 22 (6): 826–838.
Hilscher, J., and M. Wilson. 2013. Credit ratings and credit risk: Is one measure enough? Tech. rep., AFA 2013 San Diego Meeting.
Hu, Y.-C. 2009. Bankruptcy prediction using ELECTRE-based single-layer perception. Neurocomputing 72: 3150–3157.
Hu, Y.-C., and C.-J. Chen. 2011. A PROMETHEE-based classification method using concordance and discordance relations and its application to bankruptcy prediction. Information Sciences 181 (22): 4959–4968.
Huang, Z., H. Chen, C.-J. Hsu, W.-H. Chen, and S. Wu. 2004. Credit rating analysis with support vector machines and neural networks: A market comparative study. Decision Support Systems 37 (4): 543–558.
Hwang, R.-C. 2013. Forecasting credit ratings with the varying-coefficient model. Quantitative Finance 13 (2): 1–19.
Hwang, R.-C., H. Chung, and C. Chu. 2010. Predicting issuer credit ratings using a semiparametric method. Journal of Empirical Finance 17(1): 120–137.
Jacquet-Lagrèze, E., and Y. Siskos. 2001. Preference disaggregation: Twenty years of MCDA experience. European Journal of Operational Research 130 (2): 233–245.
Jeon, D.-S., and S. Lovo. 2013. Credit rating industry: A helicopter tour of stylized facts and recent theories. International Journal of Industrial Organization 31 (5): 643–651.
Krahnen, J. P., and M. Weber. 2001. Generally accepted rating principles: A primer. Journal of Banking and Finance 25 (1): 3–23.
Li, J., L. Wei, G. Li, and W. Xu. 2011. An evolution strategy-based multiple kernels multi-criteria programming approach: The case of credit decision making. Decision Support Systems 51 (2): 292–298.
Lu, H.-M., F.-T. Tsai, H. Chen, M.-W. Hung, and H. Li. 2012. Credit rating change modeling using news and financial ratios. ACM Transactions on Management Information Systems 3 (3): 14:1–14:30.
Martens, D., and B. Baesens. 2010. Building acceptable classification models. In Data Mining, edited by R. Stahlbock, S. F. Crone, and S. Lessmann, 53–74, New York: Springer.
Martens, D., J. Vanthienen, W. Verbeke, and B. Baesens. 2011. Performance of classification models from a user perspective. Decision Support Systems 51 (4): 782–793.
Merton, R. C. 1974. On the pricing of corporate debt: The risk structure of interest rates. The Journal of Finance 29 (2): 449–470.
Mizen, P., and S. Tsoukas. 2012. Forecasting U.S. bond default ratings allowing for previous and initial state dependence in an ordered probit model. International Journal of Forecasting, 28 (1): 273–287.
Odeh, O., P. Koduru, A. Featherstone, S. Das, and S. M. Welch. 2011. A multi-objective approach for the prediction of loan defaults. Expert Systems with Applications 38 (7): 8850–8857.
Pagano, M., and P. Volpin. 2010. Credit ratings failures and policy options. Economic Policy 25 (62): 401–431.
Pasiouras, F., C. Gaganis, and C. Zopounidis. 2006. The impact of bank regulations, supervision, market structure, and bank characteristics on individual bank ratings: A cross-country analysis. Review of Quantitative Finance and Accounting 27 (4): 403–438.
Roy, B. 2010. Robustness in operational research and decision aiding: A multifaceted issue. European Journal of Operational Research 3: 629–638.
Schölkopf, B., and A. Smola. 2002. Learning with Kernels: Support Vector Machines, Regularization, Optimization and Beyond. Cambridge, MA: MIT Press.
Siddiqi, N. 2006. Credit Risk Scorecards. Hoboken, NJ: John Wiley & Sons.
Tichy, G., K. Lannoo, O. Gwilym, R. Alsakka, D. Masciandaro, and B. Paudyn. 2011. Credit rating agencies: Part of the solution or part of the problem? Intereconomics 46 (5): 232–262.
Tikhonov, A., A. Goncharsky, V. Stepanov, A. G., Yagola, A. G. 1995. Numerical Methods for the Solution of Ill-Posed Problems. Dordrecht: Springer.
Treacy, W. F., and M. Carey. 2000. Credit risk rating systems at large U.S. banks. Journal of Banking and Finance 24 (1–2): 167–201.
Vapnik, V. 2000. The Nature of Statistical Learning Theory, 2nd ed. New York: Springer.
Vassalou, M., and Y. Xing. 2004. Default risk in equity returns. Journal of Finance 59 (2): 831–868.
Vetschera, R., Y. Chen, K. W. Hipel, and D. Marc Kilgour. 2010. Robustness and information levels in case-based multiple criteria sorting. European Journal of Operational Research 202 (3): 841–852.
Vincke, P. 1999. Robust solutions and methods in decision-aid. Journal of Multi-Criteria Decision Analysis 8 (3): 181–187.
Vukovic, S., B. Delibasic, A. Uzelac, and M. Suknovic. 2012. A case-based reasoning model that uses preference theory functions for credit scoring. Expert Systems with Applications 39 (9): 8389–8395.
Yu, L., S. Wang, and K. Lai. 2009. An intelligent-agent-based fuzzy group decision making model for financial multicriteria decision support: The case of credit scoring. European Journal of Operational Research 195 (3): 942–959.
Zopounidis, C., and M. Doumpos. 1999. A multicriteria decision aid methodology for sorting decision problems: The case of financial distress. Computational Economics 14 (3): 197–218.